Mineral County is a mountain county where natural cover dominates almost every part of the map. In the 2025 summary, forest accounts for 53.04 percent of the county, shrubland for 24.77 percent, grassland for 12.64 percent, wetlands for 5.10 percent, and barren cover for 3.08 percent. Agriculture is only 0.12 percent. That combination produces a very different landscape from Colorado counties where large fields or urban areas define the view: here, broad forests are broken by shrub and grass openings, wet valleys, exposed high ground, and only a small amount of development.
Four maps are provided on this page: current land cover, forest and farmland, impervious/developed land, and a 1985–2025 mapped class comparison. The WebP versions are embedded for quick viewing, while the download section provides all four original JPG files in one ZIP. Looking at the current pattern first, then the built footprint near Creede, followed by water and long-term class differences, gives a clear picture of how little of Mineral County is covered by intensive human surfaces.
Table of Contents
A forest-first landscape is the defining 2025 pattern
Forest is the dominant mapped class at 53.04 percent, and its distribution is broad rather than confined to one corner. Large green areas cover much of the central, southern, and eastern county, with additional forest continuing through the north. Shrubland, the second-largest class at 24.77 percent, fills many of the more open mountain slopes and high country between forested areas. Grassland contributes another 12.64 percent, creating lighter openings that interrupt the darker forest blocks.
Wetlands and barren land are smaller in percentage terms but important to the visual structure of the county. Wetlands make up 5.10 percent and often appear as narrow, irregular bands associated with valley bottoms and water. Barren cover accounts for 3.08 percent and is most noticeable where exposed ground breaks up vegetation on high or steep terrain. The map therefore does not describe Mineral County as one continuous forest; it shows a mountain mosaic with vegetation and open surfaces changing over short distances.
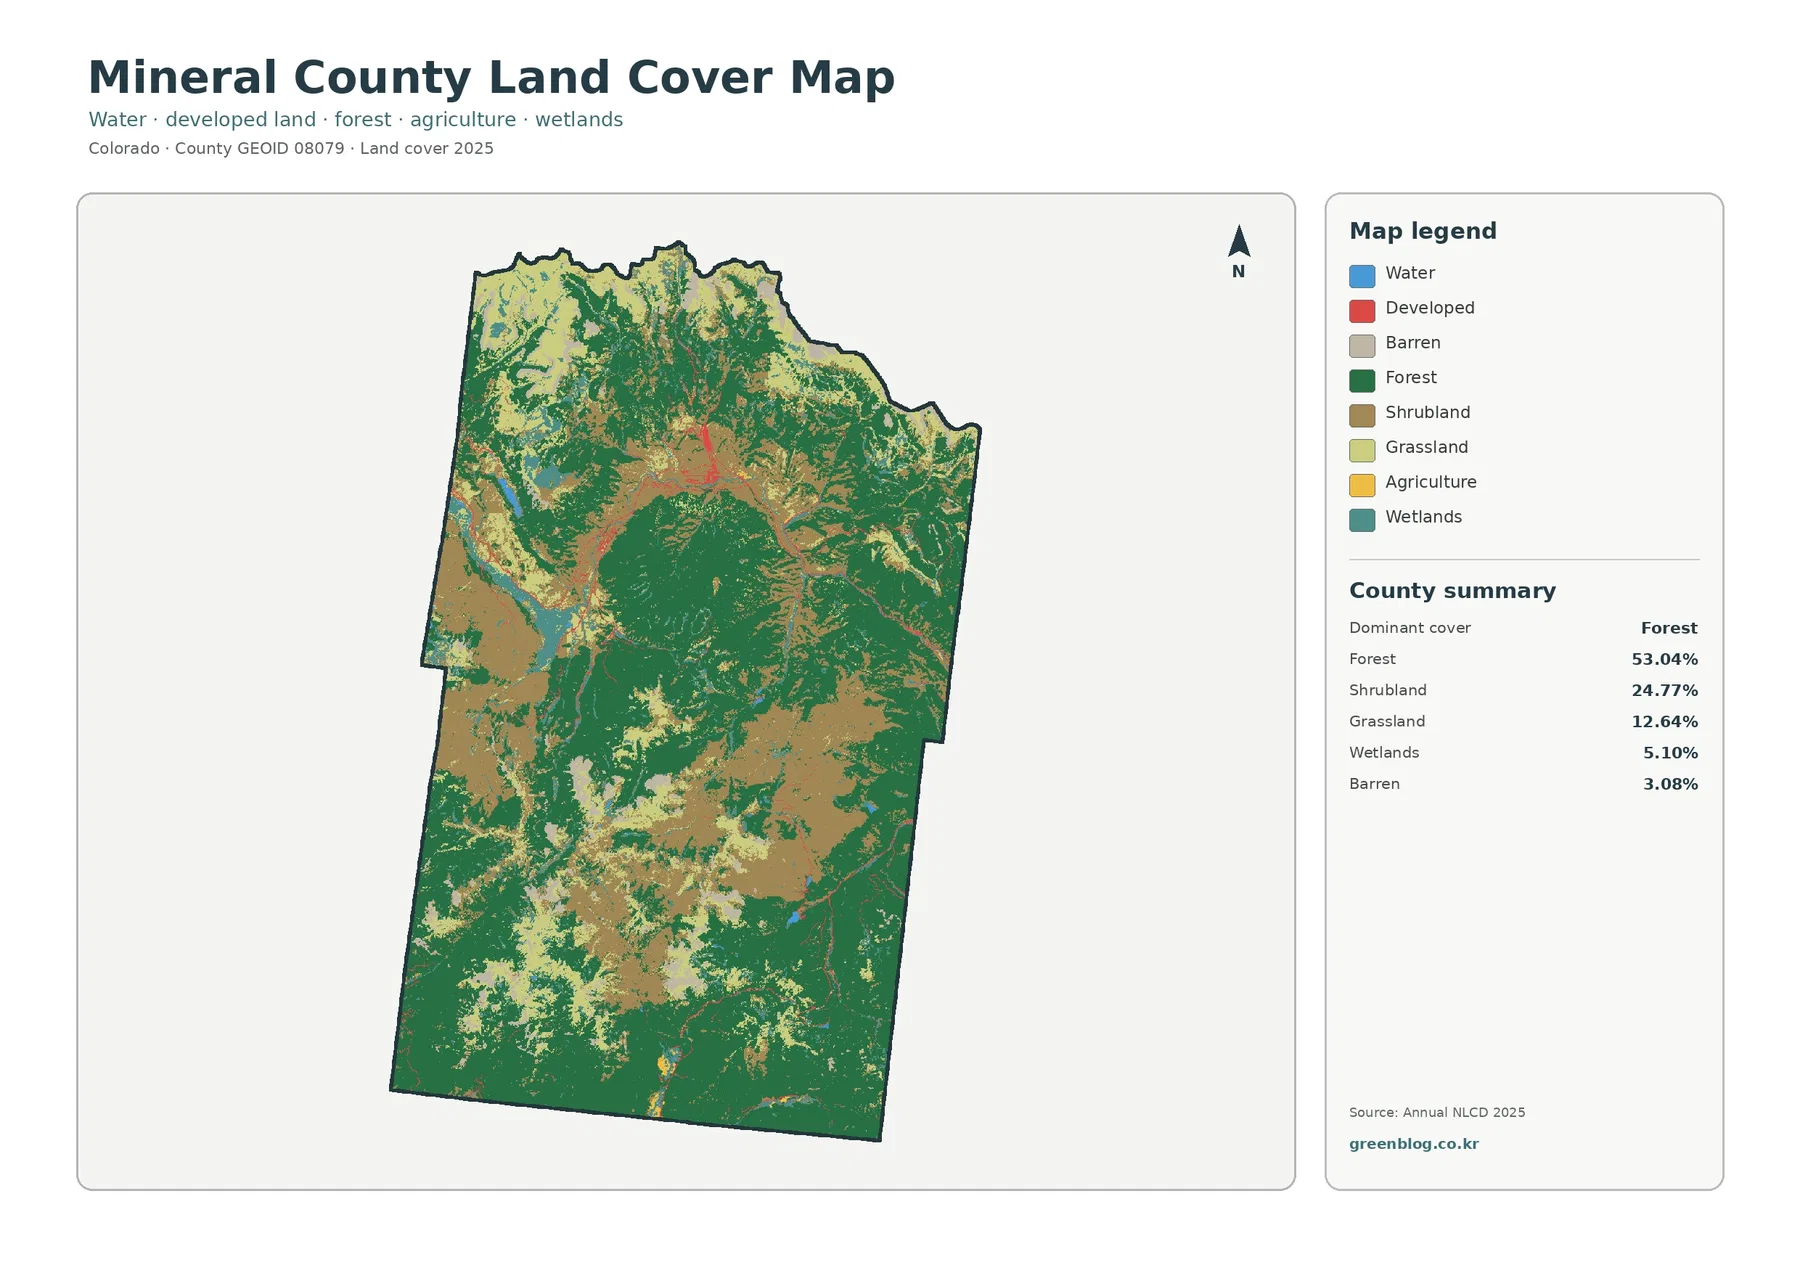
The current map is the best starting point because it keeps every major class in view at once. It makes the countywide dominance of natural cover obvious while also preserving the small red developed patches and blue-green water or wetland features. Those small classes matter most when their locations are compared with the surrounding forest and open vegetation, not when they are judged only by countywide percentage.
The built footprint is small, concentrated, and easiest to see around Creede
Developed cover represents 1.07 percent of Mineral County in the 2025 summary. The most visible developed cluster sits in the north-central part of the county around Creede, the county seat and only incorporated town. Smaller traces extend away from that cluster as thin lines and scattered spots associated with roads, facilities, and other built surfaces. Most of the county has no comparable concentration, which makes the contrast between Creede and the surrounding mountain cover especially sharp.
Creede is located at the headwaters of the Rio Grande and serves as the administrative center for Mineral County. That local context helps explain why the strongest built pattern appears there, but the land-cover map itself does not draw municipal limits or property boundaries. A red developed cell records a surface class in the imagery; it does not say whether the land is inside the town boundary, what a building is used for, or what future construction is permitted.
This distinction matters in a county where roads and settlements occupy very little area compared with forest and shrubland. A narrow linear feature can be visually important even when its percentage contribution is tiny. When the goal is to study access routes or individual structures, aerial imagery and road data are more appropriate. The land-cover maps are better for seeing how built surfaces fit into the much larger natural landscape.
Impervious cover isolates the human-made surfaces that the general map can hide
Impervious surface means pavement, rooftops, parking areas, and other hard surfaces that do not readily absorb water. Mineral County has a mean impervious value of just 0.26 percent, and only 0.07 percent of the county is mapped at 50 percent impervious or higher. Those figures are consistent with the very small developed share, but the dedicated impervious map adds useful location detail.
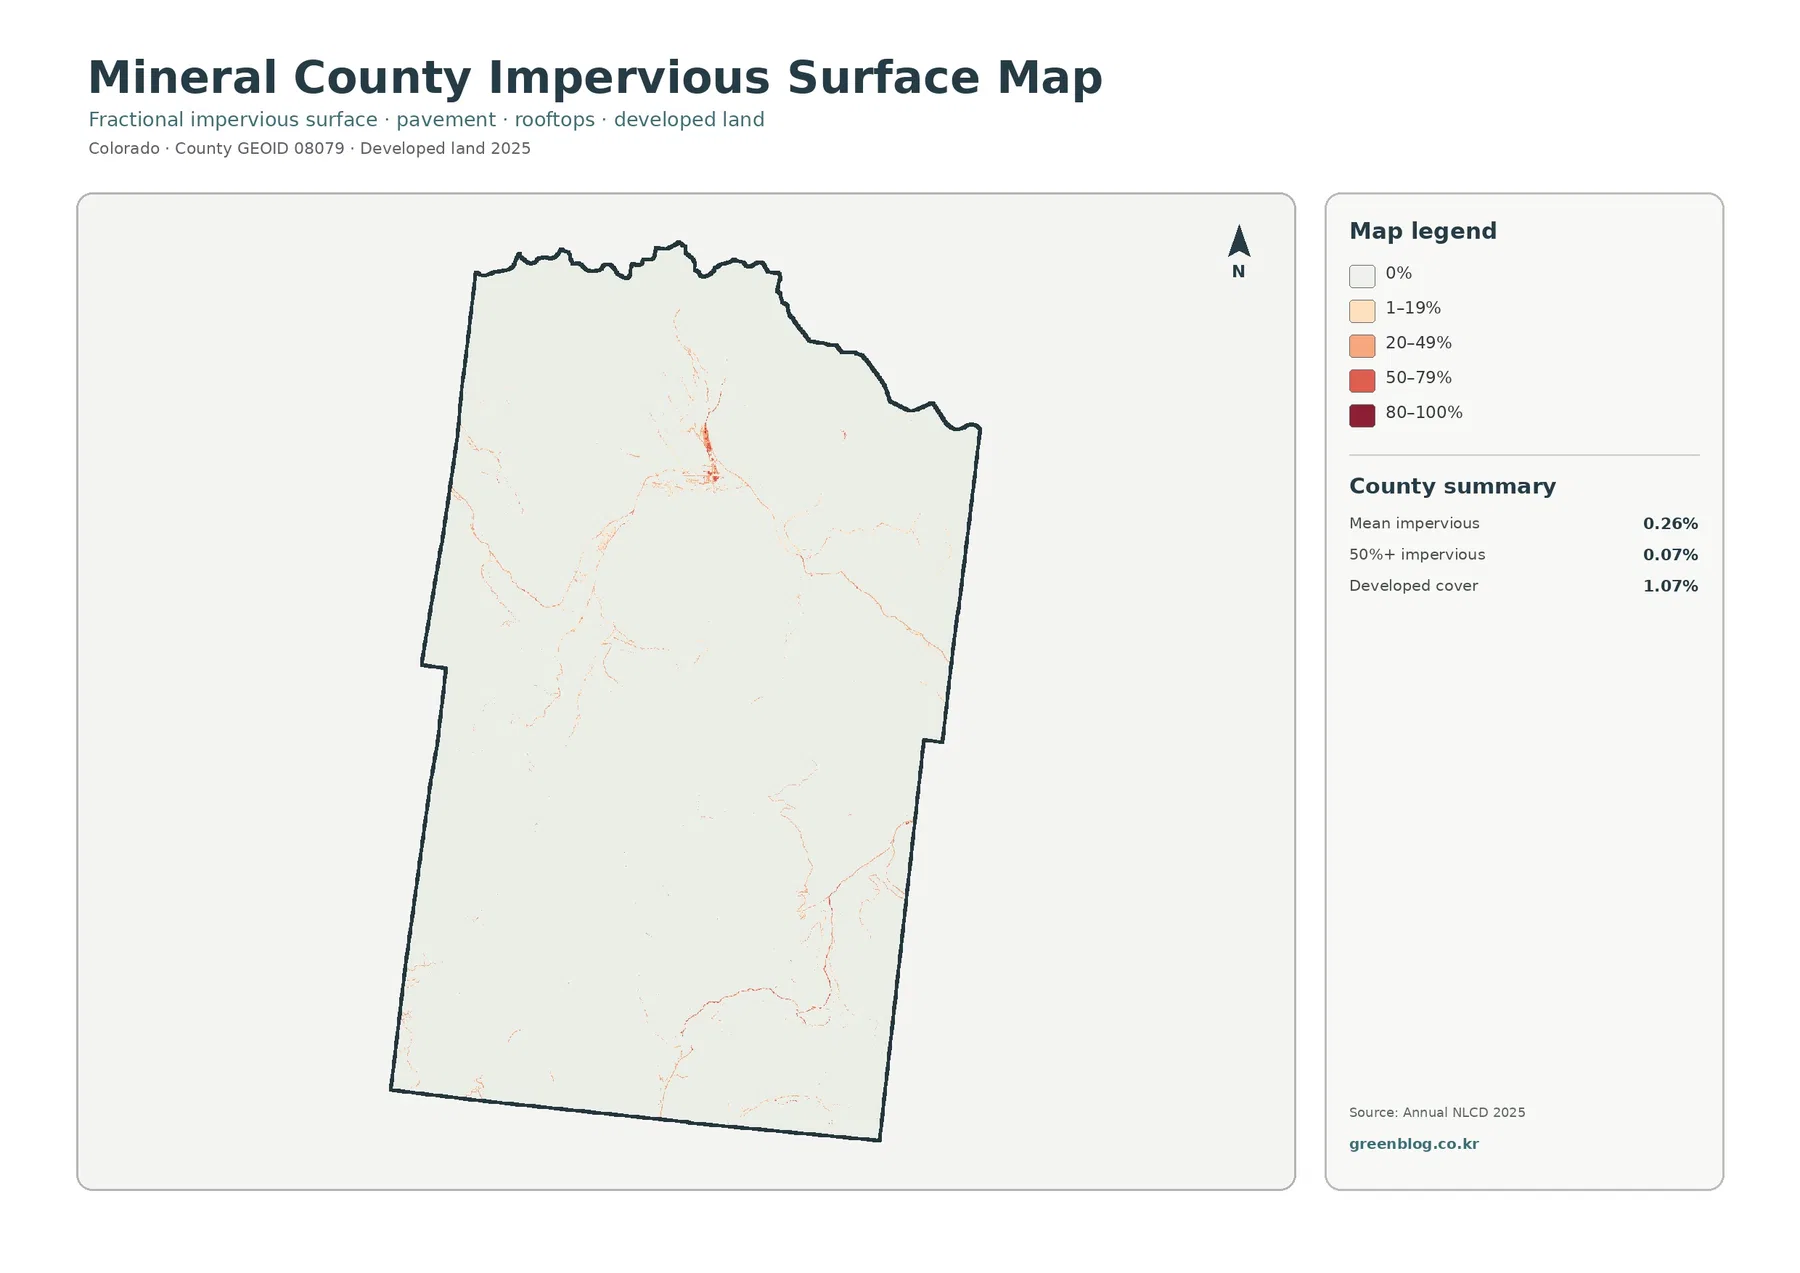
The Creede area stands out as the clearest orange-red cluster. Away from it, the map is almost entirely pale, with only faint linear traces and small spots in other parts of the county. That visual simplicity is useful when the question is specifically about paved and built surfaces. The general land-cover map contains more environmental information, but its many vegetation colors can make a small development footprint harder to isolate.
An impervious map should not be read as a street map. High values may represent a road, roof, parking area, or several hard surfaces within the same 30-meter cell. Narrow roads and small buildings can also be diluted by adjacent vegetation or rock. Use this layer to compare where hard surfaces are concentrated at county scale, then switch to detailed transportation or parcel information for site-level work.
Wetlands and headwater valleys add a second strong natural signal
Wetlands account for 5.10 percent of the county, a notable share in a landscape otherwise dominated by forest, shrubland, and grassland. On the current map, wetland color appears in long, irregular bands and small valley patches. Water occupies a much smaller area, yet its blue features provide useful reference points because they are often closely associated with those wet corridors.
Mineral County lies within the Rio Grande National Forest setting, and U.S. Forest Service material identifies Mineral County among the counties covered by the forest plan. The same plan describes the Rio Grande headwaters as originating in the forest. Creede is also officially described as a town at the headwaters of the Rio Grande. These sources provide geographic context for the repeated wet valley pattern visible on the map without turning a land-cover layer into a hydrology or flood-hazard map.
For watershed education, the current map and the forest-and-farmland map work well as a pair. The first preserves the full set of wetland, water, forest, shrub, grass, and developed classes. The second simplifies the vegetation categories enough to make valley relationships easier to follow. Small streams and narrow wet areas may still disappear within 30-meter cells, so the absence of a mapped wetland color is not evidence that a wet feature is absent on the ground.
The forest-and-farmland map makes the near absence of agriculture easy to see
The forest-and-farmland map uses a simpler legend to separate forest, cropland, pasture or hay, shrub and grass cover, wetlands, water, and developed or other land. In Mineral County the simplified view reinforces the same message as the full map: forest occupies 53.04 percent, while agriculture totals only 0.12 percent. There is no broad agricultural belt or large field pattern comparable with Colorado’s plains counties.
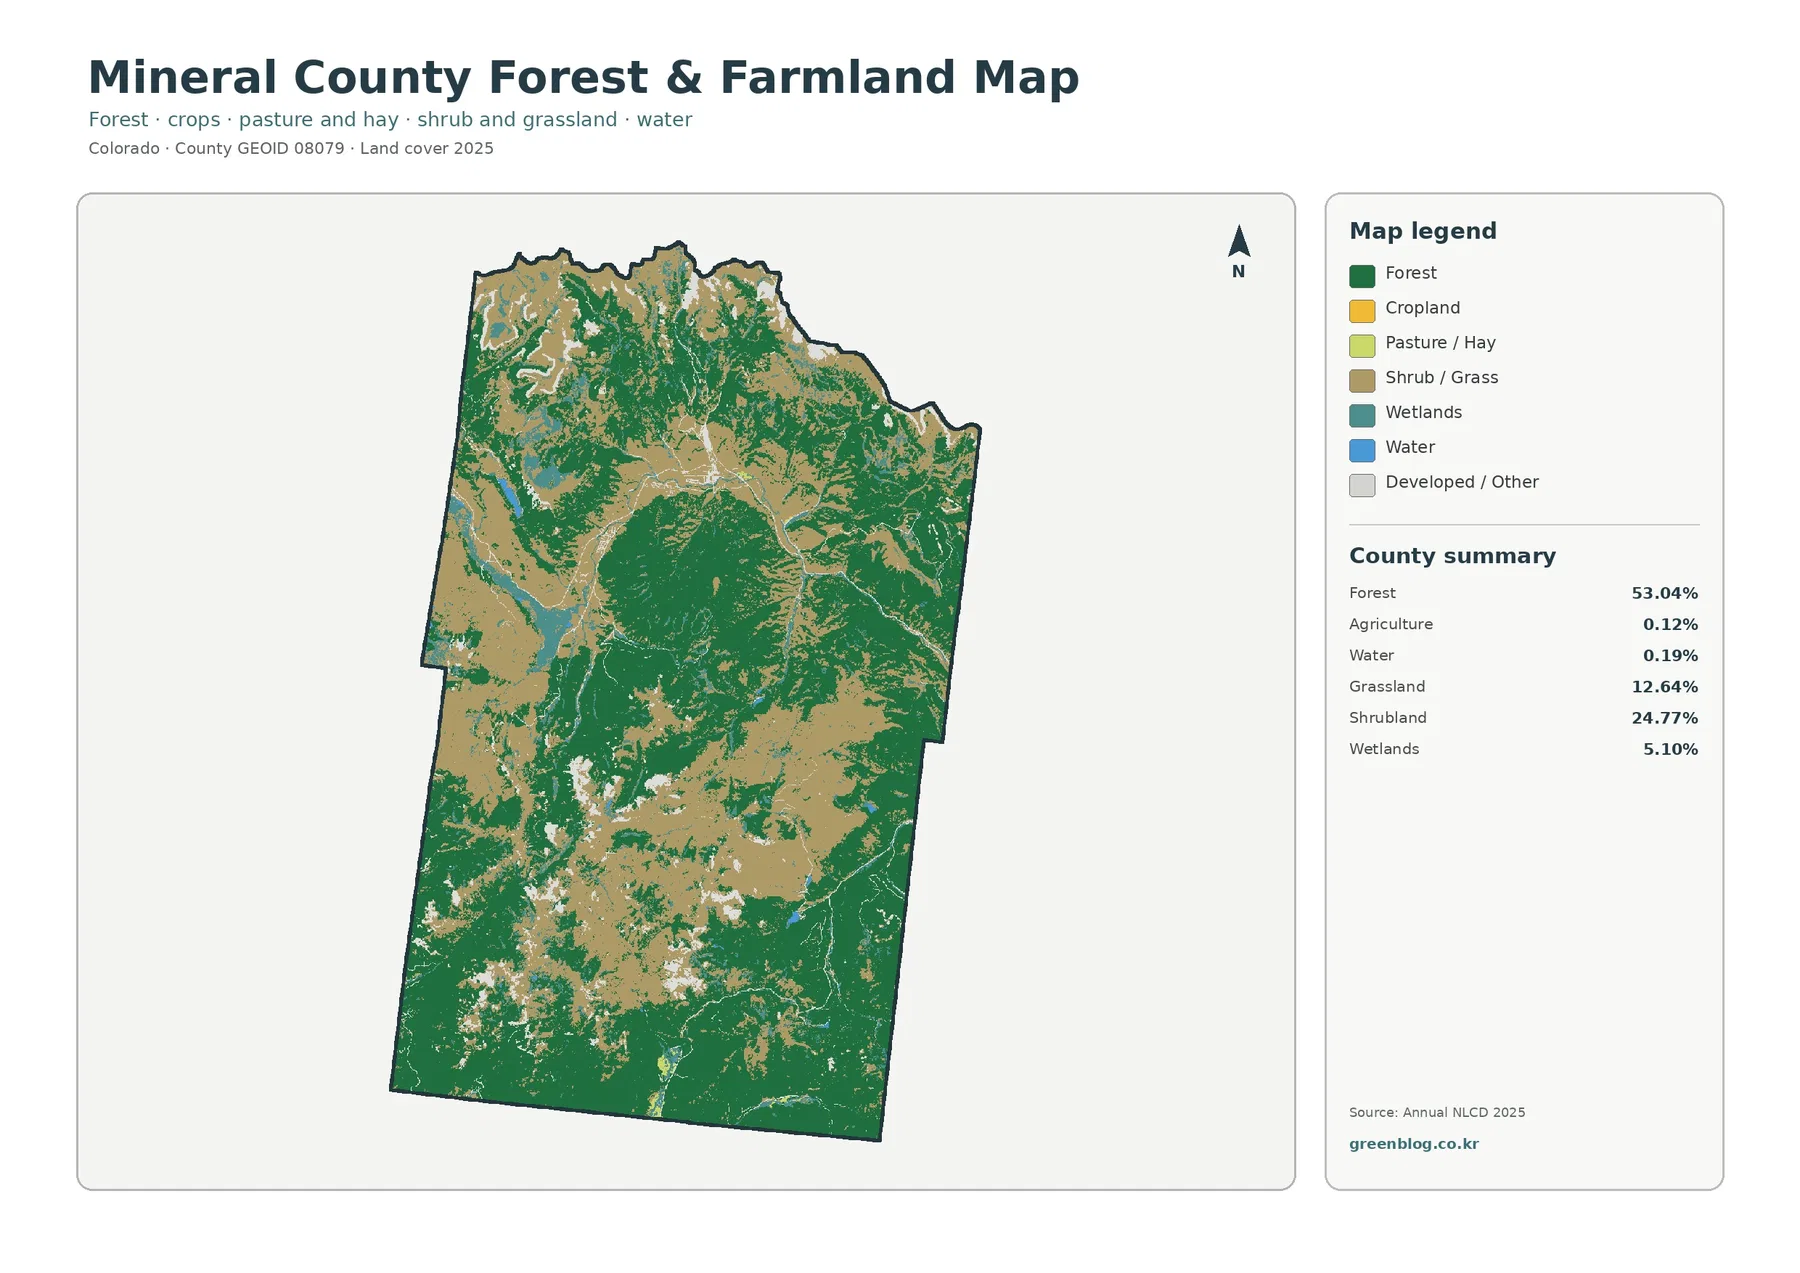
That small agricultural percentage should be treated as a land-cover classification, not a complete agricultural inventory. A ranch, grazing allotment, or privately owned parcel may contain surfaces mapped as grassland or shrubland rather than agriculture. The layer also does not report crop type, production, ownership, or legal land use. Those questions require agricultural statistics, property records, or local land-use information.
Forest is similarly generalized. Rio Grande National Forest documents describe several vegetation types across the surrounding mountain region, but the land-cover layer combines wooded surfaces into broad forest classes for countywide comparison. It is useful for showing where forest is extensive and where it gives way to open cover. It is not a substitute for stand-level forest inventory, species mapping, or timber-management records.
The 1985–2025 comparison flags broad forest-class differences, not a single cause
The change map compares the mapped class at each location in 1985 with the class in 2025. Mineral County has a total class-difference value of 17.36 percent. The largest named category is forest loss at 12.97 percent, followed by 4.00 percent in other class differences. Cells classified as changing to developed cover account for 0.17 percent, and agricultural loss accounts for 0.10 percent.
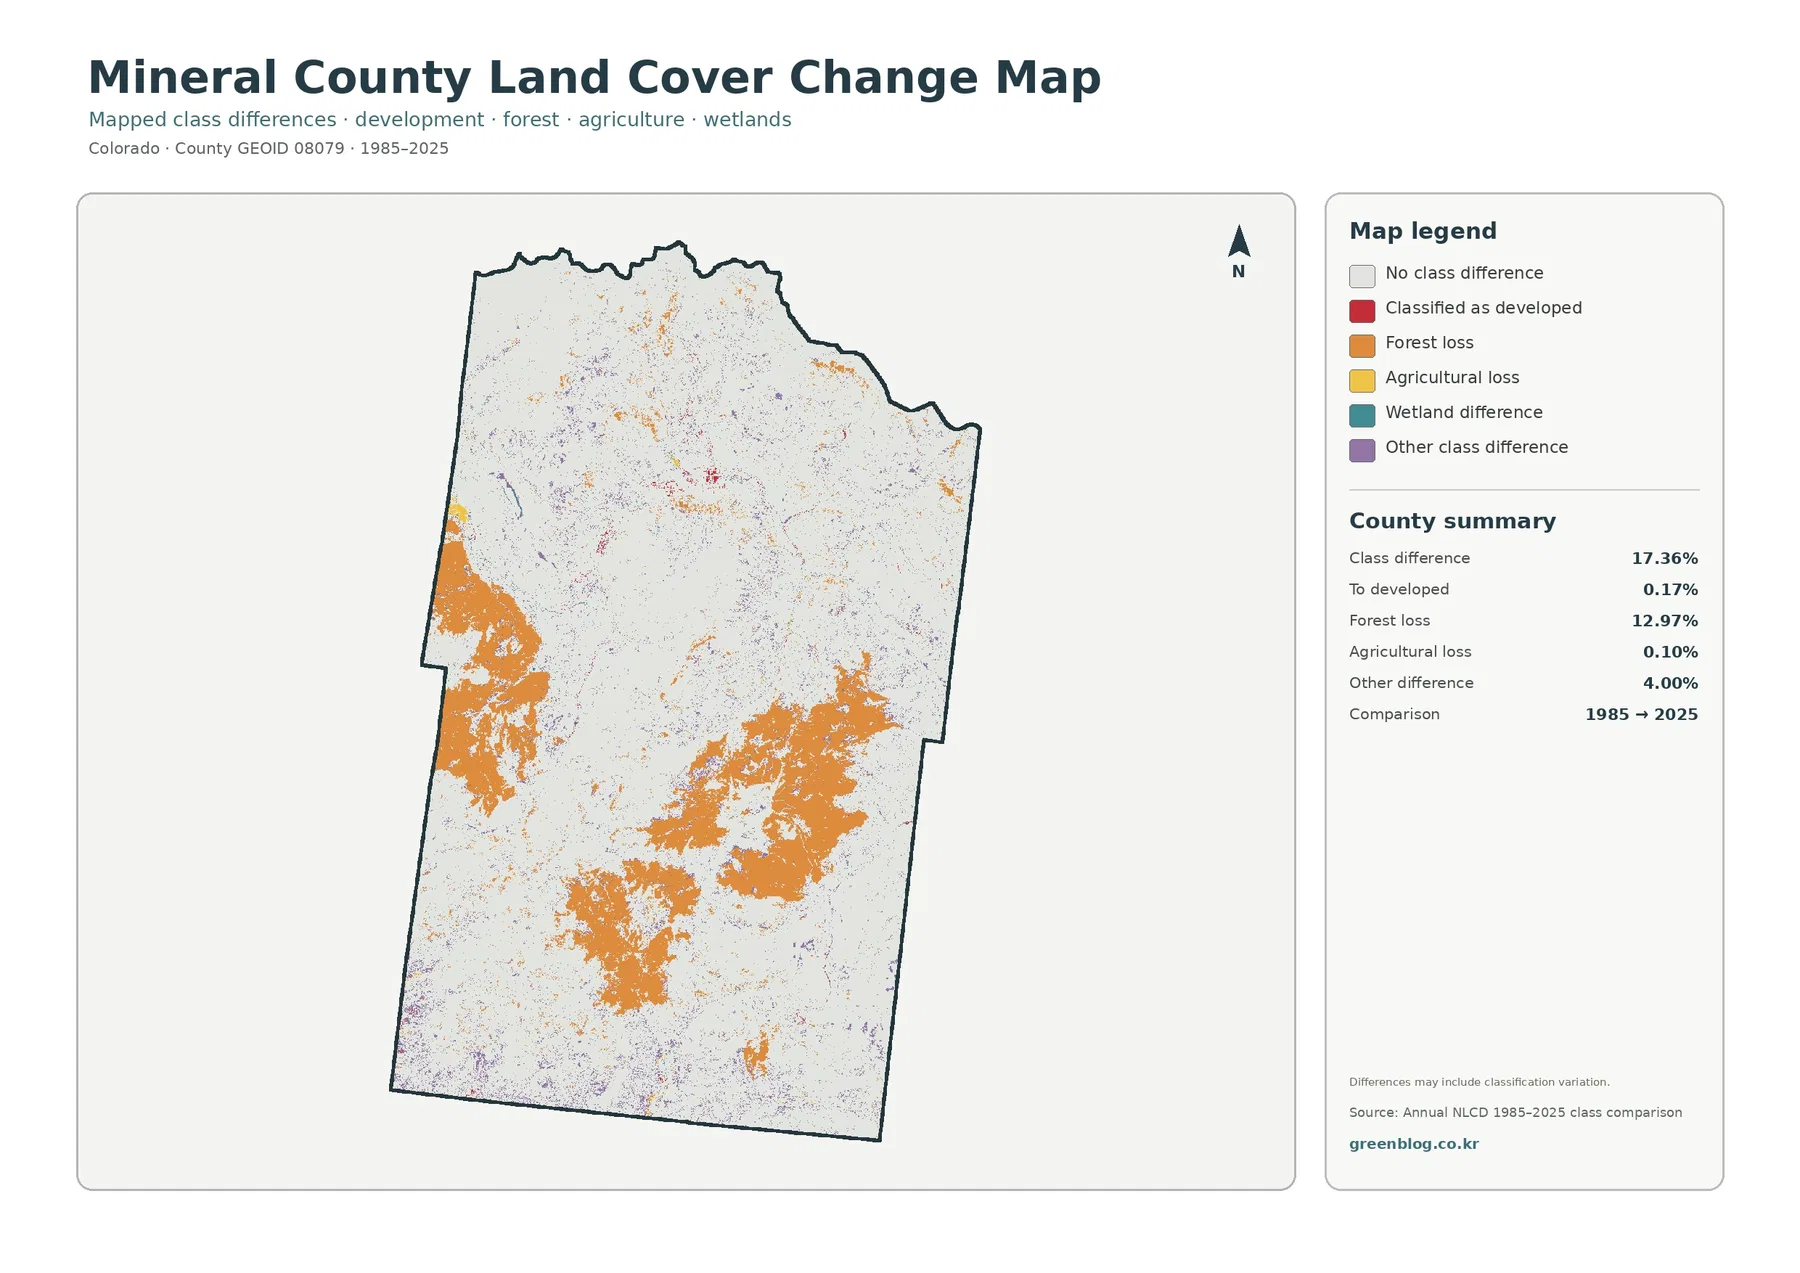
Orange forest-loss classifications appear in several sizeable mountain areas, especially in the western, central, and southern parts of the county. Smaller difference colors are scattered more broadly. The map is useful for locating where the two endpoint classifications disagree, but it does not identify the year or the reason for each difference. A single orange patch should not automatically be labeled as logging, wildfire, development, or permanent deforestation.
Real forest change may be part of the 12.97 percent signal, yet vegetation recovery, fire effects, changes in canopy density, image timing, mixed pixels, and classification methodology can also influence endpoint comparisons. To explain a specific location, check intermediate-year imagery together with fire, vegetation, or forest-management records. The current 2025 map should also be kept beside the change map so viewers can see what cover is present now.
Use each map for a different scale of question
For a county overview, start with the full 2025 land-cover map. It shows the dominant forest and open mountain vegetation while retaining wetlands, water, barren areas, and developed cover. If the topic is farming or vegetation, the forest-and-farmland layer provides a cleaner comparison and makes the tiny agricultural share easier to recognize. When development is the subject, the impervious layer removes most vegetation colors and highlights the Creede cluster.
The change map works best after the present-day pattern is understood. A difference cell has much more meaning when the viewer can compare it with the current forest, shrubland, grassland, wetland, or developed class in the same area. In a presentation, a useful sequence is current cover, impervious surface, forest-and-farmland, and then change. That progression moves from the broad landscape to the small human footprint, then back to vegetation before introducing the long-term comparison.
These maps can support environmental education, regional planning context, watershed discussion, habitat comparison, and presentation graphics. They are especially useful for side-by-side county comparisons because every layer uses the same county outline. They should remain a starting point rather than the final evidence for a property decision, ecological field assessment, or detailed engineering question.
Land cover is not zoning, ownership, or permission to build
Land cover describes the physical surface visible in imagery: forest, shrubland, grassland, wetlands, water, developed cover, and related classes. Zoning is a legal planning system, property ownership identifies who holds rights to land, and building permission depends on regulations, access, utilities, hazards, and other requirements. A forest cell does not identify a national-forest boundary, and a developed cell does not grant any right to expand development.
Mineral County maintains separate Land Use Administration and Planning & Zoning processes. The county administrator’s office handles permits and land-use administration, including building, septic, and road-access applications. Those records and regulations are the proper sources when a question concerns a parcel or a legal use. The maps on this page are intended for physical surface comparison at county scale.
The ownership distinction is particularly important here because public lands are a major part of the county’s geographic context. A forested area may be public or private, and an open shrub or grass area may also fall under different ownership. Land-cover color alone cannot answer that question. Use a dedicated ownership or cadastral map when property status matters.
Thirty-meter cells and map dates set clear limits on detail
Annual NLCD is a Landsat-based raster product with 30-meter spatial resolution. A raster divides the land into grid cells and assigns a representative class or value to each one. In mountainous terrain, a single cell may contain trees, rock, a narrow stream, a road, and open vegetation. The final class simplifies that mixture, which is why mapped edges may not match a stream bank, road edge, fence, or parcel line exactly.
The 2025 land-cover map is also a snapshot tied to that mapping year. Fire, construction, vegetation recovery, flooding, or road work after the observation period will not appear. The 1985–2025 comparison uses two endpoints, so it cannot tell the viewer when a class difference first occurred or whether it persisted continuously between those dates.
Within those limits, the maps are strong for regional pattern recognition. They quantify the forest-dominated county, show wetland corridors, isolate the small impervious footprint, and identify areas where endpoint classifications differ. They are much weaker for surveying a boundary, locating a small wetland, or measuring a narrow road. Matching the map to the scale of the question prevents overinterpretation.
Download all four original JPG maps for reference and presentation use
The ZIP download contains the four original JPG maps for Mineral County, Colorado: the 2025 land-cover map, forest and farmland map, impervious/developed-land map, and the 1985–2025 land-cover class comparison. Because the maps share the same county extent, they can be placed side by side in reports, classroom materials, planning context documents, or presentation slides without realigning different frames.
Each JPG listed in the supplied asset manifest is 2480×1754 pixels. The package marks that resolution as not meeting its A3 high-resolution reference. For a large poster, check sharpness at the intended print size before production. For screens, ordinary documents, moderate-size prints, and comparative layouts, the original JPGs are more practical than the smaller WebP previews embedded in the article.
Frequently Asked Questions
What is the dominant land cover in Mineral County, Colorado?
Forest is the largest 2025 class at 53.04 percent. Shrubland follows at 24.77 percent, grassland at 12.64 percent, and wetlands at 5.10 percent. Agriculture is only 0.12 percent and developed cover is 1.07 percent, so natural vegetation overwhelmingly defines the countywide pattern.
Which map is best for seeing the developed footprint around Creede?
The impervious-surface map is the clearest choice. Mean impervious cover is only 0.26 percent countywide, but the Creede area forms the strongest cluster of hard surfaces. The general land-cover map can then be used to compare that cluster with the surrounding forest, shrubland, grassland, wetlands, and water.
Does 12.97 percent forest loss mean that Mineral County permanently lost exactly that much forest?
No. The 12.97 percent value is the share of the county placed in the forest-loss category in the 1985–2025 endpoint comparison. Actual forest change may contribute, but fire, recovery, canopy condition, imagery timing, mixed pixels, and classification differences can also affect the result. Intermediate imagery and forest or fire records are needed to measure and explain real change.
Map File Information
This ZIP contains all four original JPG maps for Mineral County, Colorado: current land cover, forest and farmland, impervious/developed land, and the 1985–2025 mapped class comparison.
- Included Files: Use only the versions confirmed in the article and supplied images
- File Type: Use the confirmed download contents
- Intended Use: Printing, education, presentations, and map-based projects
Related Maps
- Adams County Colorado Land Cover Map
- Alamosa County Colorado Land Cover Map
- Arapahoe County Colorado Land Cover Map
Sources and References
These official and public sources provide the land-cover definitions, county boundary data, Rio Grande National Forest context, Creede location information, and Mineral County land-use administration background used in this article.
- MRLC Annual NLCD Data – annual land-cover and related datasets
- USGS Annual NLCD Land Cover Classification – class definitions and dataset documentation
- U.S. Census Bureau TIGER/Line Shapefiles – county boundary data
- Rio Grande National Forest Land and Resource Management Plan – forest, vegetation, and headwater context including Mineral County
- Mineral County County Administrator – local land-use administration and Planning & Zoning information
- City of Creede – official information on the county seat and Rio Grande headwaters setting
Green Map creates custom-edited map images using open geographic data sources such as geoBoundaries, Natural Earth, OpenStreetMap, and government open data.
These maps are edited visual materials, not raw data files, and are provided for education, documents, presentations, and graphic reference.