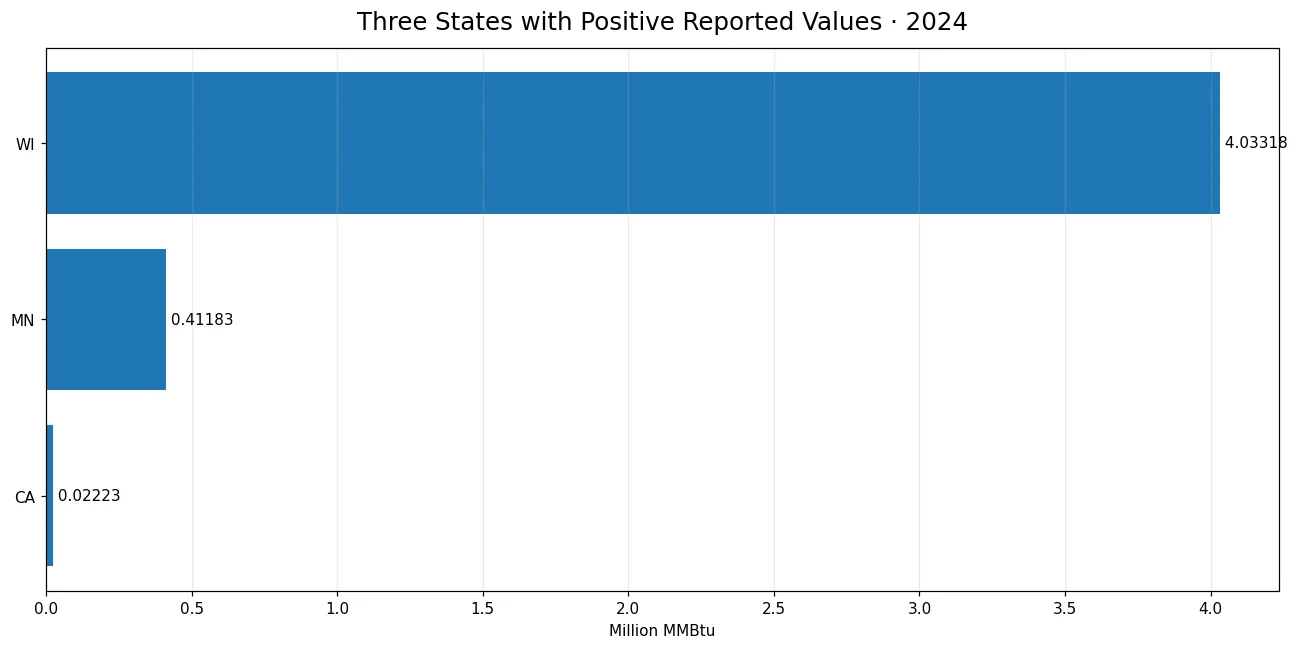
Only three U.S. state jurisdictions reported a positive 2024 value for renewable energy consumed for useful thermal output within EIA sector 90, Electric Power Sector Non-CHP. Wisconsin reported 4.03318 million MMBtu, Minnesota 0.41183, and California 0.02223. The other 48 jurisdictions in the 51-row series reported exactly zero, and none of the observations is missing. That makes this a sparse energy series rather than a broad state-by-state pattern of nonzero consumption.
The measure is narrowly defined. Fueltypeid REN identifies the renewable fuel grouping, sectorid 90 limits the population to non-CHP electric power, and consumption-uto-btu measures fuel energy used for useful thermal output. It is not renewable electricity generation, not all renewable energy consumption, and not total fuel input for the entire electric-power system. The unit is million MMBtu, so the figures describe energy input rather than megawatt-hours of electricity output.
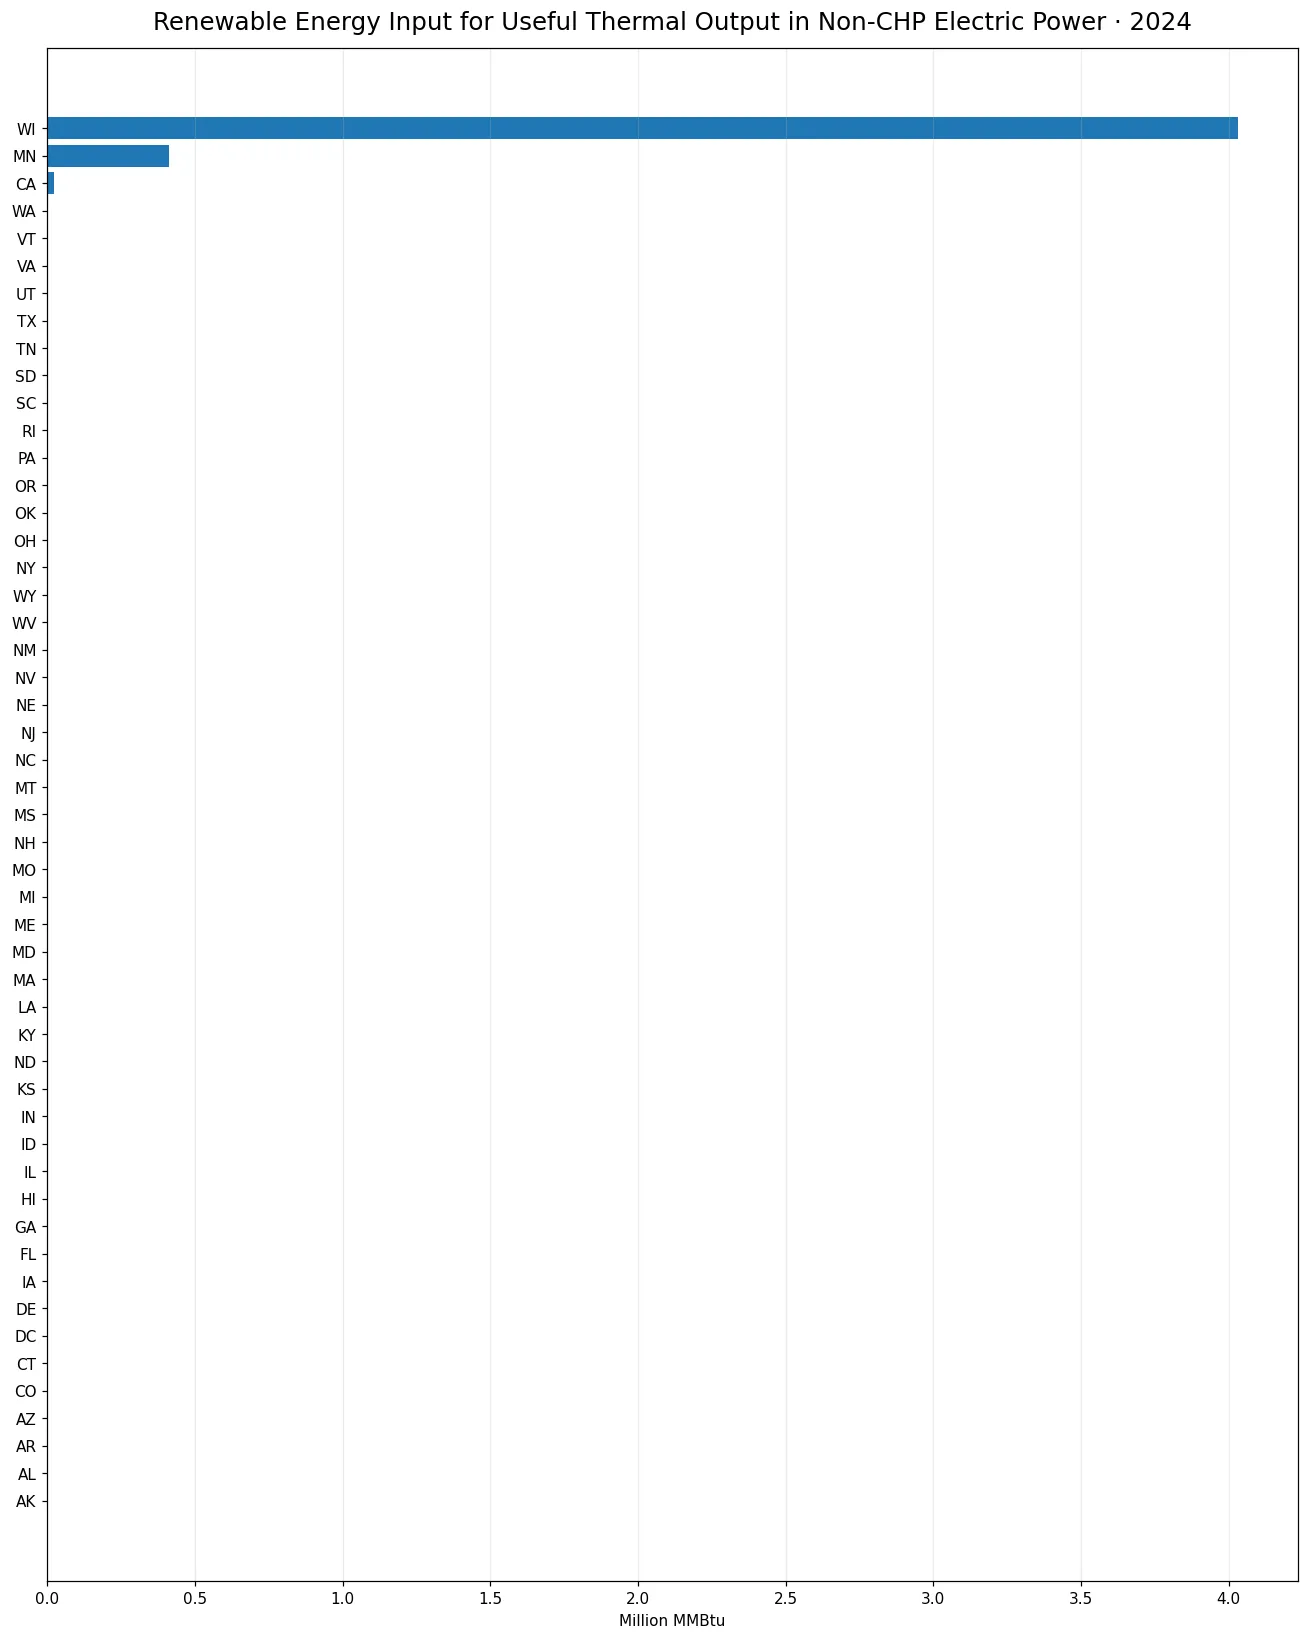
Table of Contents
Wisconsin represented 90.3% of the positive-value total
The three positive observations sum to 4.46724 million MMBtu. Within that exact 51-jurisdiction series, Wisconsin accounts for 90.28%, Minnesota for 9.22%, and California for 0.50%. Wisconsin exceeds Minnesota by 3.62135 million MMBtu and is about 9.8 times as large. Minnesota, in turn, is roughly 18.5 times the California value. These shares describe concentration inside this narrowly defined EIA measure; they are not shares of all U.S. renewable energy use.
The arithmetic mean across all 51 jurisdictions is 0.08759 million MMBtu, but the median is zero and both the first and third quartiles are also zero. That contrast is important. A reader who sees only the mean could imagine small positive values spread across many states, while the actual data show the opposite: almost every jurisdiction is at zero and a very small group contains all reported positive energy input. For this series, the number of positive observations is more informative than a national-looking average.
| State | Code | Energy input (million MMBtu) | Share of positive-value total |
|---|---|---|---|
| Wisconsin | WI | 4.03318 | 90.28% |
| Minnesota | MN | 0.41183 | 9.22% |
| California | CA | 0.02223 | 0.50% |
The 48 zeros are reported observations, not missing data
Every row contains a numeric value. Forty-eight jurisdictions are reported as exactly zero, while three are positive. That distinction must be preserved. Treating the zeros as blanks would erase information that EIA reported, and replacing missing observations with zeros in a different series would invent information. Here there is no missing-value problem: the statistical feature is the unusually large number of reported zeros.
A reported zero should still be interpreted within the series definition. It does not mean that a state has no renewable generation, no renewable facilities, or no renewable energy use elsewhere in its economy. It means that this exact combination of REN, sector 90, useful-thermal-output fuel input, Btu-based measurement, and 2024 has a reported value of zero. A different sector or field can show positive renewable activity for the same state.
Useful-thermal fuel input is different from fuel used to generate electricity
EIA separates consumption-for-eg-btu from consumption-uto-btu. The first describes fuel energy used for electricity generation; the second describes fuel energy used to produce useful thermal output. A total-consumption-btu field can combine relevant components. The present comparison isolates the useful-thermal component, so rankings from a generation-fuel series should not be copied into this one even when the renewable fuel grouping and year match.
Generation is a different concept again. A generation field reports electrical output in megawatt-hours, whereas consumption-uto-btu reports fuel energy input in million MMBtu. Input and output can be related, but they are not interchangeable. Technology, operational configuration, losses, and the role of thermal output all affect how the measures relate. The safest way to compare state energy data is to keep the field and unit attached to every number.
Sector 90 narrows the population to non-CHP electric power
Sectorid 90 is Electric Power Sector Non-CHP. CHP systems jointly produce electricity and useful thermal output, so excluding CHP materially changes the population being measured. The presence of only three positive state values should therefore be read in the context of a non-CHP sector paired with a useful-thermal-output field. It would be inappropriate to generalize the sparse pattern to CHP systems or to the entire U.S. electric-power sector.
Changing sectorid can alter the included facilities, ownership groups, technologies, and operating activities. Sector 98 Electric Power, sector 99 All Sectors, or producer-specific sectors can each produce a different state distribution even with REN and the same year. Apparent inconsistencies across articles often disappear once sector definitions are aligned. The statistical identity of the series is the combination of fuel, sector, field, year, and unit rather than the broad topic label alone.
Wisconsin is an extreme outlier inside an already sparse series
Wisconsin at 4.03318 million MMBtu is about 9.8 times Minnesota and about 181.4 times California. This creates two layers of concentration: first, only three jurisdictions are positive; second, one of those three dominates the positive total. On a chart of all 51 jurisdictions, Wisconsin visually overwhelms the smaller positive bars. A separate three-state chart is therefore more informative than a conventional top-ten ranking, because positions four through ten would all be tied at zero.
The choice of visualization matters when zeros dominate. A top-ten list can imply that ten jurisdictions have meaningfully different high values even when seven of those entries would be zero. Showing the full distribution establishes the prevalence of zeros, while the positive-only comparison reveals the scale difference among Wisconsin, Minnesota, and California. Together the two views communicate both sparsity and concentration without manufacturing distinctions among identical zero observations.
The 4.46724 million MMBtu sum has a narrow statistical meaning
Adding all 51 observations gives 4.46724 million MMBtu. That total belongs only to the REN, sector 90, consumption-uto-btu, 2024 cross-section. It should not be renamed as total U.S. renewable consumption, total renewable thermal energy, or total electric-power renewable input. Those broader concepts require different sector coverage or different EIA fields. The sum is useful here as a denominator for describing the state concentration within this specific series.
A concentrated sum does not explain causation. Wisconsin’s dominant value could motivate a deeper investigation into facilities, fuel types, operational practices, or reporting composition, but this state-level aggregate does not identify which mechanism is responsible. Inferring policy success, cost advantages, technology efficiency, or industrial demand from the ranking alone would go beyond the evidence. The cross-section supports statements about magnitude and location, not about why the values differ.
Year-to-year comparisons require the same facets and field
The 2024 pattern should not be assumed to hold in every year. A valid time comparison would keep fueltypeid REN, sectorid 90, consumption-uto-btu, annual frequency, and the million-MMBtu unit fixed. If a later comparison switches to generation, total consumption, CHP, or a broader sector, the apparent change could come from the definition rather than from real operations. Exact identity matching is especially important for sparse series because a single newly positive state can noticeably change the distribution.
Percentage growth rates also require care when a prior value is zero. Moving from zero to a positive observation does not have a conventional finite percent increase, and reporting an enormous percentage can obscure the underlying small absolute change. For sparse energy measures, absolute differences, the count of positive jurisdictions, and the appearance or disappearance of positive observations are often better descriptors than percentage growth alone.
Related EIA fields answer different questions about renewable energy
To study renewable electricity output, a generation field is the appropriate measure. To examine fuel energy used to generate electricity, consumption-for-eg-btu is more direct. To combine electricity-generation and useful-thermal fuel inputs within the applicable scope, total-consumption-btu is the relevant field. The present consumption-uto-btu measure answers a narrower question: how much renewable fuel energy was reported for useful thermal output in sector 90.
Physical-unit consumption fields should also be separated from Btu-based fields. Btu measures convert fuel quantities into an energy basis, while physical units preserve the source quantity conventions. For an aggregate renewable category that may cover multiple underlying fuel types, that distinction can materially affect interpretation. This article remains on the Btu-based measure and keeps every reported value in million MMBtu.
Five identifiers keep the state comparison unambiguous
A correct reading depends on five identifiers: REN for fuel, sector 90 for Electric Power Sector Non-CHP, consumption-uto-btu for the field, 2024 for the year, and million MMBtu for the unit. If any one changes, the resulting state ranking may legitimately change as well. Similar wording in an article title is not enough to establish that two observations refer to the same energy statistic.
With those identifiers fixed, the result is unusually clear. Wisconsin reports 4.03318 million MMBtu, Minnesota 0.41183, California 0.02223, and the remaining 48 jurisdictions report zero. Wisconsin holds 90.28% of the positive-value total, while the median for all 51 observations is zero. The defining feature of this 2024 series is therefore not a gradual geographic gradient but a sharply localized set of positive values inside a highly sparse distribution.
Frequently Asked Questions
Which state reported the most renewable energy input for useful thermal output in 2024?
Wisconsin led with 4.03318 million MMBtu and represented 90.28% of the positive-value total.
Are the 48 zero values missing observations?
No. All 51 jurisdictions have numeric observations; 48 are reported as exactly zero and none is missing.
Does this measure renewable electricity generation?
No. consumption-uto-btu measures fuel energy used for useful thermal output in million MMBtu, not electrical output in MWh.
What does EIA sector 90 mean?
Sector 90 is Electric Power Sector Non-CHP. It excludes CHP and should not be interpreted as all renewable energy use in the economy.
Related Articles
Green Map creates custom-edited map images using open geographic data sources such as geoBoundaries, Natural Earth, OpenStreetMap, and government open data. These maps are edited visual materials, not raw data files, and are provided for education, documents, presentations, and graphic reference.