The 2024 all-sector average heat content of petroleum liquids in the U.S. electric-power operational dataset ranged from 5.1413 to 6.3000 million Btu per barrel across 50 states and the District of Columbia. D.C. had the highest published value, followed by Maine, New Hampshire, Rhode Island, Hawaii and Delaware. Alaska was the low-end outlier. These observations come from the U.S. Energy Information Administration (EIA) annual heat-content field for Petroleum Liquids with sector 99, which represents All Sectors.
Average heat content is a fuel-property measure, not a measure of how many barrels were consumed, how much electricity was produced, or how efficiently power plants operated. The number answers a narrower question: how much energy, on average, was represented by one barrel of the petroleum liquids consumed in the specified state-and-sector aggregation during 2024? Keeping that denominator clear prevents a small difference in fuel composition from being mistaken for a large difference in power-system performance.
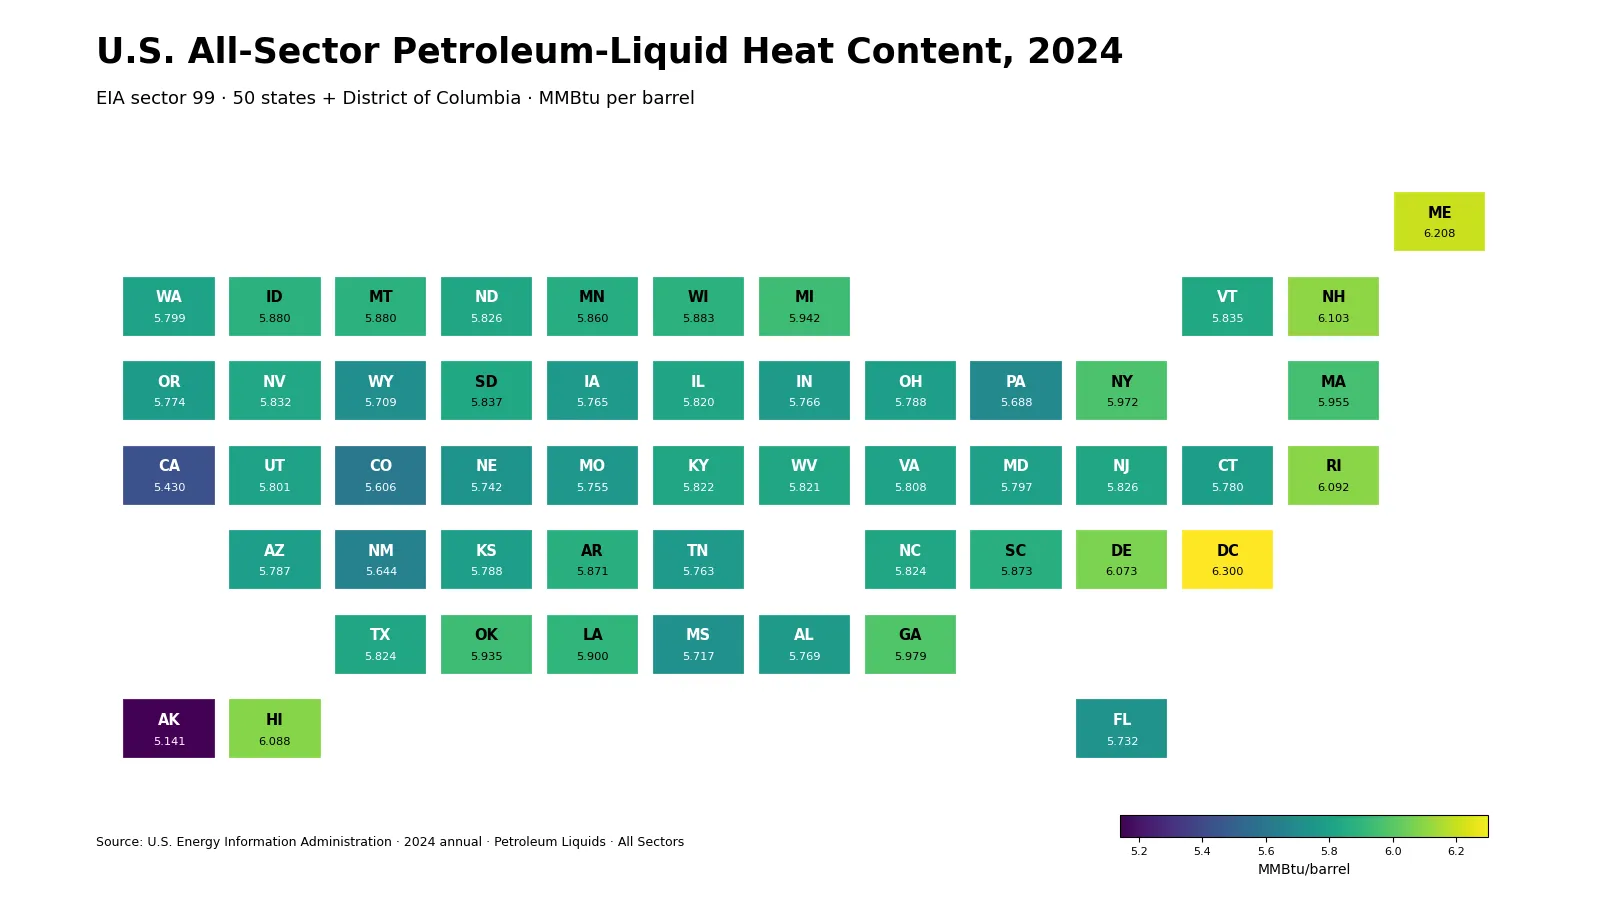
Table of Contents
Why this all-sector series is not the same as the existing electric-power-sector article
A closely related 2024 article already published on the site uses sectorid=98, the Electric Power sector. This candidate uses sectorid=99, All Sectors. EIA exposes those sector facets separately, so the two series answer different statistical questions even though the year, fuel family and heat-content field are similar.
The coverage also differs. The current all-sector file contains 51 jurisdictions: all 50 states plus the District of Columbia. D.C. is present at 6.3000 MMBtu per barrel. The previously published electric-power-sector slice contains 50 state observations and excludes D.C. Several state values also change between the two sector definitions. The sector facet therefore belongs in the public title and interpretation rather than being treated as an internal technical detail.
D.C. was highest at 6.3000 MMBtu per barrel
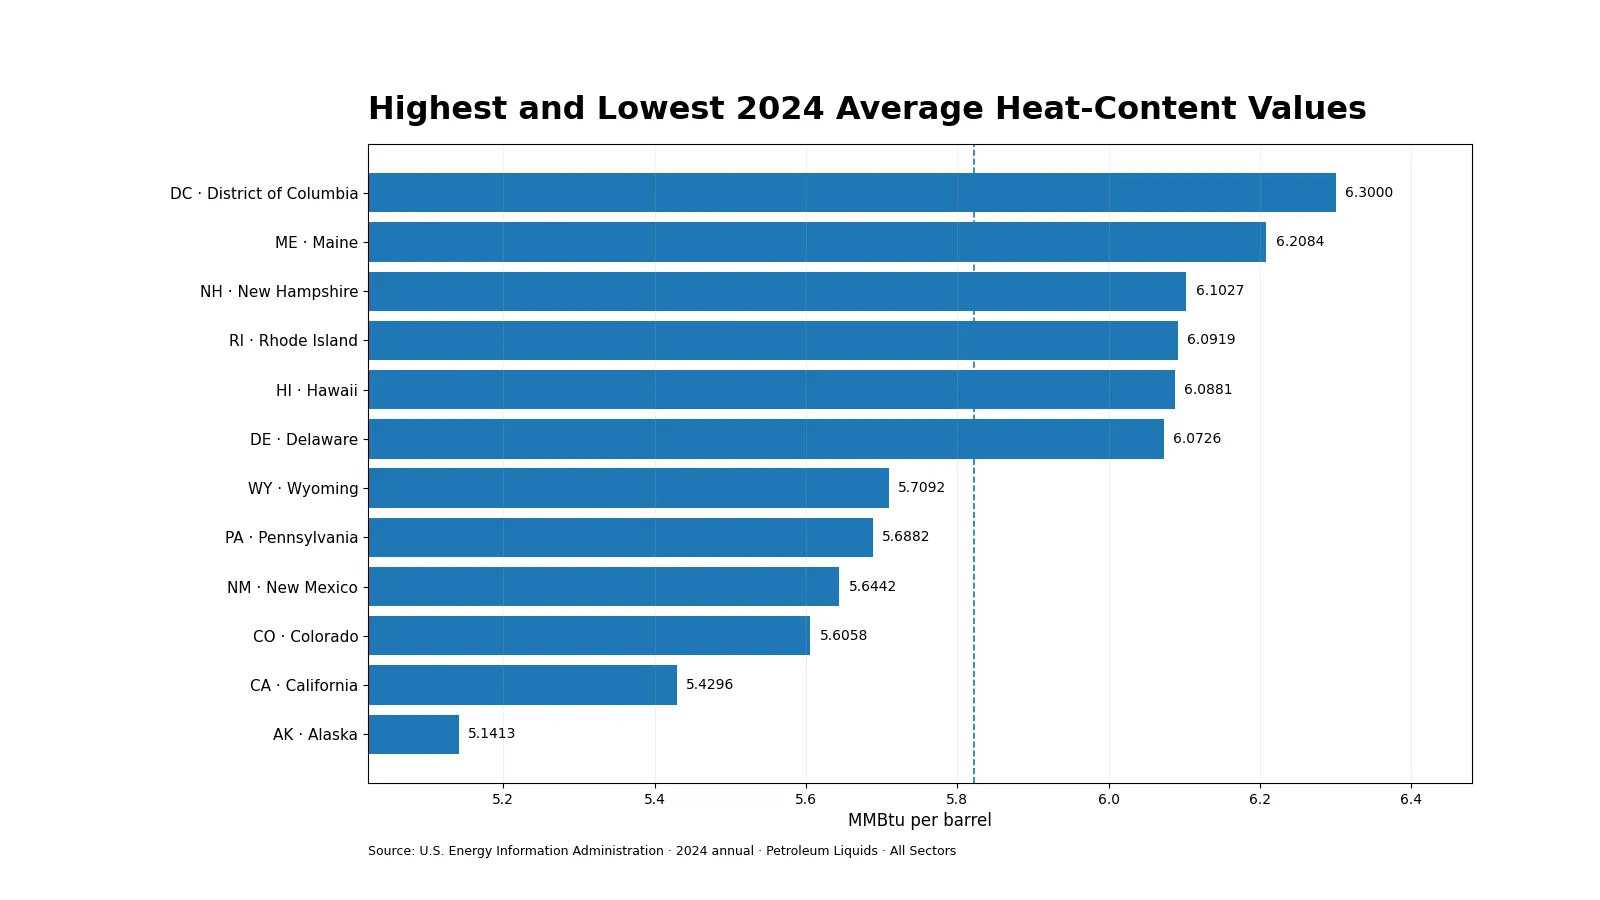
At the top of the 2024 all-sector distribution, the District of Columbia recorded 6.3000 MMBtu per barrel. Maine followed at 6.2084, New Hampshire at 6.1027, Rhode Island at 6.0919, Hawaii at 6.0881 and Delaware at 6.0726. Those six jurisdictions were the only observations at or above 6.0. Georgia, at 5.9789, sat just below that threshold.
| State or jurisdiction | Average heat content (MMBtu/barrel) |
|---|---|
| District of Columbia | 6.3000 |
| Maine | 6.2084 |
| New Hampshire | 6.1027 |
| Rhode Island | 6.0919 |
| Hawaii | 6.0881 |
| Delaware | 6.0726 |
| Georgia | 5.9789 |
| New York | 5.9716 |
| Massachusetts | 5.9554 |
| Michigan | 5.9418 |
The ranking should not be read as a ranking of fuel quality or plant efficiency. Petroleum Liquids is an aggregate category, and the average can shift with the mix of liquid fuels consumed and with which facilities and producer sectors are active. A higher value means more energy per physical barrel on average within this aggregation; it does not show how many barrels were burned.
Alaska widened the low end of the distribution
Alaska had the lowest 2024 all-sector value at 5.1413 MMBtu per barrel. California was second-lowest at 5.4296, followed by Colorado at 5.6058, New Mexico at 5.6442 and Pennsylvania at 5.6882. The full high-to-low range was 1.1587 MMBtu per barrel. Measured against Alaska, the D.C. value was about 22.5% higher, but that percentage is only a comparison of average energy content per barrel.
| State or jurisdiction | Average heat content (MMBtu/barrel) |
|---|---|
| Alaska | 5.1413 |
| California | 5.4296 |
| Colorado | 5.6058 |
| New Mexico | 5.6442 |
| Pennsylvania | 5.6882 |
| Wyoming | 5.7092 |
| Mississippi | 5.7167 |
| Florida | 5.7322 |
| Nebraska | 5.7423 |
| Missouri | 5.7555 |
Most jurisdictions clustered close to the middle
The unweighted mean across the 51 observations was 5.8316 MMBtu per barrel and the median was 5.8218. The first quartile was 5.7675 and the third quartile 5.8814, so the middle half occupied a band only about 0.1139 MMBtu wide. 35 of the 51 jurisdictions fell between 5.70 and 5.90 MMBtu per barrel.
The sample standard deviation was about 0.1762 and the coefficient of variation was about 3.0%. That tight distribution is important when reading the tile map: a continuous color scale stretches the observed minimum and maximum across the full palette, so visually distinct colors can represent numerically modest differences for most states.
What “All Sectors” means in this EIA route
In the EIA electric-power operational route, sector 99 is the All Sectors aggregation. It is broader than sector 98, which represents the Electric Power sector. The all-sector view combines the producing-sector categories represented in the operational dataset rather than limiting the calculation to the electric-power-sector subtotal.
This distinction can change both the set of returned jurisdictions and the calculated average. If commercial or industrial combined-heat-and-power activity, independent producers, or other represented producer categories use a different mix of petroleum liquids, the sector-99 average can differ from the sector-98 value. The state-level file alone does not identify how much each sub-sector contributed, so it would be inappropriate to assign a causal explanation to an individual state without more detailed EIA-923 records.
Heat content is not consumption, generation or efficiency
The unit MMBtu per barrel is a conversion-oriented measure. If a quantity of petroleum liquids is known in barrels, a compatible average heat-content factor can help translate that physical volume into an energy quantity. For example, 1,000 barrels at 5.8 MMBtu per barrel corresponds to roughly 5,800 MMBtu before considering any additional aggregation or reporting details.
That relationship works only in the direction the units support. A state with a higher heat-content factor can still have a much smaller total energy input if it consumes far fewer barrels. Likewise, a high heat-content value says nothing by itself about electricity output. Conversion efficiency requires an output-to-input relationship such as heat rate, and petroleum dependence requires a denominator such as total generation or total fuel input.
Petroleum Liquids is a mixed fuel category
EIA technical material describes Petroleum Liquids as including products such as distillate fuel oil, residual fuel oil, jet fuel, kerosene, propane and waste oil. Those products do not all have identical energy content per barrel. A state-level average therefore reflects the particular mixture represented in the reported consumption, rather than a universal constant attached to every barrel of petroleum liquid.
The 2024 state averages cannot, on their own, identify which product drove a high or low observation. A causal explanation would require a finer breakdown by fuel code, facility and consumption quantity. The safe conclusion from this dataset is descriptive: the average heat content of the petroleum liquids represented in the all-sector state totals differed across jurisdictions, with most observations concentrated near the middle and a small number farther away.
The 2024 values are a snapshot, not a permanent state characteristic
All 51 observations refer to the same annual period, which makes the cross-state comparison internally consistent. It does not make the ranking permanent. Changes in fuel mix, facility operation or the balance among producer sectors can move the annual average from one year to the next. A trend analysis should keep the fuel, sector, field and geography definitions fixed while retrieving multiple years.
The D.C. observation also illustrates why scale and heat content must be separated. A jurisdiction can post a high MMBtu-per-barrel average while accounting for little physical petroleum consumption. This dataset contains the conversion factor, not the volume weight needed to judge national importance. Pairing it with a compatible consumption series would answer a different and broader question.
Source, coverage and calculations
The primary source is the U.S. Energy Information Administration Electric Power Operational Data API. The verified selection is annual 2024, fueltypeid=PEL (Petroleum Liquids), sectorid=99 (All Sectors), and the heat-content field. The file contains all 50 states and the District of Columbia, with no missing numeric observations. No missing value was converted to zero and no other year was substituted.
The mean, median, quartiles, standard deviation, rankings and state counts were calculated from the 51 published values. EIA Electric Power Monthly material reports petroleum-liquid heat content in million Btu per barrel and notes that its average heat-content tables use weighted values. A raw value such as 5.8 should therefore be read as about 5.8 million Btu per barrel, not 5.8 Btu.
Official references: U.S. Energy Information Administration Electricity Data · Form EIA-923 detailed data.
Frequently Asked Questions
Which jurisdiction had the highest all-sector petroleum-liquid heat content in 2024?
The District of Columbia was highest at 6.3000 MMBtu per barrel, followed by Maine at 6.2084 and New Hampshire at 6.1027.
Which state had the lowest value?
Alaska was lowest at 5.1413 MMBtu per barrel. California was second-lowest at 5.4296.
Is this the same series as the 2024 Electric Power sector heat-content article?
No. This dataset uses sectorid=99, All Sectors. The related Electric Power sector article uses sectorid=98, so coverage and several state values differ.
Does higher heat content mean higher power-plant efficiency?
No. Heat content measures energy per barrel of fuel. Efficiency requires an output-to-input measure such as heat rate.
Related Articles
Green Map creates custom-edited map images using open geographic data sources such as geoBoundaries, Natural Earth, OpenStreetMap, and government open data. These maps are edited visual materials, not raw data files, and are provided for education, documents, presentations, and graphic reference.