Petroleum use in electricity generation is easier to interpret when petroleum liquids are separated from petroleum coke. In the U.S. Energy Information Administration’s 2024 Electric Power Operational Data, petroleum liquids consumed for electricity generation across the 50 states and the District of Columbia sum to 20,786.948 thousand barrels. The rounded total matches the 20,787 thousand barrels reported for Petroleum Liquids, Total (all sectors), in the EIA Electric Power Annual.
The distribution is extremely concentrated. Hawaii records 11,802.504 thousand barrels, or 56.8% of the 51-jurisdiction total. Alaska adds 1,687.715 thousand barrels, taking the combined share of the top two to 64.9%. By contrast, the median jurisdiction is only 100.837 thousand barrels. The mean of 407.587 thousand barrels is about four times the median because the largest observations pull the average sharply upward.
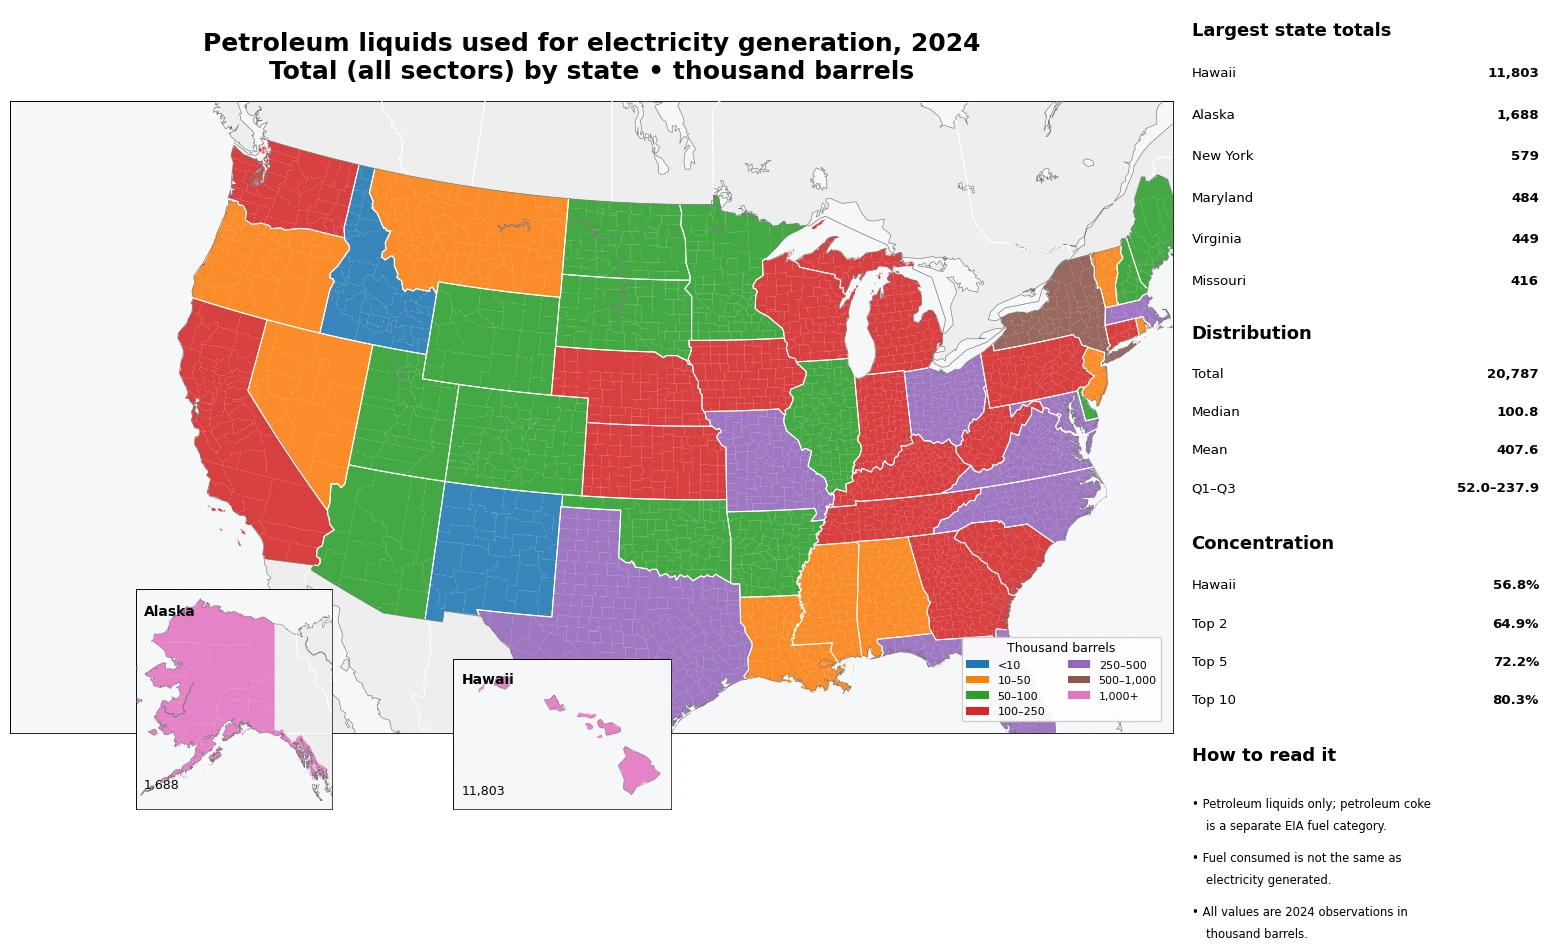
Table of Contents
Why this metric is different from the earlier petroleum-fuel article
A previously published Green Map article uses a broader EIA Petroleum measure for the Electric Power sector, where petroleum coke can materially affect state totals. This candidate uses Petroleum Liquids (PEL) and corresponds to the Total (all sectors) petroleum-liquids total. The titles may sound related, but the fuel definition and sector coverage are not the same.
The difference is visible in states such as Michigan and Ohio. Broader petroleum measures that include petroleum coke can make those states much larger because coke consumption is substantial. In the petroleum-liquids-only file, Michigan is 179.254 thousand barrels and Ohio is 255.072 thousand barrels. Hawaii, however, remains the dominant state because its petroleum-liquid use itself is exceptionally high. Keeping the fuel definitions separate prevents two different EIA series from being treated as duplicates.
Hawaii alone accounted for 56.8% of the 2024 total
The 51-jurisdiction total is 20,786.948 thousand barrels. Hawaii contributes 11,802.504 thousand barrels, equal to 56.8% of the total. Adding Alaska lifts the top-two share to 64.9%. The top five states account for 72.2%, and the top ten account for 80.3%. Petroleum-liquid fuel use for electricity generation is therefore not evenly distributed across the country; a small number of states drive most of the national total.
| State | 2024 consumption (thousand barrels) | Share of total |
|---|---|---|
| Hawaii | 11,802.504 | 56.8% |
| Alaska | 1,687.715 | 8.1% |
| New York | 579.388 | 2.8% |
| Maryland | 483.537 | 2.3% |
| Virginia | 449.395 | 2.2% |
| Missouri | 416.090 | 2.0% |
| Texas | 345.693 | 1.7% |
| Florida | 327.021 | 1.6% |
| North Carolina | 314.324 | 1.5% |
| Massachusetts | 291.830 | 1.4% |
| Ohio | 255.072 | 1.2% |
| Kansas | 248.311 | 1.2% |
| Tennessee | 239.871 | 1.2% |
| Pennsylvania | 235.974 | 1.1% |
| West Virginia | 229.015 | 1.1% |
After Hawaii and Alaska, New York records 579.388 thousand barrels, Maryland 483.537, Virginia 449.395, and Missouri 416.090. Texas is 345.693 and Florida 327.021. Large population or large total electricity generation does not automatically place a state near the top because this metric measures the physical quantity of petroleum liquids consumed for generation, not electricity output itself.
The median was 100.8 thousand barrels, versus a mean of 407.6
Across all 51 jurisdictions, the median is 100.837 thousand barrels and the arithmetic mean is 407.587. The first quartile is 52.047 and the third quartile is 237.922 thousand barrels. Half of the observations therefore fall roughly between 52.0 and 237.9, while Hawaii and Alaska sit far above that central range. The mean alone would overstate what a typical state looks like.
| Petroleum-liquids consumption range (thousand barrels) | States + D.C. |
|---|---|
| <10 | 3 |
| 10–50 | 9 |
| 50–100 | 13 |
| 100–250 | 15 |
| 250–500 | 8 |
| 500–1,000 | 1 |
| 1,000+ | 2 |
The 100–250 thousand barrel band contains 15 jurisdictions, while 13 fall between 50 and 100. Only Hawaii and Alaska exceed 1,000 thousand barrels. At the other end, the District of Columbia, Idaho, and New Mexico are below 10 thousand barrels. Because the data span such a wide range, the map uses categorical breaks rather than a simple linear scale that would compress most states into nearly the same color.
All 50 states and the District of Columbia have reported values
This 2024 slice contains all 50 states plus the District of Columbia and has no missing numeric values. D.C. is the smallest at 0.064 thousand barrels, followed by Idaho at 0.083 and New Mexico at 2.011. These are small but positive observations, so they are not converted to zero.
| State or jurisdiction | 2024 consumption (thousand barrels) |
|---|---|
| District of Columbia | 0.064 |
| Idaho | 0.083 |
| New Mexico | 2.011 |
| Rhode Island | 11.278 |
| Vermont | 11.542 |
| Mississippi | 12.512 |
| Nevada | 12.557 |
| Louisiana | 18.090 |
| Oregon | 23.952 |
| Alabama | 34.699 |
Coverage also distinguishes this slice from the earlier broader petroleum dataset. In that earlier API selection, the District of Columbia was not returned, while it is present here for Petroleum Liquids + Total (all sectors). Different facet combinations can change both the values and the set of returned jurisdictions, so state coverage should be checked rather than assumed.
Fuel consumed is not the same as electricity generated or petroleum dependence
A value in thousand barrels does not report megawatthours of electricity generation. Plants can produce different amounts of electricity from the same physical quantity of fuel because heat content, plant efficiency, technology, operating conditions, and combined-heat-and-power configurations differ. Hawaii’s position at the top of this dataset therefore does not mean it generated the most electricity in the United States.
The metric also should not be labeled petroleum dependence without a denominator. A dependence measure would require a comparison with total generation, total fuel input, or another base. This file contains only the numerator—the physical amount of petroleum liquids consumed for electricity generation. A state can have a large absolute amount while petroleum still represents a small share of its overall power system, or vice versa.
Petroleum liquids and petroleum coke are separate EIA categories
The EIA Electric Power Annual reports Petroleum Liquids separately from Petroleum Coke. For 2024, Petroleum Liquids consumed for electricity generation total 20,787 thousand barrels across all sectors. Petroleum coke is reported separately and uses its own physical unit. Combining the two into a broader petroleum concept requires careful unit conversion and scope checking; this article does not do that.
That distinction matters for state rankings. States with substantial petroleum-coke use can rank much higher in a broader petroleum series than in a liquids-only series. A precise label—petroleum liquids consumed for electricity generation—is more informative than treating every petroleum-related series as interchangeable.
Three points to check when reading the map
- Unit: values are thousand barrels. A value of 11,802.504 represents roughly 11.8 million barrels.
- Fuel: the series covers Petroleum Liquids only; Petroleum Coke is separate.
- Scope: the comparison covers 2024 consumption for electricity generation across the 50 states and D.C. on a Total (all sectors) basis. It is not an electricity-generation or fuel-share measure.
Sources: U.S. Energy Information Administration Electric Power Operational Data and Electric Power Annual Table 5.2.A. The map and tables use the 51 annual 2024 observations for consumption-for-eg and petroleum liquids. Totals, averages, medians, quartiles, state shares, and rankings are calculated directly from the reported values without imputation.
Frequently Asked Questions
Which state used the most petroleum liquids for electricity generation in 2024?
Hawaii was highest at 11,802.504 thousand barrels, representing 56.8% of the 51-jurisdiction total. Alaska ranked second at 1,687.715 thousand barrels.
Does this petroleum-liquids series include petroleum coke?
No. EIA reports Petroleum Liquids and Petroleum Coke as separate fuel categories. This article uses the liquids-only series.
Does a high consumption value mean a state is more dependent on petroleum generation?
Not necessarily. The value is an absolute physical amount. A dependence measure would need a denominator such as total generation or total fuel consumption.
Is the District of Columbia included?
Yes. This 2024 Petroleum Liquids + Total (all sectors) slice contains all 50 states plus D.C.; the D.C. value is 0.064 thousand barrels.
Related Articles
Green Map creates custom-edited map images using open geographic data sources such as geoBoundaries, Natural Earth, OpenStreetMap, and government open data.
These maps are edited visual materials, not raw data files, and are provided for education, documents, presentations, and graphic reference.