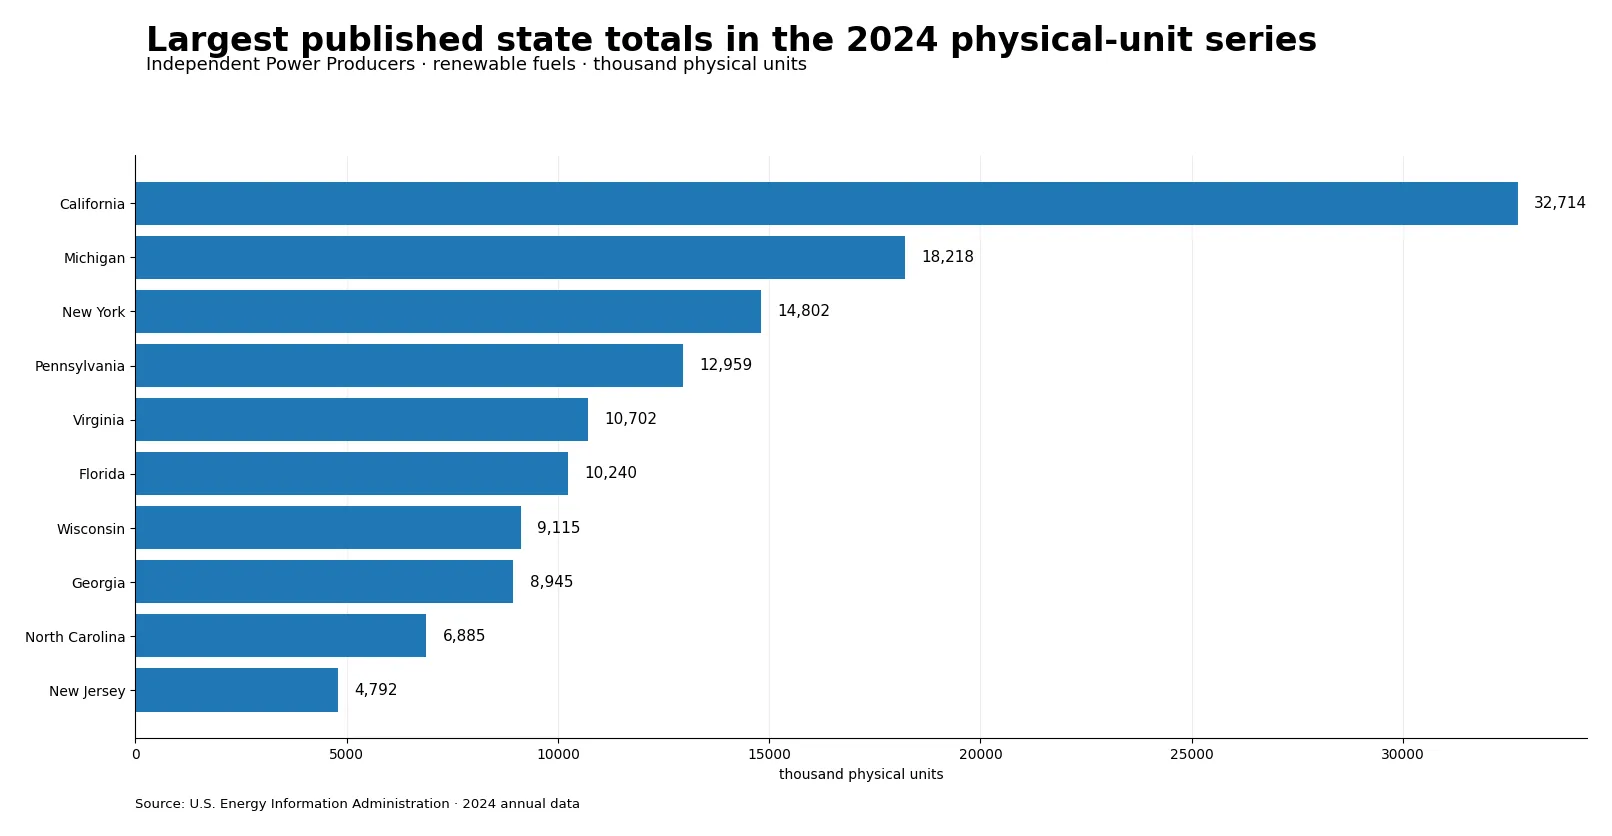
California recorded the largest 2024 value in the U.S. Energy Information Administration’s physical-unit series for renewable-fuel consumption by Independent Power Producers: 32,713.537 thousand physical units. Michigan followed at 18,218.463, and New York at 14,801.639. The verified state file contains 51 observations—50 states plus the District of Columbia—and the simple sum of the published values is 180,197.131.
That ranking needs an important qualification. This series is labeled “thousand physical units,” not billion Btu, MWh, or another energy-normalized unit. The renewable fuel category can combine fuels whose physical quantities are measured differently. The state totals are therefore useful for describing the distribution of this specific EIA series, but they should not be treated as a direct ranking of renewable-energy input. A Btu-based series is the better choice when the question is how much energy the fuels supplied.
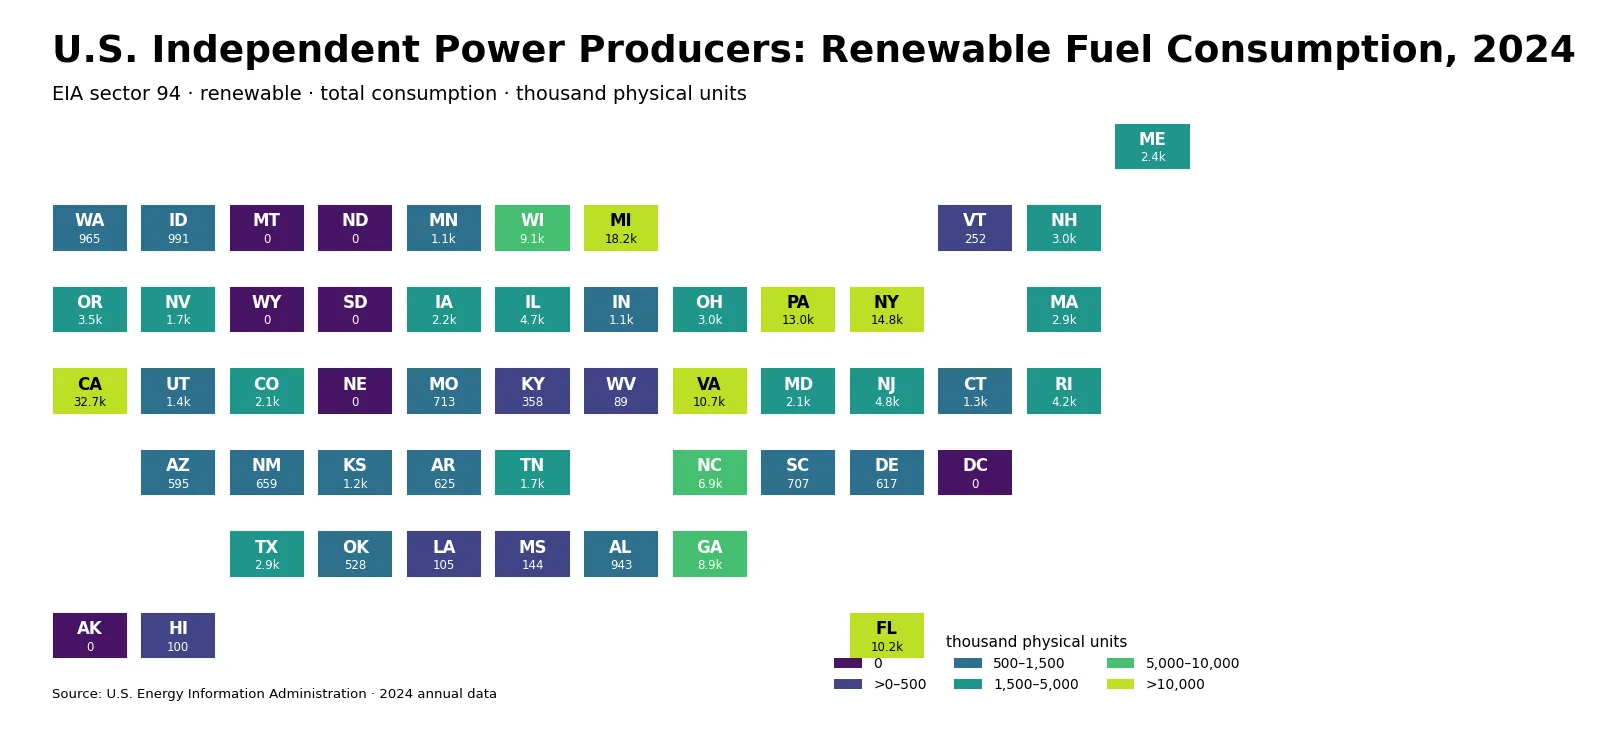
Table of Contents
California was far ahead in the published physical-unit series
California alone represented 18.2% of the sum of the 51 state-level values. Michigan represented 10.1% and New York 8.2%. Together, the top three accounted for 36.5% of the series sum. Adding Pennsylvania and Virginia brings the top-five share to 49.6%, while the top ten reach 71.8%.
The distribution is strongly right-skewed. The arithmetic mean is 3,533.3 thousand physical units, but the median is only 1,200.3. The first quartile is 443.1 and the third quartile 3,240.4. In practical terms, a few very large state values pull the average upward, so the median gives a better sense of the middle observation than the mean does.
| Rank | State | Value (thousand physical units) | Share of 51-value sum |
|---|---|---|---|
| 1 | California | 32,713.537 | 18.2% |
| 2 | Michigan | 18,218.463 | 10.1% |
| 3 | New York | 14,801.639 | 8.2% |
| 4 | Pennsylvania | 12,958.905 | 7.2% |
| 5 | Virginia | 10,701.551 | 5.9% |
| 6 | Florida | 10,240.261 | 5.7% |
| 7 | Wisconsin | 9,114.867 | 5.1% |
| 8 | Georgia | 8,945.332 | 5.0% |
| 9 | North Carolina | 6,885.259 | 3.8% |
| 10 | New Jersey | 4,791.844 | 2.7% |
Seven published zeros are observations, not imputed missing values
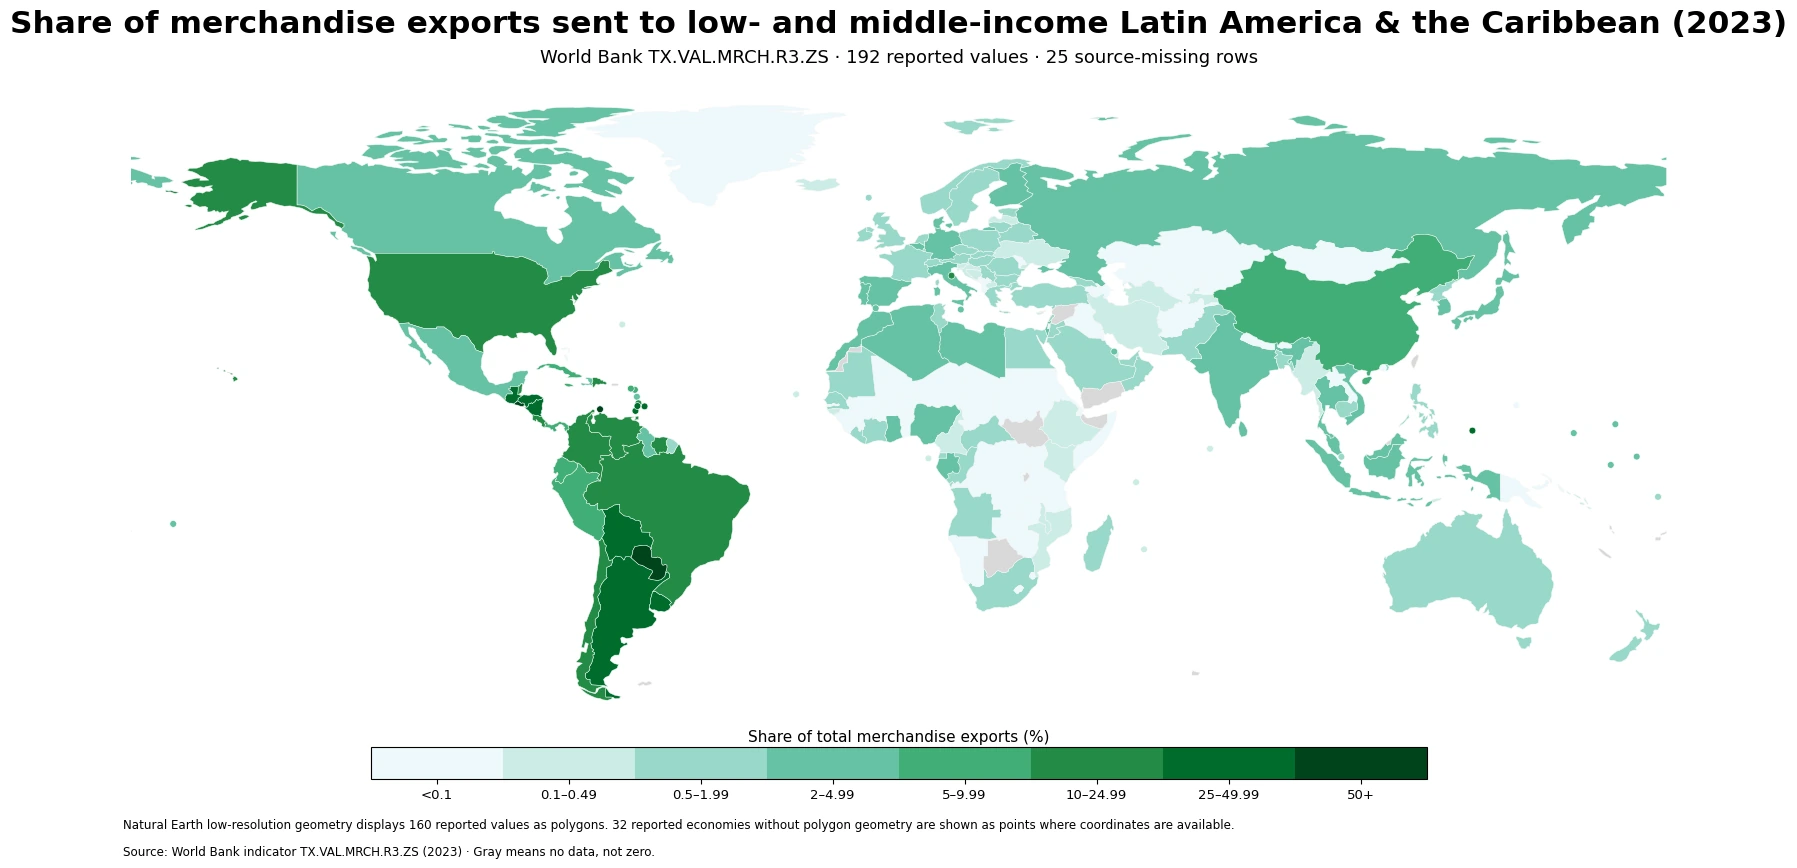
Seven jurisdictions have a published value of 0.0: Alaska, District of Columbia, Montana, North Dakota, Nebraska, South Dakota, Wyoming. Those cells are present in the verified file and are not blanks. The map therefore uses a dedicated zero category. No missing value was replaced with zero, and no state was dropped simply because its value was zero.
A zero in this narrow series should not be expanded into a claim that a jurisdiction had no renewable generation at all. The filter is specific: annual 2024 data, fueltypeid=REN, sectorid=94, and the total-consumption field. Another EIA sector, another fuel category, or a generation series can show activity even when this particular state-sector-fuel observation is zero.
Why “thousand physical units” is not interchangeable with Btu or MWh
Energy statistics often become easier to compare after different fuels are converted to a common energy unit such as Btu. Electricity output is commonly reported in megawatthours. Physical-unit series answer a different question: they record the quantity of fuel in the physical reporting units used for that fuel family. When a broad renewable category combines several fuels, the numerical total can be influenced by the mix of those fuels as well as by the quantity consumed.
That distinction matters for state rankings. A state can be high in the physical-unit series yet not be equally high in an energy-normalized series if its fuel mix contains materials with different heat contents or reporting bases. Conversely, a state with a modest physical quantity may still represent substantial energy input. For that reason, percentages calculated here are described only as shares of this 51-value physical-unit series, not shares of national renewable energy.
Sector 94 limits the comparison to Independent Power Producers
The EIA Electric Power Operational Data API separates producer categories with a sector facet. The current dataset uses sectorid=94, Independent Power Producers. It is not the total for every electric utility, commercial facility, industrial facility, or self-generator. The sector definition is therefore part of the statistical identity of the article and should remain visible when comparing the numbers with other EIA tables.
The metric name also refers to fuels used for electricity generation and useful thermal output. That wording matters because combined heat and power activity can place useful thermal output alongside electricity production in operational fuel-consumption statistics. The 51-row state file does not contain enough detail to attribute each difference to a specific plant, technology, or operating mode.
The high-value states are geographically dispersed
The top of the table is not confined to one region. California leads in the West; Michigan and Wisconsin appear prominently in the Midwest; New York, Pennsylvania, New Jersey, Rhode Island and New Hampshire are in the Northeast; and Virginia, Florida, Georgia and North Carolina are high in the South and Southeast. Oregon also appears among the larger values. This broad spread argues against reading the pattern as a simple regional gradient.
Population size alone is also an incomplete explanation. Some smaller states appear well above many larger states, while Texas is below several jurisdictions that have smaller populations and electricity markets. The likely explanation involves the composition of independent-power-producer facilities and the renewable fuels they consume, but the aggregated state data cannot isolate those mechanisms. Plant- and fuel-level EIA-923 data would be required for a causal or technology-specific account.
How to interpret the concentration statistics without overstating them
The simple sum, 180,197.131, is useful as a denominator for describing concentration within this one EIA series. For example, California’s 18.2% means that California contributes that fraction of the sum of the 51 published state values under the same 2024 REN/sector-94/total-consumption/physical-unit definition. It does not mean California supplied that share of U.S. renewable electricity, renewable heat, or renewable energy input.
The same caution applies to the top-five and top-ten shares. They summarize how the numbers in this table are distributed; they are not a substitute for an energy balance. If the analytical goal is energy contribution, the appropriate next step is to use an EIA series reported in Btu and keep the sector and fuel definitions aligned.
A one-year cross-section cannot establish a trend
All 51 observations refer to 2024, which makes the state comparison internally consistent in time. It does not show whether California, Michigan, or New York increased or decreased relative to earlier years. A trend analysis would require pulling multiple years with the same API route, field, fueltypeid, sectorid, geography and unit, then checking for changes in reporting definitions before calculating growth rates.
The state aggregation also hides within-state variation. One state value can combine multiple facilities and multiple renewable fuel types. A large total might reflect one major facility, many smaller facilities, or a particular reporting mix. The current evidence supports a geographic comparison of published totals, not a plant-efficiency ranking or a detailed fuel-mix diagnosis.
Source, coverage, and calculations
The primary source is the U.S. Energy Information Administration Electric Power Operational Data API. The verified filter is annual 2024, fueltypeid=REN, sectorid=94, and field=total-consumption. The dataset contains one row for each of the 50 states and the District of Columbia. There are no missing numeric cells in the verified value column, and the seven zeros are retained exactly as published.
Ranks, the 180,197.131 series sum, the 3,533.3 mean, the 1,200.3 median, quartiles, and concentration shares were calculated directly from those 51 observations. No article or third-party prose was used as a factual source. Official references: U.S. Energy Information Administration Electricity Data · Electric Power Operational Data API.
Frequently Asked Questions
Which state had the largest 2024 value in the physical-unit series?
California was highest at 32,713.537 thousand physical units, followed by Michigan and New York.
Does California’s 18.2% share mean it used 18.2% of U.S. renewable energy?
No. That percentage is California’s share of the sum of the 51 values in this physical-unit series. It is not an energy-normalized Btu share.
Are the zero values missing data?
No. 7 jurisdictions have published 0.0 observations in the verified file. Missing values were not converted to zero.
Why can this ranking differ from a Btu-based renewable-energy ranking?
Physical units describe fuel quantities, while Btu measures energy. Different fuel mixes and heat contents can change the ranking after conversion to a common energy unit.
Related Articles
Green Map creates custom-edited map images using open geographic data sources such as geoBoundaries, Natural Earth, OpenStreetMap, and government open data. These maps are edited visual materials, not raw data files, and are provided for education, documents, presentations, and graphic reference.