The 2025 state-level distribution of fuel consumption for electricity generation and useful thermal output was led by Texas by a wide margin. Across the 50 states and the District of Columbia, the U.S. Energy Information Administration data sum to 36,680.1 million MMBtu. Texas recorded 4,540.6 million MMBtu, equal to 12.38% of the 51-jurisdiction total. Pennsylvania ranked second at 2,147.5 million MMBtu and Florida third at 2,123.9. Texas alone was about 2.11 times Pennsylvania and roughly 8.6 times the median jurisdiction.
This is not a ranking of electricity generation. The EIA field used here is `total-consumption-btu`, which expresses energy consumption associated with electricity generation and useful thermal output in a common heat-content unit. The fuel facet is set to ALL, so the series is broader than a petroleum-only, coal-only, natural-gas-only, or renewable-only comparison. A high value means that the absolute energy-consumption total is large under this specific definition. It does not, by itself, show low efficiency, a high share of any single fuel, or a high level of retail electricity use.
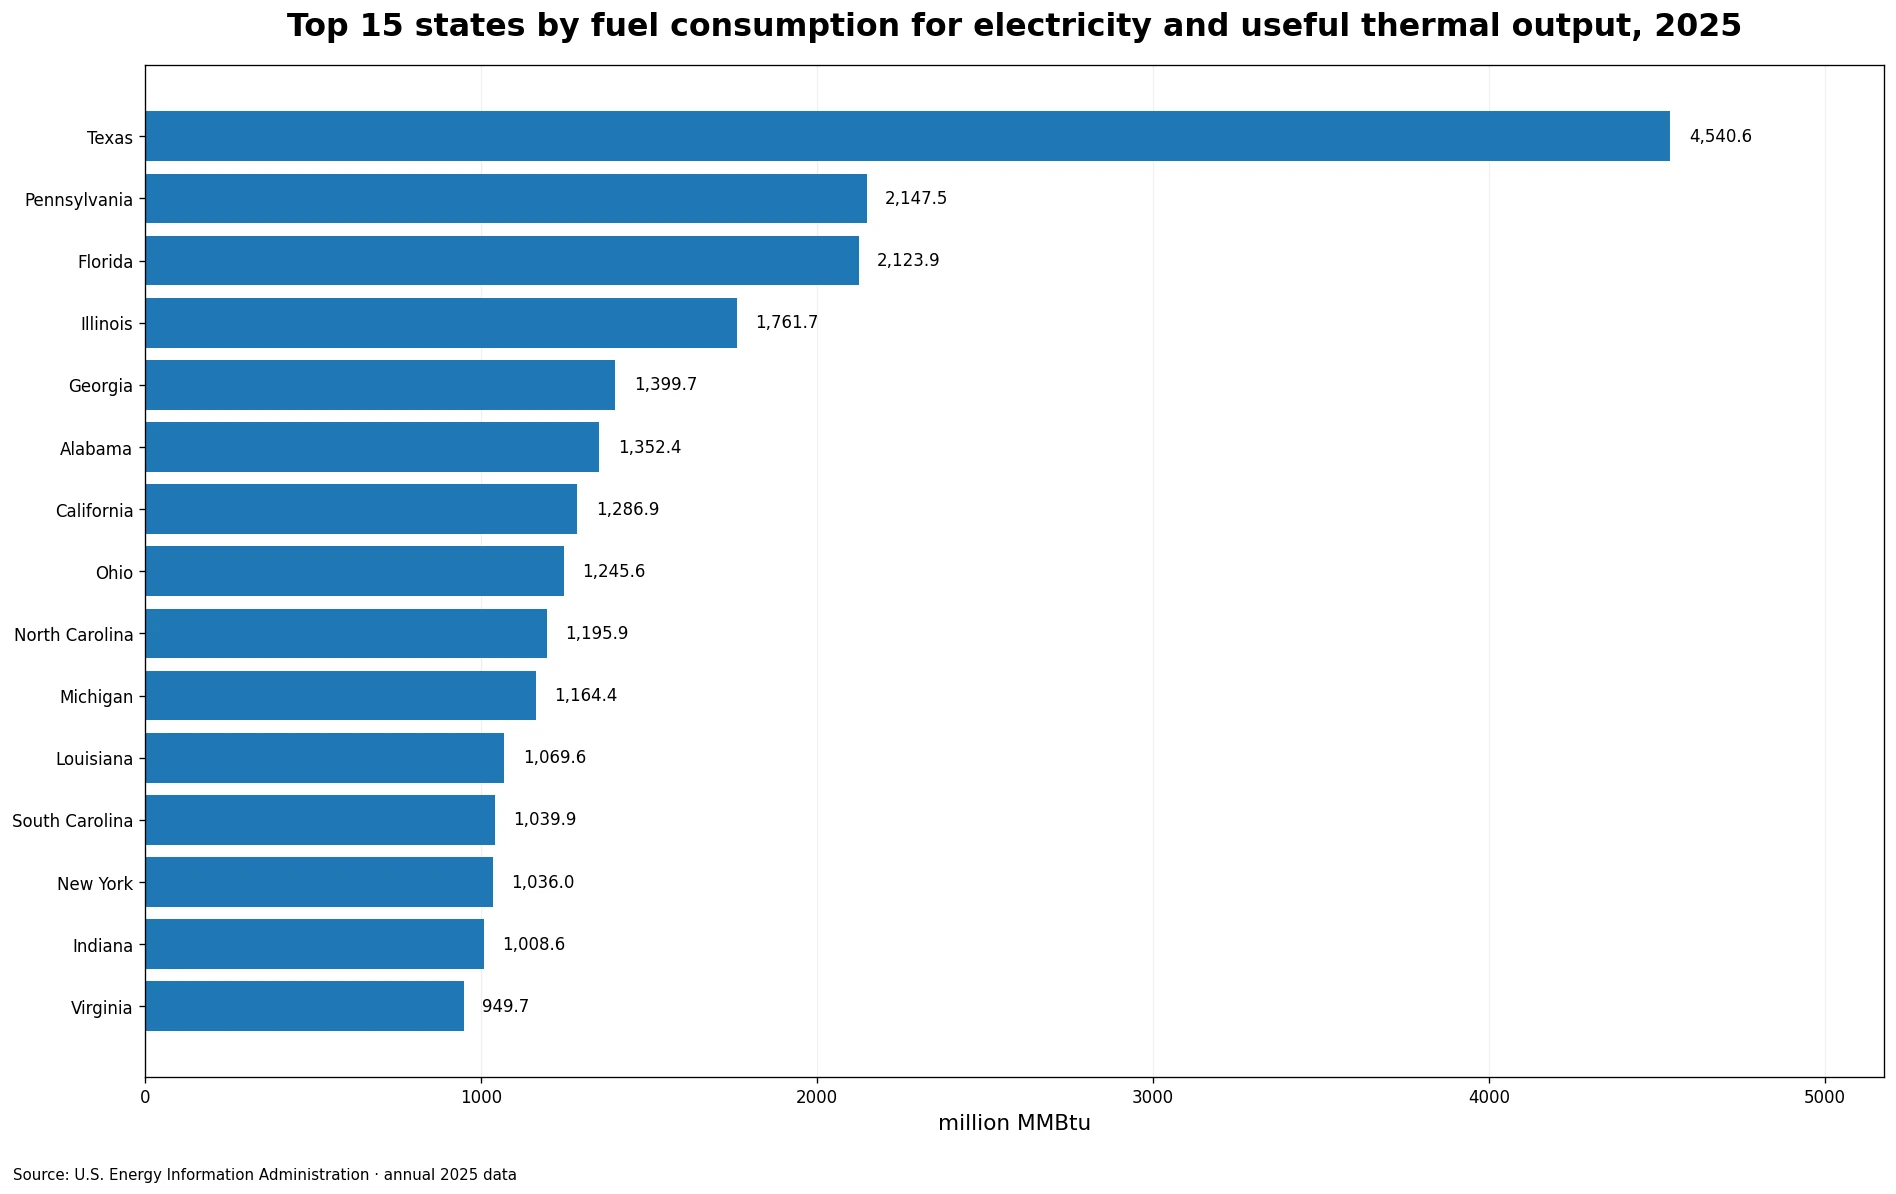
Table of Contents
The metric measures energy input, not electricity output
Electricity statistics often place generation and fuel consumption next to each other, but the two should not be treated as interchangeable. Net generation is commonly reported in megawatthours, while this dataset converts energy consumption to Btu and reports the result in million MMBtu. The relationship between those measures depends on technologies, fuel types, plant operating conditions, and whether a facility also produces useful heat. For that reason, this ranking answers a narrower question: where did the EIA record the largest absolute energy-consumption values under the total-consumption-btu definition in 2025? It does not answer which states generated the most electricity or used electricity most efficiently.
The phrase “useful thermal output” also matters. Combined-heat-and-power facilities can use fuel to produce both electricity and heat that is captured for a useful purpose. A measure that includes both electricity generation and useful thermal output therefore has a wider accounting boundary than a field restricted to electricity generation alone. Two EIA series may look similar in name while producing different state totals because one includes useful heat and the other does not. The current comparison keeps that broader boundary intact instead of shortening the metric into a generic “fuel use” label that could obscure what is being measured.
Texas accounted for 12.38% of the 51-jurisdiction total
Texas contributed 12.38% of the total. Pennsylvania contributed 5.85% and Florida 5.79%. Together, the top three states accounted for 24.02% of the national state-level sum. Adding Illinois and Georgia lifted the top-five share to 32.64%. The distribution is therefore concentrated enough for the leading states to matter, but it is not a case in which one or two jurisdictions dominate the entire series.
The top ten states represented 49.67% of the total, almost half of all 51 observations. Expanding the group through Virginia in fifteenth place raised the cumulative share to 63.58%. The leaders are geographically diverse. Texas, Florida, Georgia and Alabama appear from the South; Pennsylvania and New York from the Northeast; Illinois, Ohio, Michigan and Indiana from the Midwest; and California from the West. That pattern is consistent with an ALL-fuels aggregate that reflects many different electricity-system configurations rather than a single resource geography.
Top 15 states in 2025
| Rank | State | Consumption (million MMBtu) | Share of 51-jurisdiction total |
|---|---|---|---|
| 1 | Texas | 4,540.6 | 12.38% |
| 2 | Pennsylvania | 2,147.5 | 5.85% |
| 3 | Florida | 2,123.9 | 5.79% |
| 4 | Illinois | 1,761.7 | 4.80% |
| 5 | Georgia | 1,399.7 | 3.82% |
| 6 | Alabama | 1,352.4 | 3.69% |
| 7 | California | 1,286.9 | 3.51% |
| 8 | Ohio | 1,245.6 | 3.40% |
| 9 | North Carolina | 1,195.9 | 3.26% |
| 10 | Michigan | 1,164.4 | 3.17% |
| 11 | Louisiana | 1,069.6 | 2.92% |
| 12 | South Carolina | 1,039.9 | 2.84% |
| 13 | New York | 1,036.0 | 2.82% |
| 14 | Indiana | 1,008.6 | 2.75% |
| 15 | Virginia | 949.7 | 2.59% |
The largest gap in the table is between first and second place. Texas recorded a little more than twice Pennsylvania’s value. Pennsylvania and Florida, in contrast, were very close to each other. Below them, the values decline more gradually. Louisiana through Virginia, positions eleven through fifteen, all fall in a relatively narrow band of roughly 950 to 1,070 million MMBtu. This creates a distribution in which Texas stands out clearly, while much of the rest of the upper tier forms smaller clusters rather than evenly spaced ranks.
Rank alone should not be used as a substitute for system size, population, economic activity, or electricity demand. A state can host large generating fleets that serve customers beyond its borders, and industrial structure can change the relationship between population and power-sector energy use. Fuel mix also matters because thermal conversion and accounting differ across energy sources. The table is most useful as a descriptive state comparison. Explaining why one state sits above another requires additional evidence on generation by fuel, installed capacity, combined-heat-and-power activity, plant utilization, and interstate electricity flows.
The mean was 719.2 million MMBtu, but the median was 528.4
The arithmetic mean across the 51 jurisdictions was 719.2 million MMBtu, while the median was 528.4. Only 17 jurisdictions exceeded the mean. The first quartile was about 264.6 million MMBtu and the third quartile about 1,022.3. The difference between the mean and median shows that larger observations pull the average upward. Texas is the clearest example: its value was about 8.6 times the median, so a simple average overstates what a middle-ranked jurisdiction looks like.
The quartiles provide another way to read the spread. Half of the jurisdictions were at or below 528.4 million MMBtu, and roughly one quarter were above about 1,022.3 million MMBtu. New York and Indiana sit near that upper-quartile boundary, while most of the top-fifteen table is above it. These summary statistics are useful because state ranks can move with small numeric differences, whereas the distributional picture is more stable: a relatively small upper group contains large values, and a long set of smaller jurisdictions occupies the lower half.
Small values need context as much as large values do
The District of Columbia had the smallest observation at 2.2938 million MMBtu. Vermont recorded 12.7102, Delaware 56.7176, Alaska 58.0523, Rhode Island 78.9443 and Hawaii 89.4478 million MMBtu. Those numbers should not be interpreted as a scorecard for energy policy or as direct evidence of low electricity use. Absolute totals are strongly affected by the size and location of generating facilities, the composition of the local system, and the role a jurisdiction plays in regional electricity markets.
The Hawaii example also illustrates why fuel filters matter. Hawaii can rank very high in a petroleum-specific consumption series while remaining near the bottom of an all-fuels absolute total. Both statements can be true because the questions are different. A state’s position changes when the numerator changes from one fuel family to all fuels or when the accounting boundary changes from electricity generation only to electricity generation plus useful thermal output. Reading the field name, fuel facet, unit and year is therefore essential before comparing one EIA ranking with another.
No single fuel explains the geographic pattern
The top fifteen extend across several U.S. regions rather than forming one contiguous cluster. Texas is the largest observation, but Pennsylvania and Florida are nearly tied for second and third. Illinois is fourth, Georgia fifth, Alabama sixth, California seventh, and Ohio eighth. North Carolina and Michigan complete the top ten. Louisiana, South Carolina, New York, Indiana and Virginia fill positions eleven through fifteen. Such a broad spread is what we would expect from a total-fuels measure that combines many power-system structures.
States can reach a large aggregate through very different combinations of natural gas, coal, nuclear energy, renewable resources and other categories represented in EIA electricity data. The total does not identify which component produced the state’s value. It is therefore appropriate to describe the observed scale and distribution, but not to assign a single causal story to each state. A causal or fuel-mix explanation requires disaggregating the ALL facet and comparing the resulting components with generation, capacity and plant-level information.
Why the all-fuels total differs from petroleum-only series
Petroleum-only state comparisons answer a much narrower question. They can elevate jurisdictions where petroleum plays an unusually important role even if the state’s overall power-sector energy consumption is small. Once the fuel filter is broadened to ALL, states with large natural-gas, coal, nuclear or renewable systems also contribute to the total. That is why the 2025 all-fuels ranking led by Texas, Pennsylvania and Florida looks very different from petroleum-focused rankings in which Hawaii can be prominent.
The same caution applies to the output boundary. A field for consumption used only for electricity generation is not identical to `total-consumption-btu`, which includes useful thermal output. Combined-heat-and-power activity can add energy consumption that would not appear in an electricity-only field. For reproducibility, the definition used here is kept explicit: annual frequency, 2025, `total-consumption-btu`, fueltypeid ALL, state-level observations, with the source’s million MMBtu unit preserved.
Source and calculation method
The source is the U.S. Energy Information Administration Electric Power Operational Data API. The annual query selects `total-consumption-btu`, sets the fuel facet to ALL, and uses 2025 observations. The dataset contains one row for each of the 50 states and the District of Columbia, with no missing state values. The published unit is million MMBtu. No missing jurisdiction was filled with zero, no other year was substituted, and no separate fuel series was added to the values.
The reference total of 36,680.1 million MMBtu is the sum of the 51 observations. Each state share is the state value divided by that same sum. The mean, median and quartiles are calculated from all 51 values. The cumulative shares of the top three, top five and top ten are 24.02%, 32.64% and 49.67%, respectively. The chart and table display only the top fifteen for readability, but all distribution statistics use the complete 51-jurisdiction dataset.
Five points to keep in mind
- These are absolute 2025 energy-consumption values, not a ranking of electricity generation.
- The fuel facet is ALL, so the total does not reveal the share of any one fuel.
- The unit is million MMBtu and should not be compared numerically with generation reported in MWh.
- The comparison includes all 50 states plus the District of Columbia using the same annual definition.
- Explaining state differences requires additional fuel-specific, generation, capacity and combined-heat-and-power data.
The main 2025 result is a combination of a standout Texas value and a geographically broad upper tier. Texas represented 12.4% of the 51-jurisdiction total, the top three states 24.0%, and the top ten 49.7%. At the same time, half of all jurisdictions were at or below the median of 528.4 million MMBtu. Keeping the metric’s boundary intact makes the comparison useful: it shows where total fuel and energy consumption associated with electricity generation and useful thermal output was largest, without turning that observation into an unsupported judgment about efficiency, fuel dependence or electricity demand.
Frequently Asked Questions
Which state had the highest fuel consumption for electricity generation and useful thermal output in 2025?
Texas led with 4,540.6 million MMBtu, equal to 12.4% of the total across the 50 states and District of Columbia.
Is this the same as a ranking of electricity generation?
No. The series measures energy consumption in million MMBtu under the EIA total-consumption-btu definition, not electricity output in MWh.
How concentrated were the 2025 values?
The top three states accounted for 24.0% and the top ten for 49.7% of the total. The median was 528.4 million MMBtu.
Related Articles
Green Map creates custom-edited map images using open geographic data sources such as geoBoundaries, Natural Earth, OpenStreetMap, and government open data. These maps are edited visual materials, not raw data files, and are provided for education, documents, presentations, and graphic reference.