The U.S. Energy Information Administration’s 2024 state data require a careful scope check before the numbers are compared. This dataset is not limited to petroleum liquids used only to generate electricity. It uses EIA’s broader Petroleum aggregate and the total-consumption measure, which combines fuel allocated to electricity generation with fuel allocated to useful thermal output. The unit is thousand barrels, and all 50 states plus the District of Columbia have observations for the same 2024 period.
That definition separates this series from several closely related EIA datasets. Petroleum Liquids is a narrower fuel category, while EIA’s broad Petroleum aggregate also includes petroleum coke converted to liquid-petroleum equivalents. Electricity-generation-only consumption is narrower again because it excludes the useful-thermal-output portion. Two maps can therefore use the same year, the same states and the word “petroleum” while still measuring different things. This article keeps those dimensions explicit so the state ranking is not mistaken for the liquids-only generation series.
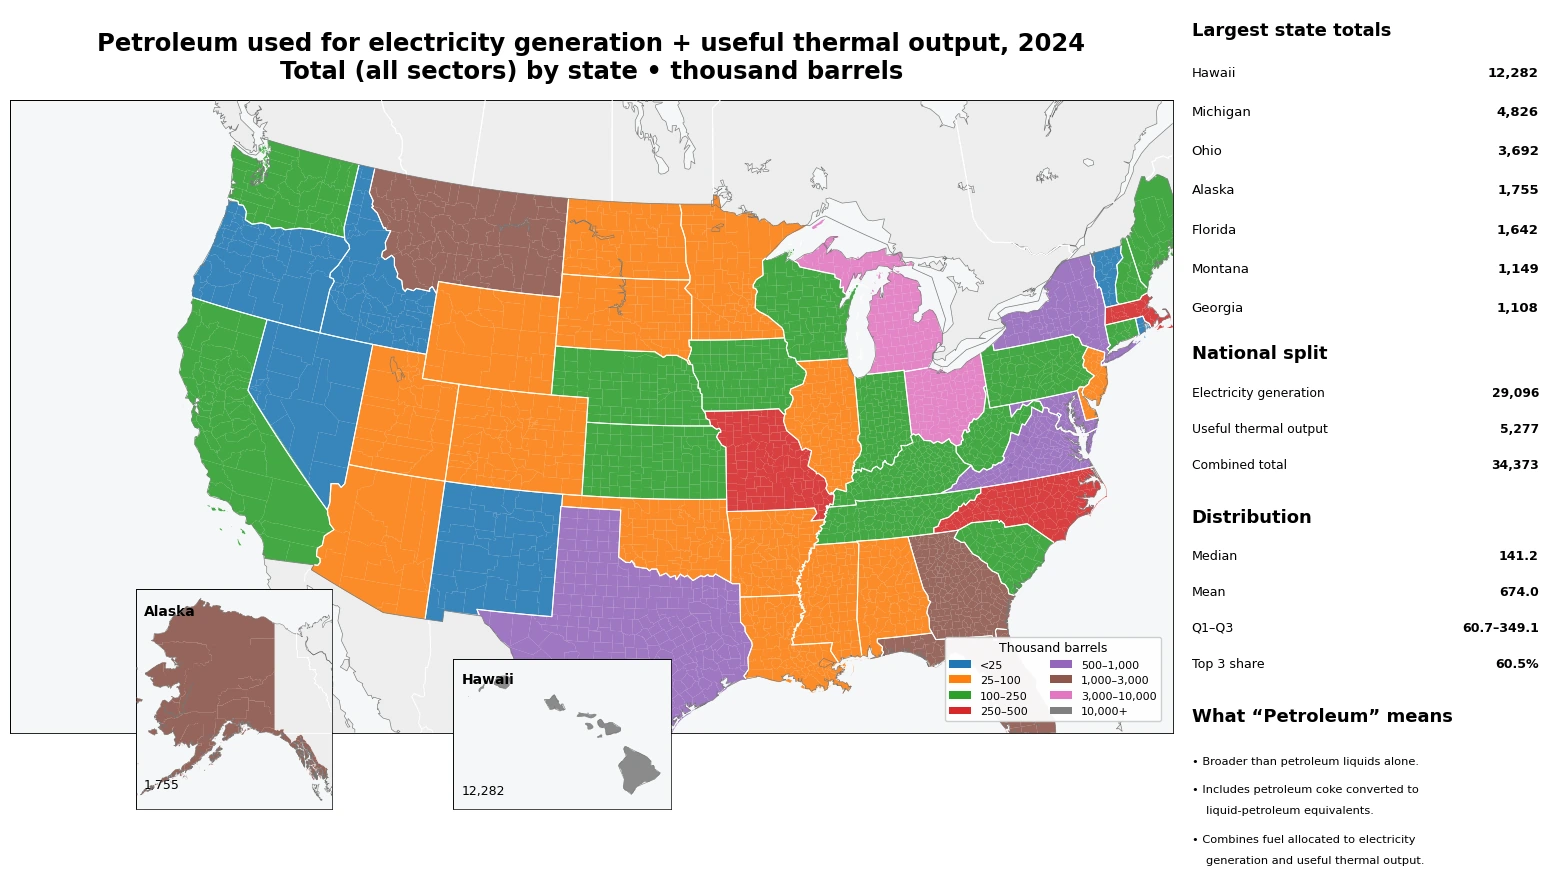
Table of Contents
The 2024 state total was about 34.37 million barrels
Adding the 51 state-jurisdiction observations produces 34,373.128 thousand barrels, or about 34.37 million barrels. EIA’s national summary for the same broad Petroleum category reports 29,096 thousand barrels allocated to electricity generation and 5,277 thousand barrels allocated to useful thermal output, for a combined 34,373 thousand barrels. The state total matches that national summary within rounding, which is an important cross-check on the unit and series definition.
Electricity generation represents about 84.6% of the combined national figure and useful thermal output about 15.4%. The latter matters because combined-heat-and-power and other qualifying facilities can allocate fuel to useful heat as well as electricity. This dataset therefore describes a broader fuel-input total than an electricity-generation-only series. It does not describe all petroleum consumed in a state, and it should not be extended to transportation, building heating or other uses outside EIA’s electric-power reporting scope.
Hawaii led with 35.7%, but Michigan and Ohio changed the shape of the ranking
Hawaii has the largest 2024 value at 12,281.763 thousand barrels, equal to 35.7% of the 51-jurisdiction total. Michigan follows at 4,826.450 thousand barrels and Ohio at 3,691.572. The top two jurisdictions account for 49.8% of the total, the top three for 60.5%, the top five for 70.4%, and the top ten for 83.3%. The national distribution is therefore highly concentrated, but the concentration is not driven by Hawaii alone.
| State | 2024 Petroleum total consumption (thousand barrels) | Share of U.S. total |
|---|---|---|
| Hawaii | 12,281.763 | 35.7% |
| Michigan | 4,826.450 | 14.0% |
| Ohio | 3,691.572 | 10.7% |
| Alaska | 1,754.595 | 5.1% |
| Florida | 1,641.618 | 4.8% |
| Montana | 1,148.815 | 3.3% |
| Georgia | 1,107.992 | 3.2% |
| Maryland | 803.365 | 2.3% |
| Virginia | 745.579 | 2.2% |
| New York | 615.092 | 1.8% |
| Texas | 588.462 | 1.7% |
| Missouri | 434.200 | 1.3% |
| North Carolina | 357.666 | 1.0% |
| Massachusetts | 340.467 | 1.0% |
| Kansas | 248.311 | 0.7% |
Michigan and Ohio stand out much more in this broad total-consumption series than they do in a petroleum-liquids electricity-generation-only comparison. That is exactly why the EIA facet and field definitions matter. Broad Petroleum can incorporate petroleum coke on a liquid-equivalent basis, and total consumption adds fuel allocated to useful thermal output. Industrial and combined-heat-and-power activity can therefore affect a state’s position even when its liquids-only generation consumption is not near the top. The ranking is a fuel-input ranking, not an electricity-output ranking.
The median was 141.2 thousand barrels, far below the 674.0 thousand-barrel mean
Across the 51 jurisdictions, the median is 141.150 thousand barrels and the arithmetic mean is 673.983 thousand barrels. The first quartile is 60.674 and the third quartile is 349.066 thousand barrels. The mean is about 4.8 times the median because a small number of very large state observations pull the average upward. For that reason, the median and interquartile range give a better picture of the typical state scale than the mean alone.
| Consumption range (thousand barrels) | States + D.C. |
|---|---|
| <25 | 7 |
| 25–100 | 15 |
| 100–250 | 15 |
| 250–500 | 3 |
| 500–1,000 | 4 |
| 1,000–3,000 | 4 |
| 3,000–10,000 | 2 |
| 10,000+ | 1 |
There are 15 jurisdictions in the 100–250 thousand-barrel range and 15 between 25 and 100 thousand barrels. Only three jurisdictions exceed 3,000 thousand barrels: Hawaii, Michigan and Ohio. A simple linear color scale would compress most states into a narrow visual range because Hawaii is above 12,000 thousand barrels. The map therefore uses discrete bands so that differences among the much larger middle group remain visible.
A high total does not mean a state is more dependent on petroleum
The values are absolute physical quantities. They do not contain a denominator for total electricity generation, total fuel input, state energy use or population. A state with a large industrial base or large combined-heat-and-power facilities can report a large Petroleum total while petroleum still represents a modest share of its overall power system. Conversely, a smaller state can have a low absolute total but a comparatively important petroleum role within its own generation mix. The map answers “where was more Petroleum fuel consumed in this EIA scope?” rather than “which states depended most on petroleum?”
A dependence analysis would require a ratio, such as Petroleum fuel input divided by all generating fuel input, petroleum-fired generation divided by total generation, or another denominator selected for the question. Efficiency analysis would require electricity and useful-thermal output measures as well. Cost and emissions comparisons would need still other variables. Keeping the absolute fuel quantity separate from these derived concepts prevents the map from implying conclusions the dataset does not support.
Why Hawaii still ranks first while Michigan and Ohio move sharply upward
Hawaii remains the largest state observation at 12,281.763 thousand barrels, but its share in this broader series is 35.7% rather than dominating the entire total. Michigan and Ohio together add more than 8.5 million barrel-equivalents, and Florida, Montana and Georgia also appear high. These changes reflect the broader series definition, not a contradiction in the EIA data. When the fuel category and consumption purpose change, the state pattern can change even though the year and geography remain fixed.
The top ten jurisdictions account for more than four-fifths of the combined total. Yet they represent very different power systems: isolated island grids, industrial states, large population centers and states with different mixes of generation technologies. The map can identify where the reported fuel total is concentrated, but it cannot establish a single causal explanation for every high-value state. Plant-level fuel records, combined-heat-and-power characteristics and industrial structure would be needed to explain each case.
The smallest reported values are real observations, not missing data
The District of Columbia has the smallest value at 0.075 thousand barrels, followed by Idaho at 0.083 and New Mexico at 2.011. These are small positive observations rather than missing values, so they are retained as reported and are not converted to zero. All 51 jurisdictions have numeric 2024 values. Very small jurisdictions such as D.C. can be difficult to see on a national map, which is why the table is an important companion to the geographic display.
| State or jurisdiction | 2024 Petroleum total consumption (thousand barrels) |
|---|---|
| District of Columbia | 0.075 |
| Idaho | 0.083 |
| New Mexico | 2.011 |
| Vermont | 11.548 |
| Nevada | 12.557 |
| Rhode Island | 21.723 |
| Oregon | 23.959 |
| Mississippi | 29.724 |
| Illinois | 53.240 |
| Oklahoma | 53.269 |
A low value also should not be read as “no petroleum use” in the broader state economy. This dataset covers fuel consumption within EIA’s electric-power operational scope. Transportation fuels, petroleum used directly by unrelated industrial processes, retail heating fuels and other non-electric-power uses are outside the measure. The correct interpretation is that the reported Petroleum fuel input for electricity generation and useful thermal output was small in that jurisdiction during 2024.
Petroleum is broader than Petroleum Liquids in EIA’s summary statistics
EIA’s broad Petroleum category includes distillate fuel oil, residual fuel oil, jet fuel, kerosene, waste oil and petroleum coke converted to liquid-petroleum equivalents. Petroleum Liquids is reported separately in more detailed tables, while petroleum coke has its own physical-unit series. The broad Petroleum aggregate therefore should not be labeled “petroleum liquids” even though its summary unit is thousand barrels. This distinction is especially important for states where petroleum-coke consumption is material.
It also explains why two series with the same geography and year can have very different totals. A liquids-only electricity-generation series excludes petroleum coke and excludes fuel allocated to useful thermal output. The present series includes the broader Petroleum definition and both output purposes. Treating those as duplicates would erase meaningful information; using nearly identical public titles, however, would confuse readers. The title here therefore foregrounds electricity generation plus useful thermal output and the combined Petroleum total.
Useful thermal output adds a separate component to the fuel total
In the 2024 national EIA summary, 5,277 thousand barrels of broad Petroleum are allocated to useful thermal output, about 15.4% of the combined total. Useful thermal output is energy delivered as useful heat rather than electricity, which is particularly relevant to combined-heat-and-power operations. Fuel allocated to that heat is part of total-consumption but not part of an electricity-generation-only consumption measure. This is why the total-consumption field is useful for understanding the full reported Petroleum fuel input at facilities that can produce both electricity and usable heat.
The useful-thermal component should not be equated with all industrial heat demand or district-heating demand in a state. It is an allocation within EIA’s reporting framework for electric-power and combined-heat-and-power facilities. A high state value therefore supports the narrower statement that reported Petroleum fuel consumption for electricity generation plus useful thermal output was high; it does not by itself measure all thermal energy use in the economy.
Three checks for reading the state map correctly
- Fuel scope: broad Petroleum is wider than Petroleum Liquids and includes petroleum coke converted to liquid-petroleum equivalents.
- Consumption purpose: total-consumption combines fuel allocated to electricity generation and useful thermal output.
- Unit and meaning: values are absolute thousand-barrel quantities, not electricity output, efficiency, petroleum share, cost or emissions.
Sources: U.S. Energy Information Administration Electric Power Operational Data and Electric Power Annual Table 1.2. The map and tables use all 51 reported annual observations for 2024. Totals, means, medians, quartiles, state shares and rankings are calculated directly from those values. No missing-value imputation or zero-filling is used.
Frequently Asked Questions
Which state had the largest 2024 Petroleum total for electricity generation and useful thermal output?
Hawaii was highest at 12,281.763 thousand barrels, or 35.7% of the 51-jurisdiction total. Michigan and Ohio ranked second and third.
Does the broad EIA Petroleum category mean petroleum liquids only?
No. EIA’s broad Petroleum aggregate includes liquid petroleum products and petroleum coke converted to liquid-petroleum equivalents.
What does including useful thermal output change?
It adds fuel allocated to useful heat as well as fuel allocated to electricity generation. EIA’s 2024 national summary reports 29,096 thousand barrels for electricity generation and 5,277 thousand barrels for useful thermal output.
Does a high state total mean greater petroleum dependence?
Not necessarily. The dataset reports an absolute physical quantity. Dependence requires a denominator such as total generation or total fuel input.
Related Articles
Green Map creates custom-edited map images using open geographic data sources such as geoBoundaries, Natural Earth, OpenStreetMap, and government open data.
These maps are edited visual materials, not raw data files, and are provided for education, documents, presentations, and graphic reference.