Fossil-fuel energy consumed to produce useful thermal output in U.S. combined-heat-and-power activity varied sharply by state in 2025. Using the U.S. Energy Information Administration’s Electric Power Operational Data with the fuel category set to Fossil fuels (FOS) and the sector set to Total (all sectors), the 50 states plus the District of Columbia sum to 1,679.590 million MMBtu. Texas is the largest observation at 459.561 million MMBtu, followed by Louisiana at 197.175. Together, those two states account for 39.1% of the 51-jurisdiction total.
This is not a measure of electricity generation or of total state energy consumption. EIA defines useful thermal output as thermal energy made available by a combined-heat-and-power system for industrial or commercial processes, heating or cooling, or delivery to other end users rather than for electricity generation. The series used here is the fuel energy consumed to produce that useful thermal output. A large value therefore does not, by itself, mean a state has higher CHP efficiency, greater fossil-fuel dependence, or a larger overall electricity sector.
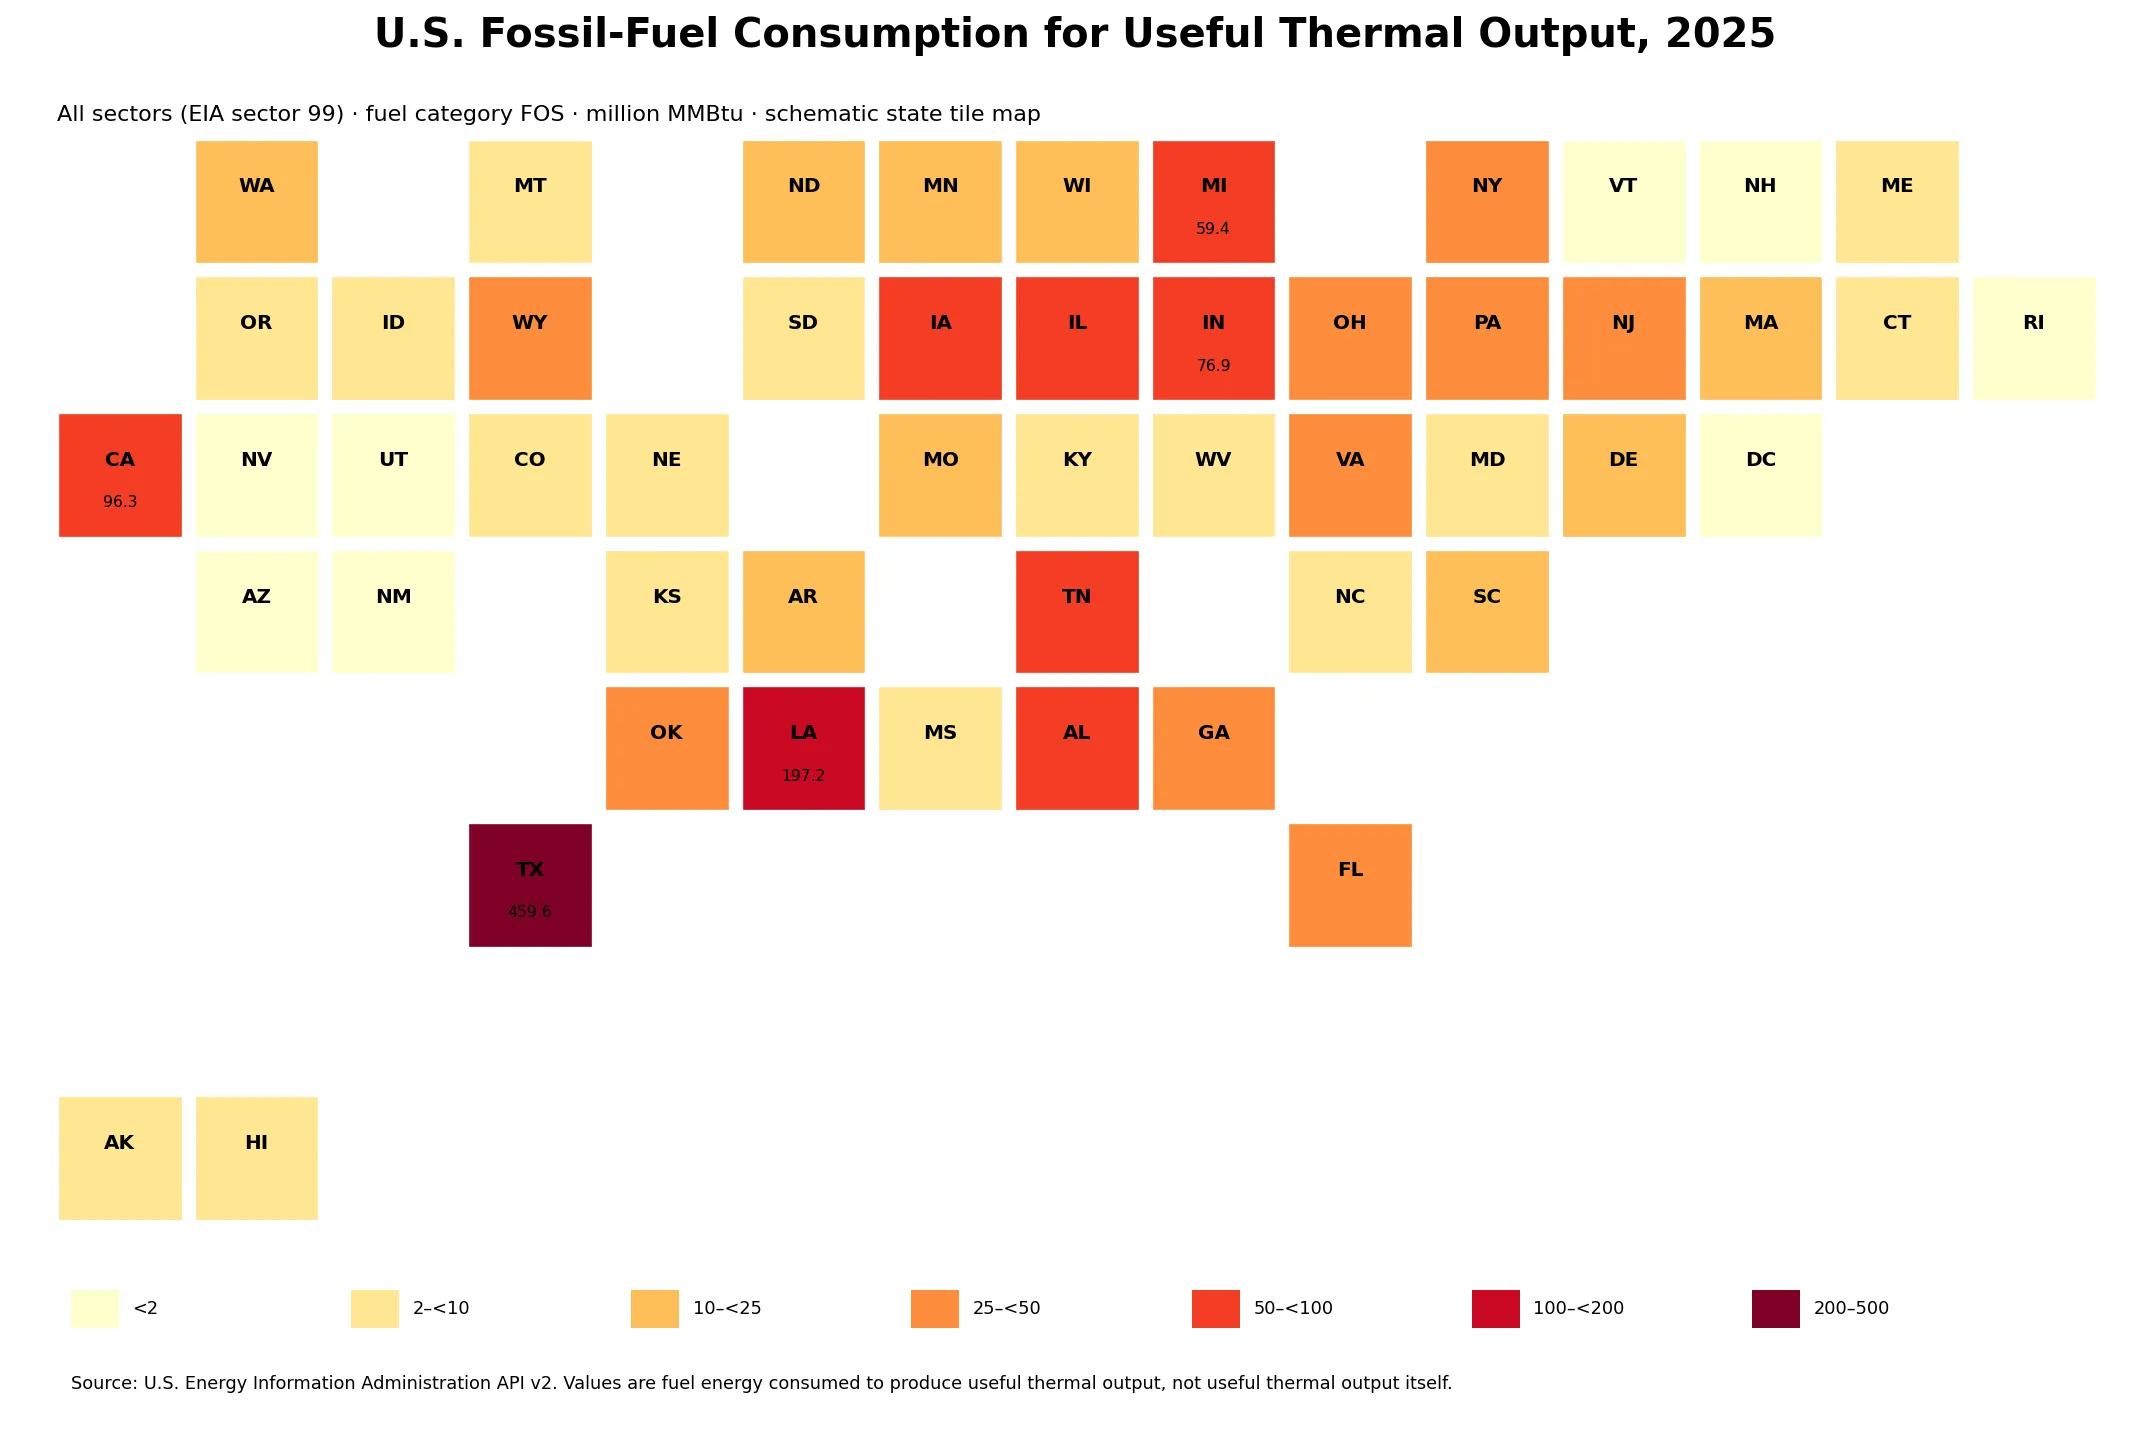
Table of Contents
The metric measures fuel input, not useful thermal output itself
The distinction between input and output matters. In a CHP system, one fuel stream can support both electricity generation and useful heat. The useful heat may be steam for an industrial process, space heating, hot water, cooling, or another thermal service. EIA’s field name for this series is consumption-uto-btu. It records fuel consumption associated with useful thermal output, expressed on an energy basis, rather than the useful heat delivered to the final user. Treating the input value as if it were thermal output would blur an important efficiency boundary.
The fuel filter is FOS, an aggregate fossil-fuel category rather than a single fuel. This dataset alone cannot tell us how much of a state’s value came from natural gas, coal, petroleum liquids, or another fossil component. The sector filter is also broad: sector 99 corresponds to Total (all sectors) in the EIA operational dataset. The resulting value should therefore be read as a broad state total within this EIA series, not as an Electric Utility-only statistic.
Why this is not a duplicate of the Electric Utility useful-thermal-output article
A related 2025 state article uses Electric Utility + all fuels (ALL). That narrower series sums to about 80.069 million MMBtu across the same 51 jurisdictions, and more than half of the jurisdictions report zero in that specific utility series. This article uses Total (all sectors) + fossil fuels (FOS). All 51 jurisdictions have positive values here, and the total is 1,679.590 million MMBtu. The filters describe different populations and different fuel scope, so the two series answer different questions even though both contain the phrase “useful thermal output.”
The rankings reinforce the distinction. Alabama leads the Electric Utility + all-fuels series, while Texas dominates the all-sector fossil-fuel series. That is not a contradiction. It reflects the fact that broadening sector coverage and changing the fuel filter changes what is being counted. For similarly named EIA metrics, checking the year is not enough; the fuel type and sector dimensions are part of the metric identity and should be preserved in the title and interpretation.
Texas and Louisiana accounted for 39.1% of the 51-jurisdiction total
Texas records 459.561 million MMBtu, equal to about 27.4% of the summed state-and-D.C. observations. Louisiana contributes 197.175 million MMBtu, or about 11.7%. Their combined value is 656.736 million MMBtu and their combined share is 39.1%. Adding California and Indiana brings the top-four share to 49.4%; the top five reach 52.9%, and the top ten reach 67.9%.
| Rank | State | 2025 value (million MMBtu) | Share of 51-jurisdiction total |
|---|---|---|---|
| 1 | Texas | 459.561 | 27.4% |
| 2 | Louisiana | 197.175 | 11.7% |
| 3 | California | 96.274 | 5.7% |
| 4 | Indiana | 76.909 | 4.6% |
| 5 | Michigan | 59.368 | 3.5% |
| 6 | Alabama | 54.721 | 3.3% |
| 7 | Illinois | 53.568 | 3.2% |
| 8 | Iowa | 52.310 | 3.1% |
| 9 | Tennessee | 50.117 | 3.0% |
| 10 | Pennsylvania | 41.066 | 2.4% |
| 11 | New York | 40.573 | 2.4% |
| 12 | Ohio | 39.428 | 2.3% |
| 13 | Virginia | 36.012 | 2.1% |
| 14 | New Jersey | 34.082 | 2.0% |
| 15 | Florida | 31.190 | 1.9% |
After Texas and Louisiana, California records 96.274 million MMBtu, Indiana 76.909, and Michigan 59.368. Alabama, Illinois, Iowa, and Tennessee are all slightly above 50 million MMBtu. Pennsylvania is 41.066, New York 40.573, and Ohio 39.428. High observations occur in several parts of the country rather than forming a simple one-region cluster, so the state ranking should not be reduced to a single geographic story without plant-level or industry-level evidence.
The median of 11.5 million MMBtu is more representative than the mean of 32.9
The arithmetic mean across 51 jurisdictions is 32.933 million MMBtu, while the median is only 11.458. The mean is almost three times the median because the largest values, especially Texas and Louisiana, pull it upward. The first quartile is 5.366 and the third quartile is 35.047 million MMBtu, meaning the middle half of jurisdictions lies roughly between 5.4 and 35.0.
The distribution is also clear in bins. Eight jurisdictions are below 2 million MMBtu, 16 are between 2 and 10, nine are between 10 and 25, nine are between 25 and 50, and seven are between 50 and 100. Louisiana is the only state between 100 and 200, while Texas is the only state above 200. Most jurisdictions are therefore well below 100 million MMBtu, with two large observations creating a long upper tail.
Every state and D.C. has a reported positive value
The 2025 file contains all 50 states plus the District of Columbia, with no missing rows. Vermont is the smallest observation at 0.079 million MMBtu. The District of Columbia is 0.334, Utah 0.545, New Mexico 0.739, and New Hampshire 0.777. Rhode Island is 1.038, Arizona 1.392, and Nevada 1.888. These small numbers are still positive reported observations and are not converted to zero in the calculations or map.
That distinction matters because “small,” “zero,” and “missing” are different data states. A small value means EIA reports a measurable amount under this exact combination of year, sector, fuel group, and metric. It does not mean CHP is unimportant in the state overall, because CHP using renewable or other non-fossil fuels would not be represented in the FOS total. Nor does it say anything about useful-heat output per unit of input.
Absolute fuel consumption is not an efficiency or dependence ranking
Texas ranking first should not be restated as “Texas depends most on CHP” or “Texas has the least efficient CHP.” The series has no denominator. A dependence measure would require something such as total CHP fuel input, total state energy consumption, or another appropriate baseline. An efficiency measure would require useful thermal output and electricity output to be related to the corresponding fuel input over a consistent plant population. The present series supplies only one side of that relationship.
State size also complicates interpretation. A state with many industrial facilities and CHP units can have a large absolute value because more equipment is operating, not because each unit is unusually fuel intensive. Conversely, a small state can have a low total while still using CHP effectively in the facilities that exist there. The safest use of this ranking is descriptive: it identifies where the reported fossil-fuel input associated with useful thermal output is largest under a consistent 2025 EIA definition.
The tile map shows concentration, not the location of individual CHP plants
The state tile map makes Texas and Louisiana visually distinct and places the other states into the same fixed value classes. Equal-size tiles reduce the visual bias that would come from giving geographically large states more map area. The tradeoff is that the figure is schematic: it is designed to compare state categories, not to reproduce boundaries or precise adjacency.
A state total also does not imply that activity is spread evenly across that state. CHP plants and thermal demand can be concentrated around a small number of industrial sites, refineries, campuses, district-energy systems, or other facilities. Plant-level EIA-923 data would be needed to locate those sources and to determine which facilities are driving a state total. The state comparison is therefore a useful first layer rather than a plant-location analysis.
Source and calculation method
The source is the U.S. Energy Information Administration API v2 Electric Power Operational Data. The comparison uses annual 2025 observations for consumption-uto-btu, with fueltypeid=FOS and sectorid=99. EIA’s electricity glossary defines useful thermal output as thermal energy made available from a CHP system for processes, heating, cooling, or other end uses rather than electricity generation.
The total, mean, median, quartiles, state shares, and concentration percentages are calculated directly from the 51 state-and-D.C. observations. No older year is substituted, no missing value is filled with zero, and small positive observations remain positive. The EIA-provided unit, million MMBtu, is retained as supplied. Comparisons with tables published in billion Btu or with physical fuel units require an explicit unit conversion and should not be made by matching the raw numbers alone.
The main pattern is concentration in all-sector fossil-fuel input
The 2025 all-sector fossil-fuel series is concentrated at the top. Texas alone represents about 27.4% of the summed 51 observations; Texas and Louisiana together represent 39.1%; and the top ten account for 67.9%. At the same time, the median is only 11.458 million MMBtu, far below the mean, showing that the typical state is much smaller than the leading observations.
Three boundaries keep the result interpretable. The metric is fuel input associated with useful thermal output, not useful thermal output itself. It covers Total (all sectors), not only Electric Utilities. And it is an absolute quantity, not a measure of efficiency or dependence. Preserving those distinctions makes the state ranking useful without turning a narrow operational series into a broader claim that the data cannot support.
Frequently Asked Questions
Which state had the largest all-sector fossil-fuel consumption for useful thermal output in 2025?
Texas was highest at 459.561 million MMBtu, about 27.4% of the summed 50-state-and-D.C. observations. Louisiana was second at 197.175 million MMBtu.
Does consumption for useful thermal output equal the amount of useful heat produced?
No. This EIA series measures fuel energy consumed to produce useful thermal output. Useful thermal output itself is a separate output concept.
How is this different from the Electric Utility useful-thermal-output article?
The related article uses Electric Utility plus all fuels. This article uses Total (all sectors) plus the fossil-fuel aggregate FOS, so both the sector scope and fuel scope differ.
Does Texas ranking first mean it has the highest CHP fossil-fuel dependence or the lowest efficiency?
No. The series is an absolute input quantity. Dependence or efficiency requires additional denominators and output measures.
Related Articles
Green Map creates custom-edited map images using open geographic data sources such as geoBoundaries, Natural Earth, OpenStreetMap, and government open data.
These maps are edited visual materials, not raw data files, and are provided for education, documents, presentations, and graphic reference.