Moderate or severe food insecurity varies enormously across the economies reporting a 2023 value in World Bank series SN.ITK.MSFI.ZS. The supplied country master contains 217 economies, but only 134 have a 2023 observation; 83 are explicitly missing. Among the reported values, Sierra Leone is highest at 89.8% and Belarus is lowest at 1.1%. The unweighted mean is 29.62%, while the median is 22.55%, a gap that reflects the long upper tail of very high-prevalence observations.
This indicator is broader than a count of people who are literally going hungry at a particular moment. It measures the share of the population living in households classified as moderately or severely food insecure. Moderate food insecurity can involve deteriorating diet quality and having to reduce the quantity of food because money or other resources are insufficient. Severe food insecurity represents a more intense restriction on food access. The metric is therefore best understood as an experience-based measure of constrained access to adequate food, not as a direct measure of crop output, calories produced, or the poverty rate.
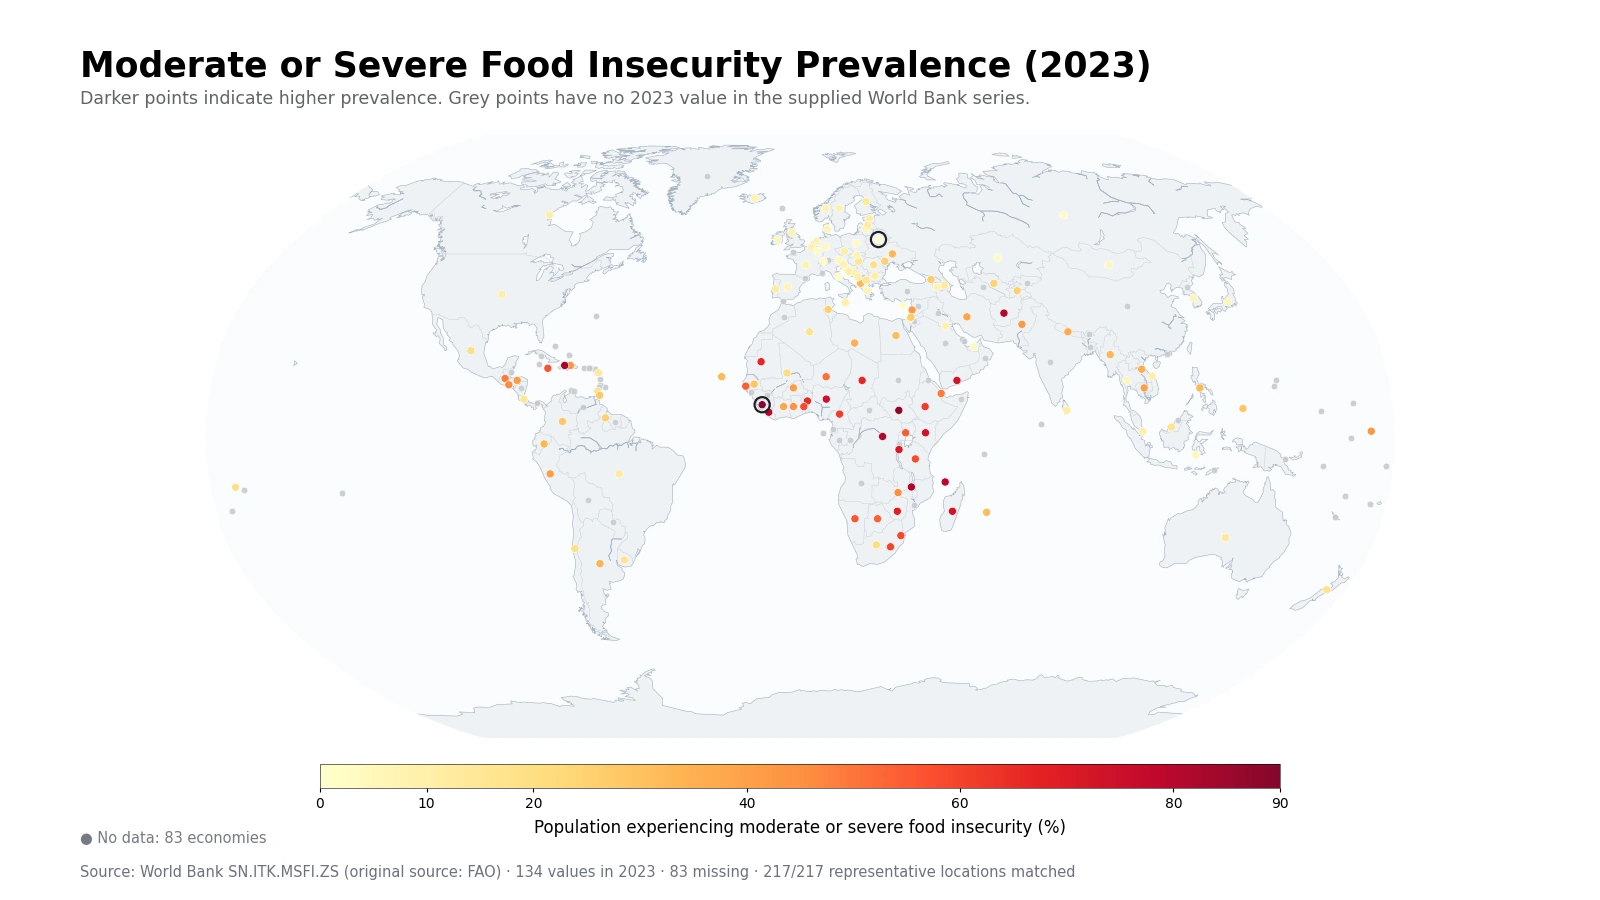
Table of Contents
What the food insecurity indicator actually measures
The World Bank series is sourced from the Food and Agriculture Organization of the United Nations (FAO) and is based on the Food Insecurity Experience Scale, or FIES, and compatible experience-based instruments. FIES uses people’s direct responses to questions about difficulties accessing food because of a lack of money or other resources. The questions cover a severity spectrum, from worrying about food and compromising diet quality to cutting portions, skipping meals, and, at the severe end, going without food for an extended period.
A country value of 40% therefore does not mean that 40% of residents were continuously hungry. It means that about 40% of the population lived in households whose reported experiences placed them at or above the internationally calibrated moderate-food-insecurity threshold. That distinction matters because moderate food insecurity includes people who may still eat regularly but cannot reliably maintain adequate diet quality or quantity. Severe food insecurity is nested within the moderate-or-severe measure, so the headline percentage includes both severity classes.
There is also an important timing detail. World Bank metadata states that the internationally comparable indicator is calculated as a three-year average. The observation labeled 2023 should therefore not be read as a one-day, one-month, or single-survey snapshot. It is a smoothed annual estimate designed for international comparison. That makes the series more stable, but it also means the 2023 label should not be used to attribute the value to one event that occurred only during that calendar year.
The highest reported prevalence is concentrated in several African economies, with major outliers elsewhere
The top ten reported values are Sierra Leone at 89.8%, South Sudan at 88.1%, Haiti at 83.2%, Malawi at 81.7%, the Democratic Republic of the Congo at 81.5%, Afghanistan at 80.8%, Liberia at 80.8%, Comoros at 79.7%, Nigeria at 74.8%, and Kenya at 73.9%. Much of the upper end is concentrated in sub-Saharan Africa, especially across western, central, and eastern parts of the continent. Haiti and Afghanistan show that very high prevalence is not confined to one region.
The gap between the highest and lowest observations is 88.7 percentage points. Sierra Leone’s reported prevalence is about 81.6 times the Belarus value. That ratio describes percentages, not numbers of affected people. A populous country with a lower percentage can still contain more food-insecure people than a small country with a higher rate. Estimating headcounts requires combining prevalence with population totals and using the correct reference period.
| Top rank | Economy | Prevalence | Bottom rank | Economy | Prevalence |
|---|---|---|---|---|---|
| 1 | Sierra Leone | 89.8% | 1 | Belarus | 1.1% |
| 2 | South Sudan | 88.1% | 2 | Cyprus | 1.4% |
| 3 | Haiti | 83.2% | 3 | Italy | 1.7% |
| 4 | Malawi | 81.7% | 4 | Switzerland | 2.0% |
| 5 | Congo, Dem. Rep. | 81.5% | 5 | Kazakhstan | 2.0% |
| 6 | Afghanistan | 80.8% | 6 | Luxembourg | 2.6% |
| 7 | Liberia | 80.8% | 7 | Russian Federation | 2.8% |
| 8 | Comoros | 79.7% | 8 | Poland | 3.4% |
| 9 | Nigeria | 74.8% | 9 | United Arab Emirates | 3.6% |
| 10 | Kenya | 73.9% | 10 | Germany | 4.1% |
Low reported values cluster in Europe and parts of Asia, but regional labels are not enough
The ten lowest values are Belarus 1.1%, Cyprus 1.4%, Italy 1.7%, Switzerland 2.0%, Kazakhstan 2.0%, Luxembourg 2.6%, the Russian Federation 2.8%, Poland 3.4%, the United Arab Emirates 3.6%, and Germany 4.1%. Europe dominates this list, but Kazakhstan and the United Arab Emirates show that low prevalence is not uniquely European. France is at 8.4% and Spain at 6.5%, demonstrating that even among relatively low-prevalence European economies there is meaningful variation.
Several East and Southeast Asian observations are also low in the supplied 2023 dataset: the Republic of Korea is 5.4%, Japan 5.8%, Mongolia 4.8%, Indonesia 4.5%, and Thailand 5.4%. China and India have no 2023 value in the supplied series, so they cannot be placed on the same ranking. Treating a missing row as zero would falsely imply the absence of food insecurity and would distort both the map and any regional average.
Large geographic clusters coexist with sharp differences between neighbors
West Africa provides a clear example. Sierra Leone is at 89.8% and Liberia at 80.8%, while Ghana is 44.5% and Côte d’Ivoire 38.4%. Those countries occupy the same broad region but span more than 50 percentage points. In East Africa, Kenya is 73.9%, Ethiopia 61.4%, Tanzania 58.0%, and Uganda 54.6%. The map is useful for seeing a broad high-prevalence belt, but country-level values are still essential because the cluster is far from uniform.
Neighboring contrasts appear elsewhere. Haiti is 83.2% compared with 43.8% in the Dominican Republic. Afghanistan is 80.8%, Pakistan 42.1%, and Iran 38.8%. In eastern Europe and the Baltic area, Belarus is 1.1%, Poland 3.4%, Lithuania 6.5%, Latvia 11.2%, and Ukraine 32.5%. The indicator alone cannot establish why these gaps exist, but it identifies where follow-up work with income, food prices, social protection, conflict, climate, and agricultural data may be most informative.
The median gives a better sense of the center than the mean alone
Across the 134 reported values, the unweighted mean is 29.62% and the median is 22.55%. The first quartile is 9.20% and the third quartile is 44.33%, so the middle half of reporting economies lies between roughly 9% and 44%. The higher mean reflects a long upper tail: nineteen economies are at 60% or more, and several exceed 80%. A single average therefore does not describe a typical reporting economy particularly well.
| Prevalence band | Economies | Share of 134 reported values |
|---|---|---|
| Below 10% | 38 | 28.4% |
| 10% to under 20% | 27 | 20.1% |
| 20% to under 40% | 27 | 20.1% |
| 40% to under 60% | 23 | 17.2% |
| 60% or more | 19 | 14.2% |
Thirty-eight economies are below 10%, 27 are between 10% and 20%, another 27 are between 20% and 40%, 23 are between 40% and 60%, and 19 are at 60% or above. The distribution is broad rather than tightly centered. This is why the world map and the band table complement each other: the map shows geographic concentration, while the table shows how many reporting economies occupy each severity range.
Grey points are missing data, not zero food insecurity
The source file retains all 217 World Bank country-and-economy rows. Eighty-three do not have a 2023 value and are preserved as missing. In the map those locations are grey. A grey point should never be interpreted as 0%. This is especially important because some large economies are among the missing rows; assigning zero would create an artificially low global picture and could reverse regional comparisons.
The coverage gap also limits what can be inferred from the 29.62% mean. It is a simple average across the 134 reporting economies, not a population-weighted global prevalence estimate. Because major population centers are missing from this particular 2023 cross-section, the mean cannot be described as the share of the world’s population experiencing food insecurity. A global headcount or global prevalence rate should come from FAO’s official aggregated estimates, which use the appropriate coverage and weighting methods.
What the indicator can and cannot tell you
The series is well suited to comparing the breadth of food-access difficulties across countries, locating regional clusters, identifying outliers, and deciding where to investigate further. Used alongside other official indicators, it can support questions about the relationship between food insecurity and household income, food prices, agricultural conditions, social protection, displacement, or climate shocks. The geographic pattern is especially useful because similar prevalence can appear in economies with very different economic structures and very different food systems.
The indicator does not, by itself, identify the cause of food insecurity. It is not a direct measure of undernourishment, child stunting, food inflation, farm production, or poverty, although those subjects may be related. It also does not tell us how food insecurity is distributed within a country by region, income, age, or sex. National averages can hide substantial internal inequality, so subnational surveys and demographic breakdowns are needed when the question is about who is most affected or where within a country the problem is concentrated.
Source and calculation notes
The analysis uses the World Bank indicator SN.ITK.MSFI.ZS, whose original source is FAO. FAO explains the experience-based methodology in its Food Insecurity Experience Scale overview. Rankings, quartiles, the mean, the median, the range, and the distribution bands in this article are calculated directly from the 134 non-missing 2023 observations in the supplied dataset.
No missing observation is converted to zero and no earlier year is substituted for 2023. The map places all 217 reporting economies at representative geographic points, colors the 134 valid observations by prevalence, and leaves the 83 missing rows grey. The map, tables, and narrative statistics therefore use one consistent 2023 data basis.
Frequently Asked Questions
Does moderate or severe food insecurity simply mean hunger?
No. Moderate food insecurity includes compromised diet quality and, at greater severity, reductions in the quantity of food because money or other resources are insufficient. Severe food insecurity represents more extreme constraints on access to food.
Is the 2023 value a single-year survey snapshot?
Not exactly. World Bank metadata states that the internationally comparable indicator is calculated as a three-year average, so the 2023 observation should be read as a smoothed estimate rather than a one-time survey snapshot.
Should economies with no 2023 value be treated as 0%?
No. Missing means that a comparable 2023 value is not available in this dataset. The 83 missing rows are kept separate, shown in grey on the map, and excluded from rankings and summary statistics.
Related Maps
Green Map creates custom-edited map images using open geographic data sources such as geoBoundaries, Natural Earth, OpenStreetMap, and government open data.
These maps are edited visual materials, not raw data files, and are provided for education, documents, presentations, and graphic reference.