How similar is the share of tertiary graduates from STEM programmes among women and men? UNESCO Institute for Statistics indicator FOSGP.5T8.F500600700.GPIA is the adjusted gender parity index (GPIA) for the percentage of tertiary graduates from Science, Technology, Engineering and Mathematics programmes.
Among the 100 country and area observations dated 2023, 99 have a lower STEM share among female graduates than among male graduates. Only 1 observation is above 1, and none lies within the 0.97–1.03 parity band. The median GPIA is 0.402 and the mean is 0.421.
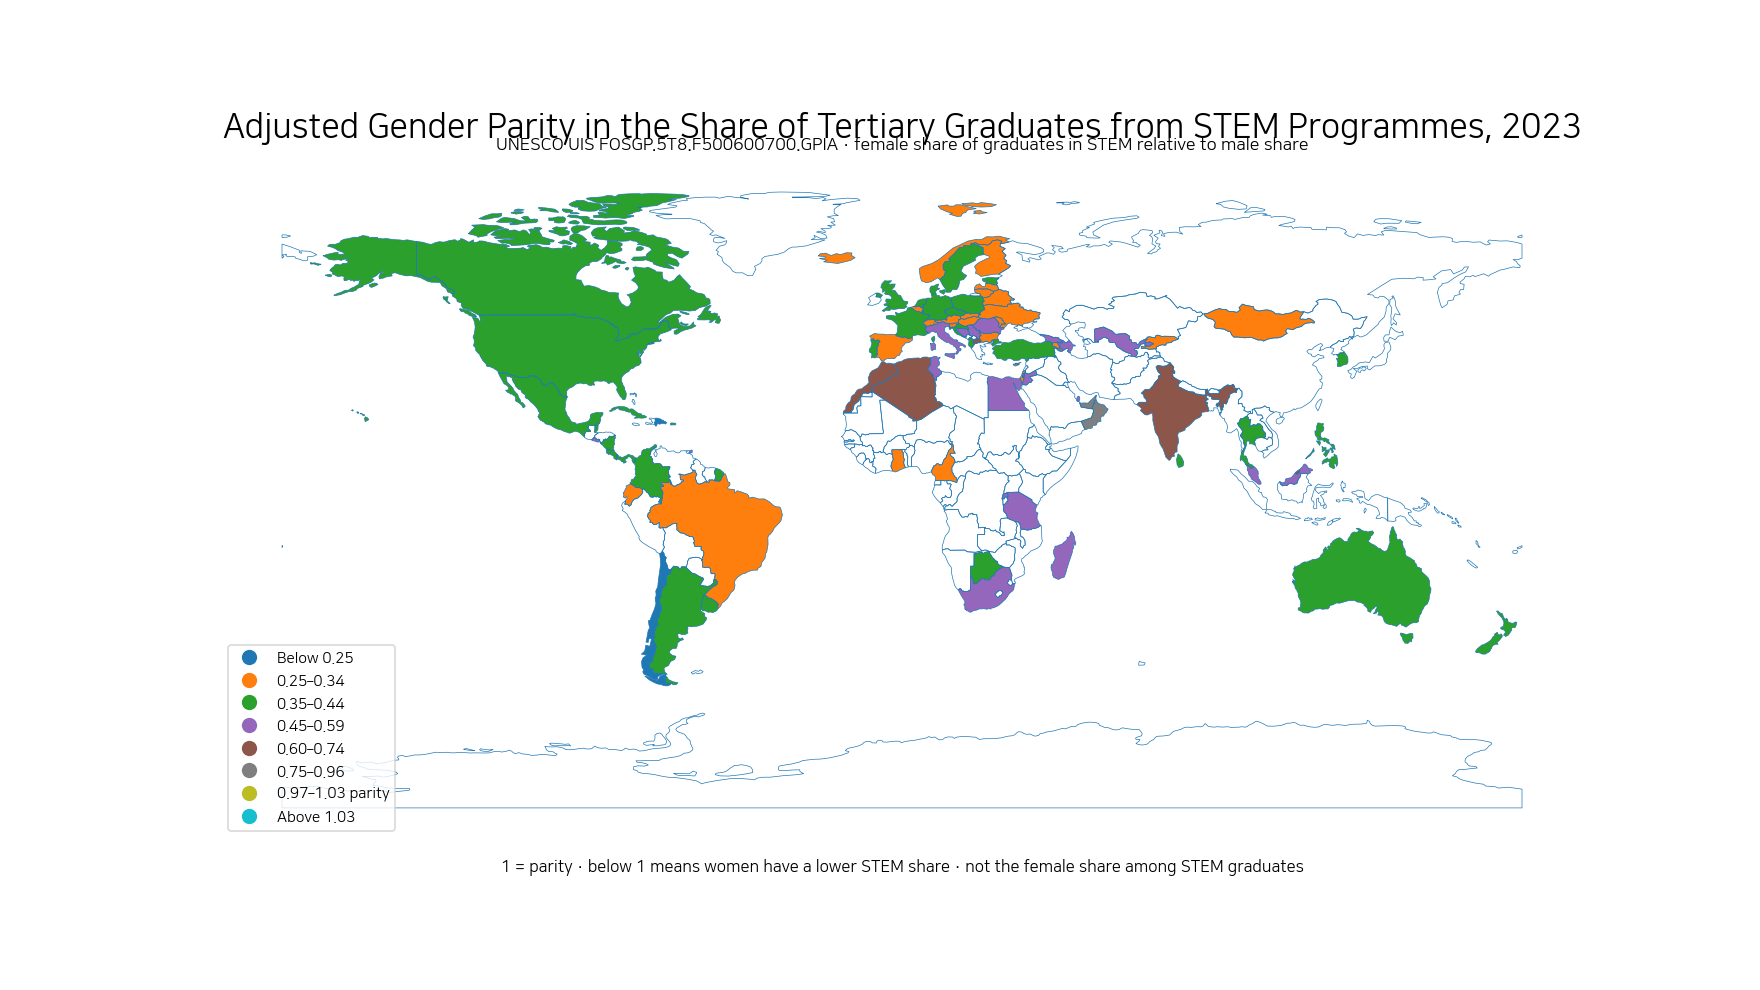
Table of Contents
This is not the female share among STEM graduates
The distinction is fundamental. This indicator does not ask what percentage of all STEM graduates are women. Instead, it first calculates the percentage of female tertiary graduates who graduated from STEM programmes and compares that with the percentage among male tertiary graduates.
If 20% of female graduates are from STEM programmes and 40% of male graduates are from STEM programmes, the female STEM share is lower. The number of female STEM graduates could still be higher or lower depending on the total number of female and male graduates.
The underlying measure describes the field distribution of tertiary graduates
UIS defines the percentage of graduates by field of education as the number of graduates from a field divided by the total number of tertiary graduates. STEM aggregates the relevant science, technology, engineering and mathematics programme fields.
The parity index therefore describes how similarly women and men are distributed into STEM at graduation. It is not a direct measure of tertiary participation, employment in STEM occupations, earnings, research output or education quality.
GPIA is a 0–2 adjusted index, not a percentage
The source metadata labels the unit as percent, but the published values are adjusted parity indices. UIS calculates parity from the indicator values for two groups and transforms ratios above 1 so that the adjusted index is symmetric around 1 and bounded between 0 and 2.
A value of 1 means the STEM share is equal among female and male graduates. Below 1 means the female STEM share is lower; above 1 means it is higher. A value of 0.4 does not mean women make up 40% of STEM graduates.
Women have a lower STEM share in 99 of the 100 observations
99 of the 100 observations are below 1 and only 1 is above 1. None falls inside the 0.97–1.03 parity band.
79 observations are below 0.50, 49 below 0.40 and 17 below 0.30. The pattern is therefore not a narrow cluster around parity; the female share of graduates in STEM is substantially lower than the male share in many reporting systems.
The United Arab Emirates, Oman and India are closest to parity among the main cluster
Excluding the isolated Cook Islands value, the observations closest to 1 are the United Arab Emirates at 0.793, Oman 0.766 and India 0.733. Algeria is 0.690, Morocco 0.619, North Macedonia 0.616 and Brunei Darussalam 0.615.
Even the United Arab Emirates remains below the 0.97–1.03 parity band. In this 2023 dataset, no observation falls inside the practical parity range.
| Country or area | ISO3 | GPIA | Interpretation |
|---|---|---|---|
| United Arab Emirates | ARE | 0.793 | Women have lower STEM share |
| Oman | OMN | 0.766 | Women have lower STEM share |
| India | IND | 0.733 | Women have lower STEM share |
| Algeria | DZA | 0.690 | Women have lower STEM share |
| Morocco | MAR | 0.619 | Women have lower STEM share |
| North Macedonia | MKD | 0.616 | Women have lower STEM share |
| Brunei Darussalam | BRN | 0.615 | Women have lower STEM share |
| Tunisia | TUN | 0.585 | Women have lower STEM share |
| Samoa | WSM | 0.580 | Women have lower STEM share |
| El Salvador | SLV | 0.576 | Women have lower STEM share |
| Rwanda | RWA | 0.572 | Women have lower STEM share |
| Serbia | SRB | 0.549 | Women have lower STEM share |
Major economies are mostly in the 0.3–0.5 range
The United States is 0.418, Canada 0.414, France 0.391, the United Kingdom 0.390, Germany 0.371, Sweden 0.374, Australia 0.350 and Finland 0.312.
Italy is 0.474, New Zealand 0.427, Singapore 0.422 and South Africa 0.541. The Republic of Korea appears in the comparison table as one ordinary observation rather than a focal case because the global country-focus contract does not identify it as materially notable.
| Country | GPIA | Female vs male STEM-graduate share |
|---|---|---|
| India | 0.733 | Women have lower STEM share |
| South Africa | 0.541 | Women have lower STEM share |
| Italy | 0.474 | Women have lower STEM share |
| New Zealand | 0.427 | Women have lower STEM share |
| Singapore | 0.422 | Women have lower STEM share |
| United States | 0.418 | Women have lower STEM share |
| Canada | 0.414 | Women have lower STEM share |
| Mexico | 0.401 | Women have lower STEM share |
| France | 0.391 | Women have lower STEM share |
| United Kingdom | 0.390 | Women have lower STEM share |
| Sweden | 0.374 | Women have lower STEM share |
| Germany | 0.371 | Women have lower STEM share |
| Republic of Korea | 0.356 | Women have lower STEM share |
| Australia | 0.350 | Women have lower STEM share |
| Finland | 0.312 | Women have lower STEM share |
| Brazil | 0.299 | Women have lower STEM share |
| Spain | 0.280 | Women have lower STEM share |
The Cook Islands are the only observation above 1
The Cook Islands record 2.000, the only observation above 1 in this dataset. That places the adjusted index at its upper bound on the female-higher side.
A value of 2.000 does not mean the female STEM share is exactly twice the male share. The adjusted formula is not a direct multiplier, and a small denominator or a very low underlying share for one sex can create an extreme parity index.
The lowest values are below 0.20
The Turks and Caicos Islands record the minimum at 0.051. Bermuda is 0.102, Andorra 0.173, Saint Lucia 0.173, Chile 0.199 and the Dominican Republic 0.199.
Latvia, Lithuania, Kyrgyzstan, Hungary, Belgium and Spain are also around 0.30 or below. These values indicate a much lower STEM share among female graduates than among male graduates; they do not measure the absolute number of female STEM graduates.
| Low-GPIA country or area | ISO3 | GPIA |
|---|---|---|
| Turks and Caicos Islands | TCA | 0.051 |
| Bermuda | BMU | 0.102 |
| Andorra | AND | 0.172 |
| Saint Lucia | LCA | 0.173 |
| Chile | CHL | 0.199 |
| Dominican Republic | DOM | 0.199 |
| Latvia | LVA | 0.256 |
| Lithuania | LTU | 0.263 |
| Kyrgyzstan | KGZ | 0.263 |
| Hungary | HUN | 0.266 |
| Belgium | BEL | 0.272 |
| Spain | ESP | 0.280 |
This answers a different question from the female share of STEM graduates
A female-share-of-STEM-graduates indicator uses all STEM graduates as the denominator and asks what percentage are women. The current GPIA instead compares the STEM share within female graduates with the STEM share within male graduates.
The two measures can move differently. If women make up a large majority of all tertiary graduates but choose STEM less often than men, the female share among STEM graduates could still be substantial even while GPIA remains below 1.
Cross-country comparisons depend on consistent field classification
UIS notes that international comparisons of graduates by field depend heavily on consistent field definitions and complete reporting. Exclusions, double counting, partial coverage and differences in programme duration or content can affect comparability.
For that reason, small differences such as 0.39 versus 0.41 should not be treated as precise rankings of education systems. Larger structural gaps across broad GPIA ranges are more informative.
A higher STEM share is not a complete education-quality score
A high STEM share means STEM occupies a larger part of the graduate field distribution. It does not automatically imply better education quality, stronger employment outcomes, higher research productivity or a more innovative economy.
Countries differ in industrial structure and in the size of health, education, business, humanities and social-science programmes. The indicator is useful for gender differences in field distribution, not as a single ranking of higher-education performance.
The mean of 0.421 is not a world population-weighted gender gap
The simple mean across the 100 observations is 0.421 and the median is 0.402. Every country or area receives equal weight regardless of graduate population.
It would be incorrect to say that women worldwide have a STEM-graduate share equal to 42.1% of men’s based on this mean. A global weighted comparison would require female and male graduate counts and STEM-graduate counts by country.
Blank map areas do not mean zero
The source table contains 100 country and area observations, of which 87 match separate polygons in the low-resolution world boundary layer used here. Small islands and territories can have valid statistics without a visible polygon.
Countries without a 2023 observation remain unclassified. Missing values are never replaced with zero because zero would falsely imply an extreme gender disparity.
Data source and interpretation
Country values come from the UNESCO UIS Data Browser for FOSGP.5T8.F500600700.GPIA, using the 2023 observations. The underlying graduate-field percentage follows the UIS Distribution of graduates in tertiary education by field of education definition.
Adjusted gender-parity interpretation follows the UIS parity-indices methodology. The source metadata unit is corrected from percent to adjusted GPIA, and the package provider tag is corrected from World Bank to UNESCO UIS.
Frequently Asked Questions
Does a GPIA of 0.4 mean women are 40% of STEM graduates?
No. GPIA compares the share of female tertiary graduates from STEM programmes with the corresponding share among male graduates.
What does a GPIA of 1 mean?
It means STEM accounts for the same share of female tertiary graduates as of male tertiary graduates.
What does a GPIA below 1 mean?
It means STEM represents a smaller share of female tertiary graduates than of male tertiary graduates.
Is this the female share among all STEM graduates?
No. It compares the field distribution within female graduates and within male graduates rather than using all STEM graduates as the denominator.
Related Maps
Green Map creates custom-edited map images using open geographic data sources such as geoBoundaries, Natural Earth, OpenStreetMap, and government open data.
These maps are edited visual materials, not raw data files, and are provided for education, documents, presentations, and graphic reference.