The share of tertiary graduates completing Information and Communication Technologies (ICT) programmes varies substantially across the 98 countries and territories with a 2023 UNESCO Institute for Statistics (UIS) observation. Brunei Darussalam is highest at 17.19%, followed by Tunisia at 14.86%, Mauritius at 11.67%, Andorra at 11.41%, and Singapore at 10.83%. The median is 5.63%.
This is a composition measure among graduates, not a percentage of the total population with an ICT degree. The denominator is all tertiary graduates represented in 2023 and the numerator is the subset graduating from ICT programmes. UIS defines tertiary education as ISCED levels 5 through 8, covering short-cycle tertiary through bachelor’s, master’s, and doctoral levels. A value of 8% therefore means that about eight of every 100 tertiary graduates in the observation completed an ICT-field programme.
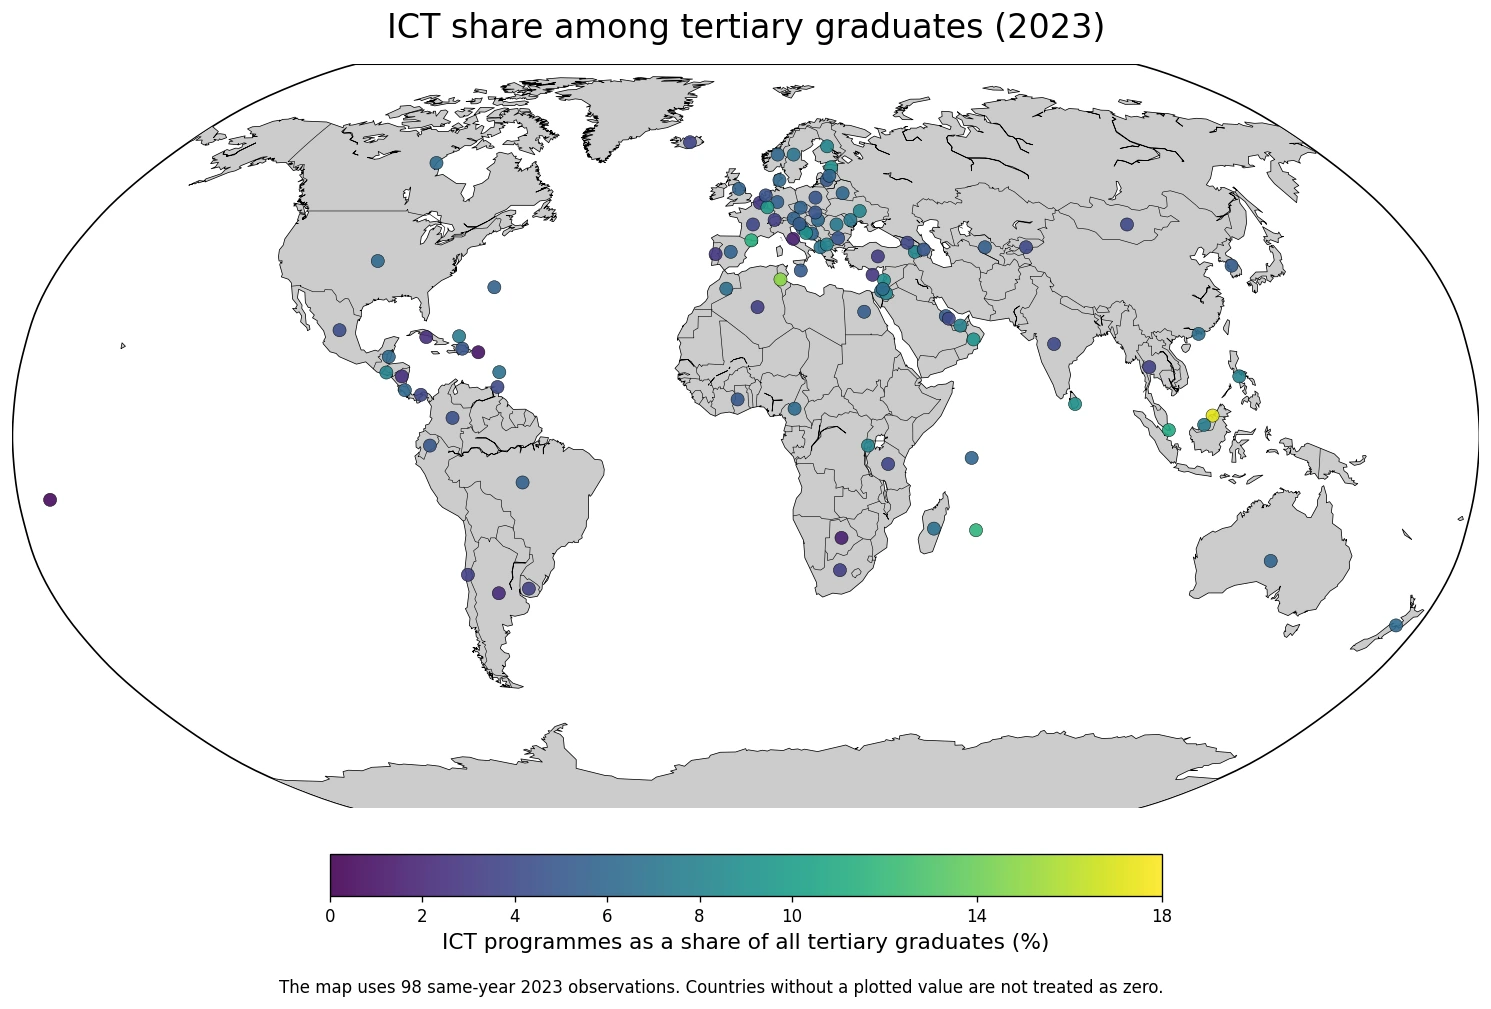
Table of Contents
Brunei Darussalam and Tunisia stand out at the top
Brunei Darussalam is the only observation above 15%, at 17.19%. Tunisia follows at 14.86%. Mauritius is at 11.67%, Andorra 11.41%, and Singapore 10.83%, making five observations at or above 10%. Luxembourg, Oman, Sri Lanka, Serbia, and Estonia occupy the next positions, all between roughly 9% and 10%.
| Rank | Country or territory | ICT share of tertiary graduates |
|---|---|---|
| 1 | Brunei Darussalam | 17.19% |
| 2 | Tunisia | 14.86% |
| 3 | Mauritius | 11.67% |
| 4 | Andorra | 11.41% |
| 5 | Singapore | 10.83% |
| 6 | Luxembourg | 9.68% |
| 7 | Oman | 9.31% |
| 8 | Sri Lanka | 9.15% |
| 9 | Serbia | 9.09% |
| 10 | Estonia | 8.98% |
| 11 | Lebanon | 8.85% |
| 12 | Armenia | 8.42% |
| 13 | Finland | 8.34% |
| 14 | Jordan | 8.26% |
| 15 | Rwanda | 8.20% |
The high end is geographically diverse. Southeast Asia, North Africa, the Indian Ocean, Europe, and Western Asia all contribute top observations. That diversity makes a simple regional explanation insufficient. The dataset shows where the graduate-field share is high, but it does not establish why tertiary systems produce different field mixes.
Most observations fall between 2% and 8%
30 observations fall between 4% and 5.99%, the largest band, while 24 are between 6% and 7.99%. 22 are between 2% and 3.99%, 13 between 8% and 9.99%, and only 5 are at least 10%. 4 observations are below 2%.
| ICT share of graduates | Countries or territories | Share of observations |
|---|---|---|
| Below 2% | 4 | 4.1% |
| 2–3.99% | 22 | 22.4% |
| 4–5.99% | 30 | 30.6% |
| 6–7.99% | 24 | 24.5% |
| 8–9.99% | 13 | 13.3% |
| 10% or more | 5 | 5.1% |
The mean is 5.86% and the median 5.63%. The middle half of the observations runs from 3.98% to 7.06%. Brunei and Tunisia pull the mean upward somewhat, but the central feature is that most country observations remain within a relatively compact 2–8% range.
ICT is a specific ISCED field, not a label for all STEM graduates
In UNESCO’s ISCED Fields of Education and Training 2013, ICT is broad field 06. It covers computer use, database and network design and administration, and software and applications development and analysis. The measure therefore extends beyond one narrowly defined computer-science degree.
Other technical fields are classified separately. Electronics and automation are placed under Engineering, Manufacturing and Construction, broad field 07, while Natural Sciences, Mathematics and Statistics are broad field 05. For that reason, FOSGP.5T8.F600 should not be relabelled as the share of all STEM graduates.
The lowest values do not prove a weak ICT workforce
Samoa is lowest at 0.54%, followed by Puerto Rico at 0.89%, Botswana at 1.54%, and Italy at 1.57%. Argentina is at 2.15%, Cuba 2.37%, Nicaragua 2.46%, Cyprus 2.78%, and Portugal 2.90%.
| Low-end order | Country or territory | ICT share of tertiary graduates |
|---|---|---|
| 1 | Samoa | 0.54% |
| 2 | Puerto Rico | 0.89% |
| 3 | Botswana | 1.54% |
| 4 | Italy | 1.57% |
| 5 | Argentina | 2.15% |
| 6 | Cuba | 2.37% |
| 7 | Nicaragua | 2.46% |
| 8 | Cyprus | 2.78% |
| 9 | Portugal | 2.90% |
| 10 | Belgium | 3.02% |
| 11 | Türkiye | 3.18% |
| 12 | Algeria | 3.34% |
| 13 | South Africa | 3.37% |
| 14 | Uruguay | 3.45% |
| 15 | Switzerland | 3.48% |
A low graduate share does not directly imply a small ICT workforce or a weak digital economy. The denominator is all tertiary graduates. A system with large cohorts in health, business, education, engineering, or other fields can have a lower ICT share even while producing many ICT graduates in absolute numbers. Counts are needed to answer the workforce-scale question.
A synchronized 2023 cross-section improves comparability
Field-of-study datasets often contain each country’s latest available observation from different years. This dataset is simpler to compare because all 98 rows are dated 2023. Cross-country differences are therefore not mixed with obvious reference-year differences in the way a latest-value table spanning many years would be.
Same-year coverage does not remove every comparability issue. National tertiary systems, programme structures, and reporting practices still differ, even when countries map programmes into the common ISCED-F framework. Large differences are more informative than treating a few tenths of a percentage point as an exact ranking of national education priorities.
Several large tertiary systems sit near the middle of the distribution
The United States records 6.18%, Canada 6.30%, the United Kingdom 5.81%, Australia 5.74%, and Germany 5.58%. The Republic of Korea is at 5.18%, slightly below the country-row median of 5.63%. India records 3.90% and France 3.83%.
These percentages should not be read as graduate counts. Two countries can have nearly identical shares but very different numbers of tertiary graduates overall, producing very different numbers of ICT graduates. A comparison of talent supply would require total graduates or ICT graduate counts alongside the percentage.
A larger ICT share is not a digital-competitiveness score
The indicator measures the field composition of tertiary graduation. It does not measure software-industry output, internet use, digital government, innovation, research performance, ICT employment, wages, or firm creation. A country with a 15% graduate share is therefore not automatically more digitally competitive than one with a 6% share.
The data also do not show whether graduates entered ICT occupations, moved into other industries, continued studying, or migrated abroad. Labour-market interpretation requires separate evidence such as employment by occupation, vacancy data, earnings, and migration. This dataset is best used to describe the education-system output mix by field.
The unweighted country mean is not a global graduate share
The simple average across the 98 observations is 5.86%, but that does not mean 5.86% of all tertiary graduates worldwide completed ICT programmes. Each country or territory contributes one observation regardless of how many graduates it has. A true global graduate share would need national graduate totals as weights.
An unweighted mean is useful for describing the distribution of country-level percentages, while the median indicates the middle observation. Those are different from a population- or graduate-weighted global statistic. Keeping that distinction prevents small and large tertiary systems from being treated as if they contributed the same number of graduates to a world total.
Data scope and source
The analysis uses 98 national-level 2023 observations from the UNESCO Institute for Statistics official API indicator FOSGP.5T8.F600. The official topic is the percentage of tertiary-education graduates completing Information and Communication Technologies programmes, both sexes combined. The unit is percent.
The map places each observation at a representative country or territory location. All statistical rows use the same 2023 reference year, and missing countries are not assigned zero. The mean of 5.86%, median of 5.63%, quartiles, bands, and rankings are calculated directly from the 98 supplied observations.
The main takeaway
Brunei Darussalam has the highest 2023 ICT share among tertiary graduates at 17.19%, followed by Tunisia at 14.86% and Mauritius at 11.67%. The median across the 98 available observations is 5.63%, and only 5 countries or territories are at or above 10%. Most observations fall between 2% and 8%. The measure is a same-year view of graduate field composition, not a direct ranking of digital-industry strength or ICT workforce size.
Frequently Asked Questions
What is the denominator of the ICT graduate share?
The denominator is all tertiary graduates represented in the country in 2023, and the numerator is graduates from ICT-field programmes.
Does ICT mean computer science only?
No. ISCED-F broad field 06 includes computer use, database and network design and administration, and software and applications development and analysis.
Does a higher ICT graduate share prove stronger digital competitiveness?
No. The indicator describes graduate field composition. Digital-industry output, employment, wages, innovation, and workforce size require separate measures.
Related Articles
Green Map creates custom-edited map images using open geographic data sources such as geoBoundaries, Natural Earth, OpenStreetMap, and government open data.
These maps are edited visual materials, not raw data files, and are provided for education, documents, presentations, and graphic reference.