A 2024 comparison of gross domestic product in current U.S. dollars shows how strongly global production is concentrated in a small number of very large economies. World Bank World Development Indicators series NY.GDP.MKTP.CD measures GDP at current prices and expresses the result in U.S. dollars. The supplied same-year dataset contains 183 country and area observations.
The United States is the largest observation at $29.18 trillion, followed by China at $18.74 trillion. Only 19 economies in the dataset exceed $1 trillion. The United States and China together account for 43.7% of the sum of the 183 observations, and the top ten account for 67.6%.
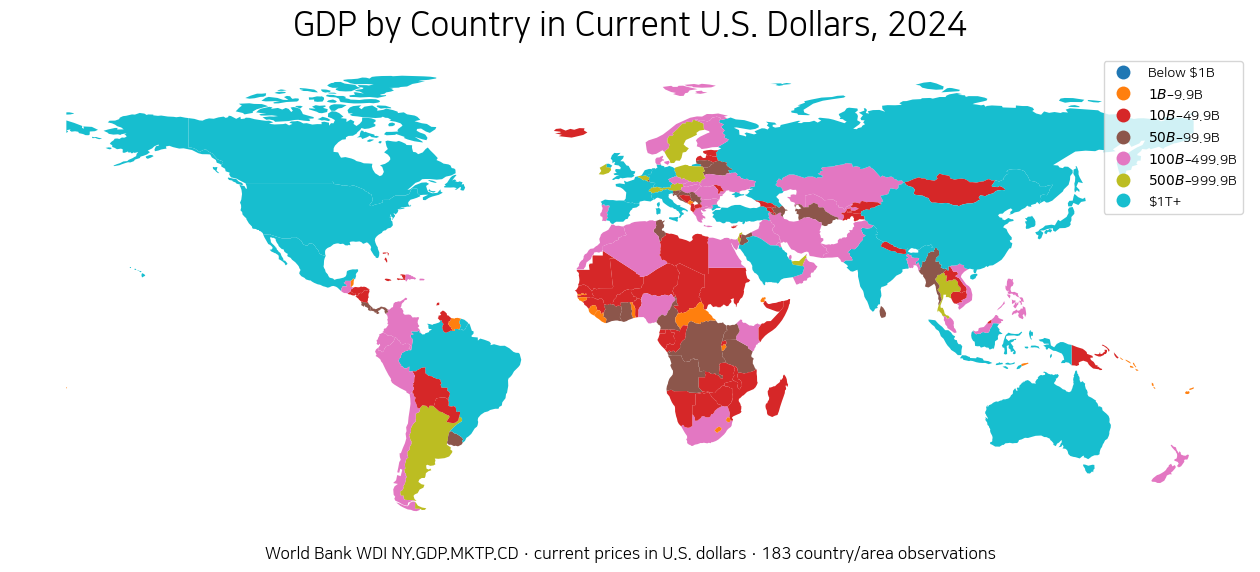
Table of Contents
Only 19 economies exceed $1 trillion in 2024 GDP
The $1 trillion threshold is not a measure of economic quality or living standards, but it is a useful way to see how few economies operate at the very top of the global production scale. The 19 observations above the threshold are the United States, China, Germany, Japan, India, the United Kingdom, France, Italy, Canada, Brazil, the Russian Federation, the Republic of Korea, Mexico, Australia, Spain, Indonesia, Türkiye, Saudi Arabia and the Netherlands.
Those 19 economies represent only a little over one-tenth of the 183 observed countries and areas, yet production is far more concentrated than the country count suggests. The top 20 observations alone account for 81.7% of the sum across the dataset.
The United States and China account for 43.7% of the observed sum
The United States has GDP of about $29.18 trillion and China about $18.74 trillion. Together they contribute roughly 47.93 trillion dollars, or 43.7% of the total obtained by summing the 183 country and area observations.
That percentage is deliberately described as a share of the observed dataset rather than an official share of a World Bank ‘World’ aggregate. The calculation uses the 183 country and area observations in this comparison and does not substitute a separate global aggregate series. This distinction avoids overstating coverage when some economies may be absent from a country-only extract.
Germany, Japan and India form the next tier around $4 trillion
Germany is about $4.66 trillion, Japan about $4.03 trillion and India about $3.91 trillion. The United Kingdom follows at roughly $3.64 trillion and France at $3.16 trillion. Italy, Canada, Brazil and the Russian Federation are in the $2 trillion range.
This is a ranking of nominal GDP in current U.S. dollars for one year. It is not a ranking of long-run real growth or household living standards. Because current-dollar GDP involves conversion from domestic currencies, exchange-rate movements can change dollar values and rankings even when domestic real production changes less.
| Rank | Country or area | ISO3 | 2024 GDP |
|---|---|---|---|
| 1 | United States | USA | $29.18 trillion |
| 2 | China | CHN | $18.74 trillion |
| 3 | Germany | DEU | $4.66 trillion |
| 4 | Japan | JPN | $4.03 trillion |
| 5 | India | IND | $3.91 trillion |
| 6 | United Kingdom | GBR | $3.64 trillion |
| 7 | France | FRA | $3.16 trillion |
| 8 | Italy | ITA | $2.37 trillion |
| 9 | Canada | CAN | $2.24 trillion |
| 10 | Brazil | BRA | $2.18 trillion |
| 11 | Russian Federation | RUS | $2.17 trillion |
| 12 | Republic of Korea | KOR | $1.88 trillion |
| 13 | Mexico | MEX | $1.85 trillion |
| 14 | Australia | AUS | $1.75 trillion |
| 15 | Spain | ESP | $1.72 trillion |
| 16 | Indonesia | IDN | $1.40 trillion |
| 17 | Türkiye | TUR | $1.32 trillion |
| 18 | Saudi Arabia | SAU | $1.24 trillion |
| 19 | Netherlands | NLD | $1.23 trillion |
| 20 | Switzerland | CHE | $936.6 billion |
The Republic of Korea is 12th at about $1.88 trillion
The Republic of Korea records about $1.88 trillion in 2024 GDP, placing it 12th among the 183 observations. The Russian Federation is just above it at about $2.17 trillion, while Mexico is just below it at about $1.85 trillion. Australia is about $1.75 trillion and Spain about $1.72 trillion.
A 12th-place total-GDP ranking indicates a large overall production base. It does not mean that the average resident ranks 12th in income or material living standards. Population size matters greatly for total GDP, which is why total GDP and GDP per capita answer different questions.
| Economy | 2024 rank | GDP |
|---|---|---|
| United States | 1 | $29.18 trillion |
| China | 2 | $18.74 trillion |
| Germany | 3 | $4.66 trillion |
| Japan | 4 | $4.03 trillion |
| India | 5 | $3.91 trillion |
| United Kingdom | 6 | $3.64 trillion |
| France | 7 | $3.16 trillion |
| Republic of Korea | 12 | $1.88 trillion |
| Mexico | 13 | $1.85 trillion |
| Australia | 14 | $1.75 trillion |
| Indonesia | 16 | $1.40 trillion |
| Saudi Arabia | 18 | $1.24 trillion |
Total GDP and GDP per capita produce different rankings
Total GDP measures the size of the entire economy. GDP per capita divides GDP by population to create an average scale-adjusted measure. Large-population countries such as China and India can rank very high in total GDP while appearing much lower in per-capita rankings. Small, high-income economies can show the opposite pattern.
The site’s 2025 GDP-per-capita article uses World Bank series NY.GDP.PCAP.CD, so reading it alongside this total-GDP comparison makes the population effect easy to see. Neither measure is automatically superior; the appropriate one depends on whether the question concerns total production capacity or production per person.
Current U.S. dollars measure nominal GDP, not real GDP
The word current means the indicator uses prices prevailing in the observation year. It is not adjusted to remove changes in the price level over time. A country’s current-dollar GDP can therefore rise because of real production growth, domestic inflation, exchange-rate changes, or a combination of those forces.
If the question is how much real output expanded through time, constant-price GDP or a real GDP growth rate is more appropriate. For a same-year snapshot of nominal economic size expressed in a common currency, current U.S. dollars remain intuitive and widely used.
Current U.S. dollars are also different from PPP GDP
Purchasing-power-parity GDP adjusts for differences in price levels across countries and expresses output in international dollars. GDP in current U.S. dollars uses current-price values converted into U.S. dollars and does not make that PPP adjustment.
Current-dollar GDP can be useful for questions tied to market exchange rates and nominal international scale. PPP GDP answers a different question about the volume of goods and services that money can purchase at domestic prices. Different rankings between the two approaches are expected because the conversion concepts differ.
The median observation is about $49.9 billion
The unweighted median among the 183 observations is about $49.9 billion, while the mean is about $599.2 billion. The mean is far above the median because a small number of exceptionally large economies stretch the upper tail.
68 observations are at least $100 billion, 30 are at least $500 billion and 19 are at least $1 trillion. At the other end, 38 are below $10 billion, including 6 below $1 billion. The map uses several size bands because a single linear scale would make most smaller economies visually indistinguishable beside the United States and China.
Nauru has the smallest observation at about $160 million
Nauru has the smallest 2024 observation at about $160.4 million. The Marshall Islands are about $280 million, Kiribati about $308 million, the Federated States of Micronesia about $471 million and Dominica about $689 million. Many of the smallest total-GDP observations are very small island economies with small populations.
A small total GDP should not be translated directly into a statement that residents are poorer. Total GDP measures the size of an economy, not the average standard of living. GDP per capita, household income, consumption, poverty, prices and wealth distribution are better suited to different aspects of living standards.
A 2024 level ranking is not a growth-rate ranking
The United States being first and China second describes the level of nominal GDP in 2024. It does not tell us which economy grew fastest during the year. Growth comparisons require changes across time, preferably using real GDP growth when the goal is to measure changes in production volume.
Comparing current-dollar GDP between years also mixes domestic price changes and exchange-rate movements with output changes. For that reason, a rise in the dollar value should not automatically be described as an equally large increase in real economic activity.
GDP does not directly measure household income, wealth or well-being
GDP is a national-accounts measure of production within an economic territory during an accounting period. It does not directly report disposable household income, household wealth and debt, the distribution of income, housing affordability, access to services or environmental quality.
A very large GDP means an economy has a large production base and a large role in global economic activity. It does not imply that every resident has a high standard of living. Per-capita, household, distributional and price indicators are needed for those questions.
Data source and mapping method
The indicator definition follows the World Bank World Development Indicators metadata for NY.GDP.MKTP.CD. The World Bank describes GDP as income earned through the production of goods and services within an economic territory and identifies this series as current-price U.S. dollars.
The map and ranking use 183 country and area observations dated 2024. The concentration percentages use the sum of those same 183 observations as the denominator rather than a separate regional, income-group or World aggregate row. Indicator code NY.GDP.MKTP.CD belongs to World Bank World Development Indicators, so the public source identity and definition follow the official World Bank WDI series.
Frequently Asked Questions
How many economies exceeded $1 trillion in GDP in 2024?
Nineteen economies in the 183-country-and-area World Bank observation set had GDP of at least $1 trillion in current U.S. dollars.
What was the Republic of Korea’s 2024 GDP and rank?
Korea was about $1.88 trillion and ranked 12th among the 183 observations. The figure is nominal GDP in current U.S. dollars.
Does an increase in current-US-dollar GDP mean real GDP grew by the same amount?
No. Current-dollar GDP is nominal and can change because of real output, domestic prices and exchange rates. Real growth requires a constant-price or real-growth measure.
Does a larger total GDP mean residents have a higher living standard?
Not necessarily. Total GDP measures the size of the entire economy. GDP per capita, household income, consumption, prices and distributional indicators address different aspects of living standards.
Related Maps
Green Map creates custom-edited map images using open geographic data sources such as geoBoundaries, Natural Earth, OpenStreetMap, and government open data.
These maps are edited visual materials, not raw data files, and are provided for education, documents, presentations, and graphic reference.