Florida recorded the largest 2024 value in the U.S. Energy Information Administration series for net generation by the Electric Utility sector, at 249,530.741 thousand MWh. Georgia followed with 115,578.040 thousand MWh and North Carolina with 112,771.407 thousand MWh. The verified file contains 51 annual observations, covering all 50 states and the District of Columbia. Added together, those values equal 2,256,336.248 thousand MWh, or about 2,256.3 TWh.
The sector definition is essential to interpreting that total. This is not a simple table of all electricity generated in each state by every type of owner or operator. The EIA facet is sectorid=1, labeled Electric Utility. Generation attributed to Independent Power Producers and other sectors can appear in different series. For that reason, a low value here does not automatically mean a state generated little electricity overall, and a high value should be described specifically as electric-utility net generation under this EIA definition.
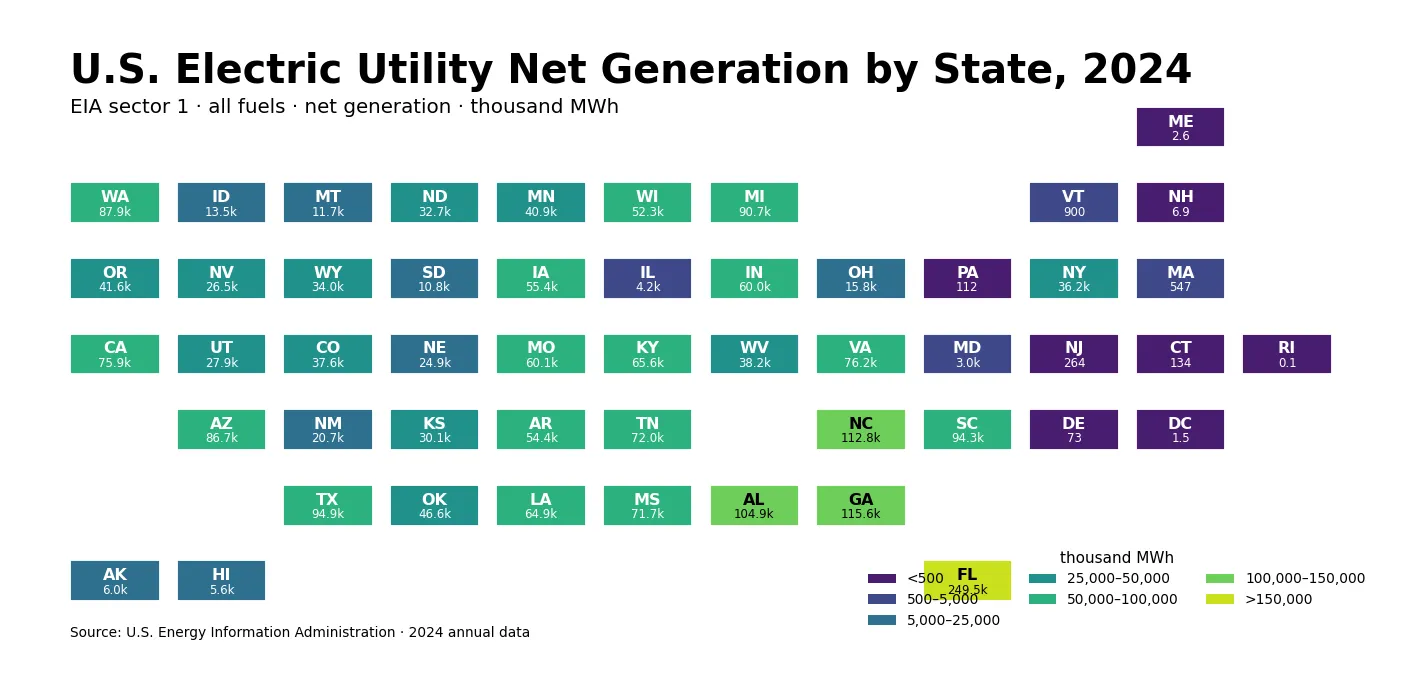
Table of Contents
Florida was more than twice Georgia in the sector 1 series
Florida’s 249,530.741 thousand MWh was about 2.16 times Georgia’s value and exceeded it by 133,952.701 thousand MWh. Florida alone represented 11.06% of the sum of the 51 observations. That is a conspicuous lead for one state, but it also means nearly 89% of the sector total was distributed across the other states and the District of Columbia. The national pattern is therefore not a one-state story even though the first-ranked value is unusually large.
Georgia and North Carolina were much closer to one another, at 115,578.040 and 112,771.407 thousand MWh. Together with Florida, the top three accounted for 21.18% of the 51-state sum. Expanding the group to the top five raised the share to 30.03%. Texas, South Carolina, Michigan, Washington, and Arizona also posted values near or above 85,000 thousand MWh, showing that the upper end of the distribution includes several states rather than one isolated leader.
The top 10 states accounted for just under half of the total
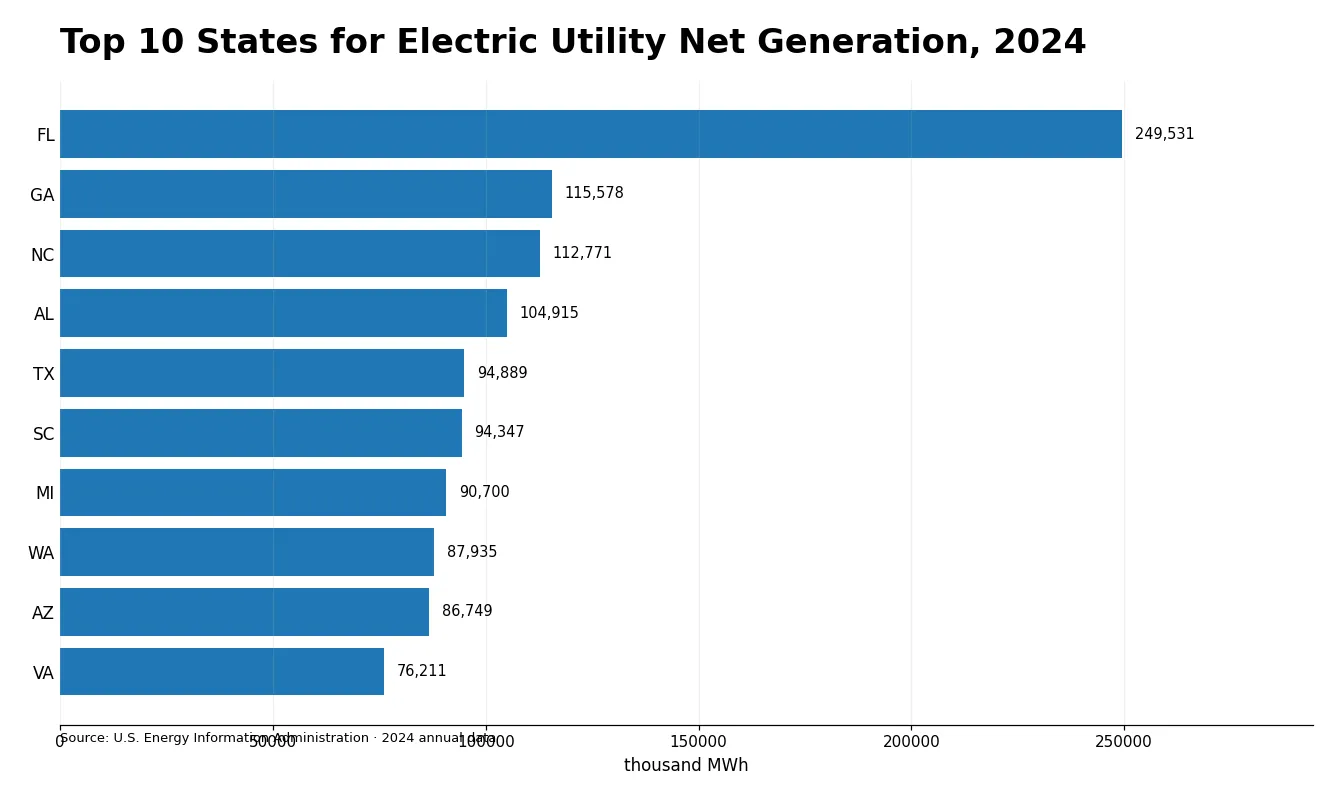
The ten largest state observations summed to 49.36% of the total. Extending the cutoff to the top 15 raised the cumulative share to 64.87%. This provides a more balanced picture than the rank order alone. Florida stands far above second place, yet roughly half of the measured sector output still came from jurisdictions outside the top ten. The distribution combines a pronounced leader with a broad middle of states that each contribute meaningful volumes.
| Rank | State | Net generation (thousand MWh) | Share of 51-state sum |
|---|---|---|---|
| 1 | Florida | 249,530.741 | 11.06% |
| 2 | Georgia | 115,578.040 | 5.12% |
| 3 | North Carolina | 112,771.407 | 5.00% |
| 4 | Alabama | 104,914.796 | 4.65% |
| 5 | Texas | 94,888.698 | 4.21% |
| 6 | South Carolina | 94,346.752 | 4.18% |
| 7 | Michigan | 90,700.020 | 4.02% |
| 8 | Washington | 87,935.319 | 3.90% |
| 9 | Arizona | 86,748.533 | 3.84% |
| 10 | Virginia | 76,210.758 | 3.38% |
The all-fuels total does not reveal the generation mix behind each state value. Because fueltypeid=ALL is used, coal, natural gas, nuclear, hydroelectric, wind, solar, and other eligible sources can be combined into one net-generation observation. States with similar totals may have very different generation portfolios. Explaining why a state ranks highly would require additional EIA fields or fuel-specific series; the 2024 total by itself does not establish the role of any one fuel, policy, market structure, or weather condition.
Several southeastern states appear near the top of the ranking
Florida, Georgia, North Carolina, Alabama, South Carolina, and Virginia all appear among the ten largest observations. Tennessee, Mississippi, Kentucky, and Louisiana are also within the top 15. The descriptive conclusion is that many southeastern states had large Electric Utility sector net-generation values in this 2024 series. The dataset does not contain explanatory variables such as plant capacity, heat rates, fuel prices, wholesale transfers, hourly demand, or outages, so it cannot by itself show why this regional concentration occurred.
Large observations also appear outside the Southeast. Michigan recorded 90,700.020 thousand MWh, Washington 87,935.319 thousand MWh, and Arizona 86,748.533 thousand MWh. California was 11th at 75,921.531 thousand MWh. These values matter because they prevent a simplistic regional reading: the upper part of the distribution is geographically diverse, even though a notable cluster of southeastern states occupies many of the highest ranks.
The median was well below the mean
The arithmetic mean across the 51 observations was 44,241.887 thousand MWh, while the median was 36,206.575 thousand MWh. The mean was about 1.22 times the median because very large values at the top pull the average upward. The first quartile was 5,798.770 thousand MWh and the third quartile was 68,662.401 thousand MWh, so the middle half of the observations lay roughly between 5,799 and 68,662 thousand MWh.
That difference is useful when deciding what a “typical” state looks like in this series. Using only the mean would suggest a state around 44,242 thousand MWh, but half the states were below about 36,207 thousand MWh. For a skewed state distribution, the median, quartiles, and cumulative shares provide context that a single average cannot. They also make it easier to distinguish the broad middle of the distribution from the unusually large upper tail.
Very small sector 1 values should not be read as total state generation
At the low end, Rhode Island had 0.119 thousand MWh, the District of Columbia 1.486, Maine 2.558, and New Hampshire 6.888. Delaware was 72.718, Pennsylvania 112.494, Connecticut 133.816, New Jersey 263.583, Massachusetts 547.032, and Vermont 900.131 thousand MWh. These are published numeric observations in the supplied EIA series; missing values were not converted to zero and no unreported state was imputed.
The sector facet explains why caution is necessary. A state can have substantial electricity generation that is classified under Independent Power Producers or another EIA sector rather than Electric Utility. Pennsylvania is a good example of why the facet must stay visible in the interpretation: its value is small in this sector 1 slice, but this dataset alone cannot be used to characterize all generation in the state. A total-generation question requires an appropriately broader sector definition or a separate aggregate series.
Net generation is not the same as electricity consumption
The generation field measures electricity produced in the reporting sector after the adjustments embodied in EIA’s net-generation concept. It is not a measure of retail electricity sales or final consumption within the same state. Electricity can move across state lines through the transmission system, and the location where power is generated need not be the location where it is ultimately used. Therefore Florida’s first-place generation value should not be rephrased as evidence that Florida consumed the most electricity.
It is also important not to substitute capacity, fuel consumption, or gross generation for this metric. Capacity describes the ability to produce power; fuel consumption measures inputs; and gross generation can differ from net generation because power plants use some electricity internally. Comparisons are most reliable when the field, sector, fuel facet, frequency, year, geography, and unit all match.
The all-fuels facet is useful for scale but hides the fuel mix
Using ALL for the fuel facet answers a straightforward question: how large was Electric Utility net generation in each state regardless of fuel? That makes the series useful for ranking overall sector scale. The tradeoff is that the total conceals the internal mix. A state dominated by hydroelectric generation and a state dominated by thermal generation can have similar all-fuels totals while representing very different electricity systems.
A fuel-specific analysis would require separate observations for natural gas, coal, nuclear, hydroelectric power, wind, solar, or other categories. Those series can be compared with the all-fuels total to calculate shares when the definitions line up. No such shares are inferred here from the all-fuels data alone. Keeping the distinction avoids turning a useful total-generation dataset into unsupported claims about energy transition, emissions, or fuel dependence.
How to read the unit and the state shares
The EIA unit is thousand megawatthours. Florida’s value of 249,530.741 therefore corresponds to about 249.531 TWh, and the sum of the 51 observations corresponds to about 2,256.336 TWh. The conversion helps readers who are more familiar with TWh, but it does not change the scope of the series: the values remain Electric Utility sector observations rather than an all-sector U.S. generation total.
Each percentage in the table is calculated by dividing the state value by the sum of these 51 observations. Florida’s 11.06% is therefore its share of the state-level sector 1 sum used in this article. It should not be presented as 11.06% of the entire U.S. electricity market without confirming that the denominator covers all sectors and matches the same national concept. Denominator discipline is particularly important in EIA data because similar titles can refer to different sector and fuel combinations.
Four identifiers separate this series from similar EIA articles
First, the sector is Electric Utility, identified by sectorid=1. Second, the fuel facet is ALL rather than renewable, petroleum, natural gas, or another category. Third, the field is generation rather than total-consumption or another operational measure. Fourth, the unit is thousand MWh. A related article may look very similar in a headline while changing only one of these dimensions; that change can define a genuinely different dataset and a different interpretation.
This distinction is especially useful when reading related state energy articles on the same site. Independent Power Producer net generation, renewable-fuel consumption, non-CHP fuel energy, and Electric Utility all-fuels generation can all be valid topics at once because they measure different slices of the electricity system. Linking them is useful for comparison, but their values should never be merged unless the EIA definitions explicitly support that calculation.
Data source and calculation method
The source is the U.S. Energy Information Administration electricity/electric-power-operational-data API. The annual request uses the generation field for 2024, fueltypeid=ALL, sectorid=1, and state geography. The file contains 51 rows: 50 states and the District of Columbia. The values are direct published annual observations. No interpolation, model-based estimate, missing-value substitution, or cross-year replacement was applied.
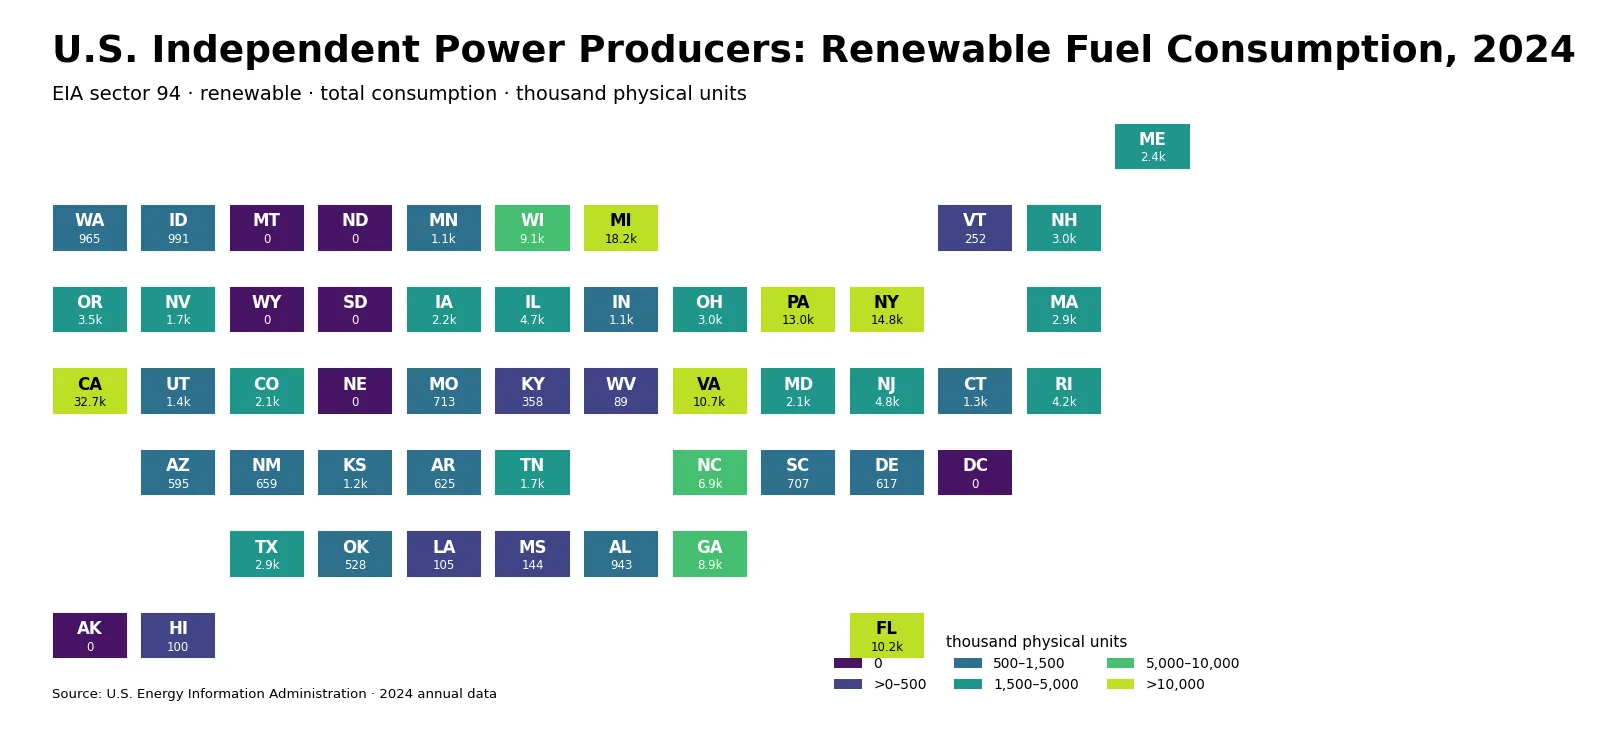
Ranks, the total, mean, median, quartiles, and cumulative shares were calculated directly from those 51 values. The state tile graphic uses a fixed grid of postal abbreviations to make the distribution compact and readable; it is not a boundary-accurate choropleth and should not be used to compare state area or distance. The numeric table and the underlying EIA observations remain the authoritative basis for quantitative comparisons.
Frequently Asked Questions
Which state had the most Electric Utility net generation in 2024?
Florida was highest at 249,530.741 thousand MWh, followed by Georgia and North Carolina.
Does Florida’s 11.06% share mean 11.06% of all U.S. electricity generation?
No. It is Florida’s share of the sum of the 51 state-level observations in this EIA sector 1, all-fuels series.
Why is Pennsylvania so low in this table?
The table covers only the Electric Utility sector. Generation attributed to Independent Power Producers or other sectors is outside this specific slice, so the value cannot represent all Pennsylvania generation.
Can net generation be used as state electricity consumption?
No. Generation and consumption are different measures, and electricity can be transmitted across state lines.
Related Articles
Green Map creates custom-edited map images using open geographic data sources such as geoBoundaries, Natural Earth, OpenStreetMap, and government open data. These maps are edited visual materials, not raw data files, and are provided for education, documents, presentations, and graphic reference.