Independent power producers accounted for very different amounts of utility-scale net generation across the United States in 2025. In the EIA state-level series used here, the 50 states plus the District of Columbia sum to 1,971.4 million MWh. Texas alone recorded 450.2 million MWh, or 22.8% of the 51-jurisdiction total. Pennsylvania ranked second at 242.2 million MWh and Illinois third at 185.6 million MWh.
The scope matters. This is not total electricity generation from every ownership class, and it is not a ranking of one fuel such as solar or natural gas. The EIA query fixes the sector to Independent Power Producers, the fuel category to all fuels, the field to annual net generation, and the geography to states. The source reports thousand megawatthours; the discussion below converts those values to million MWh for readability without changing the underlying measurements.
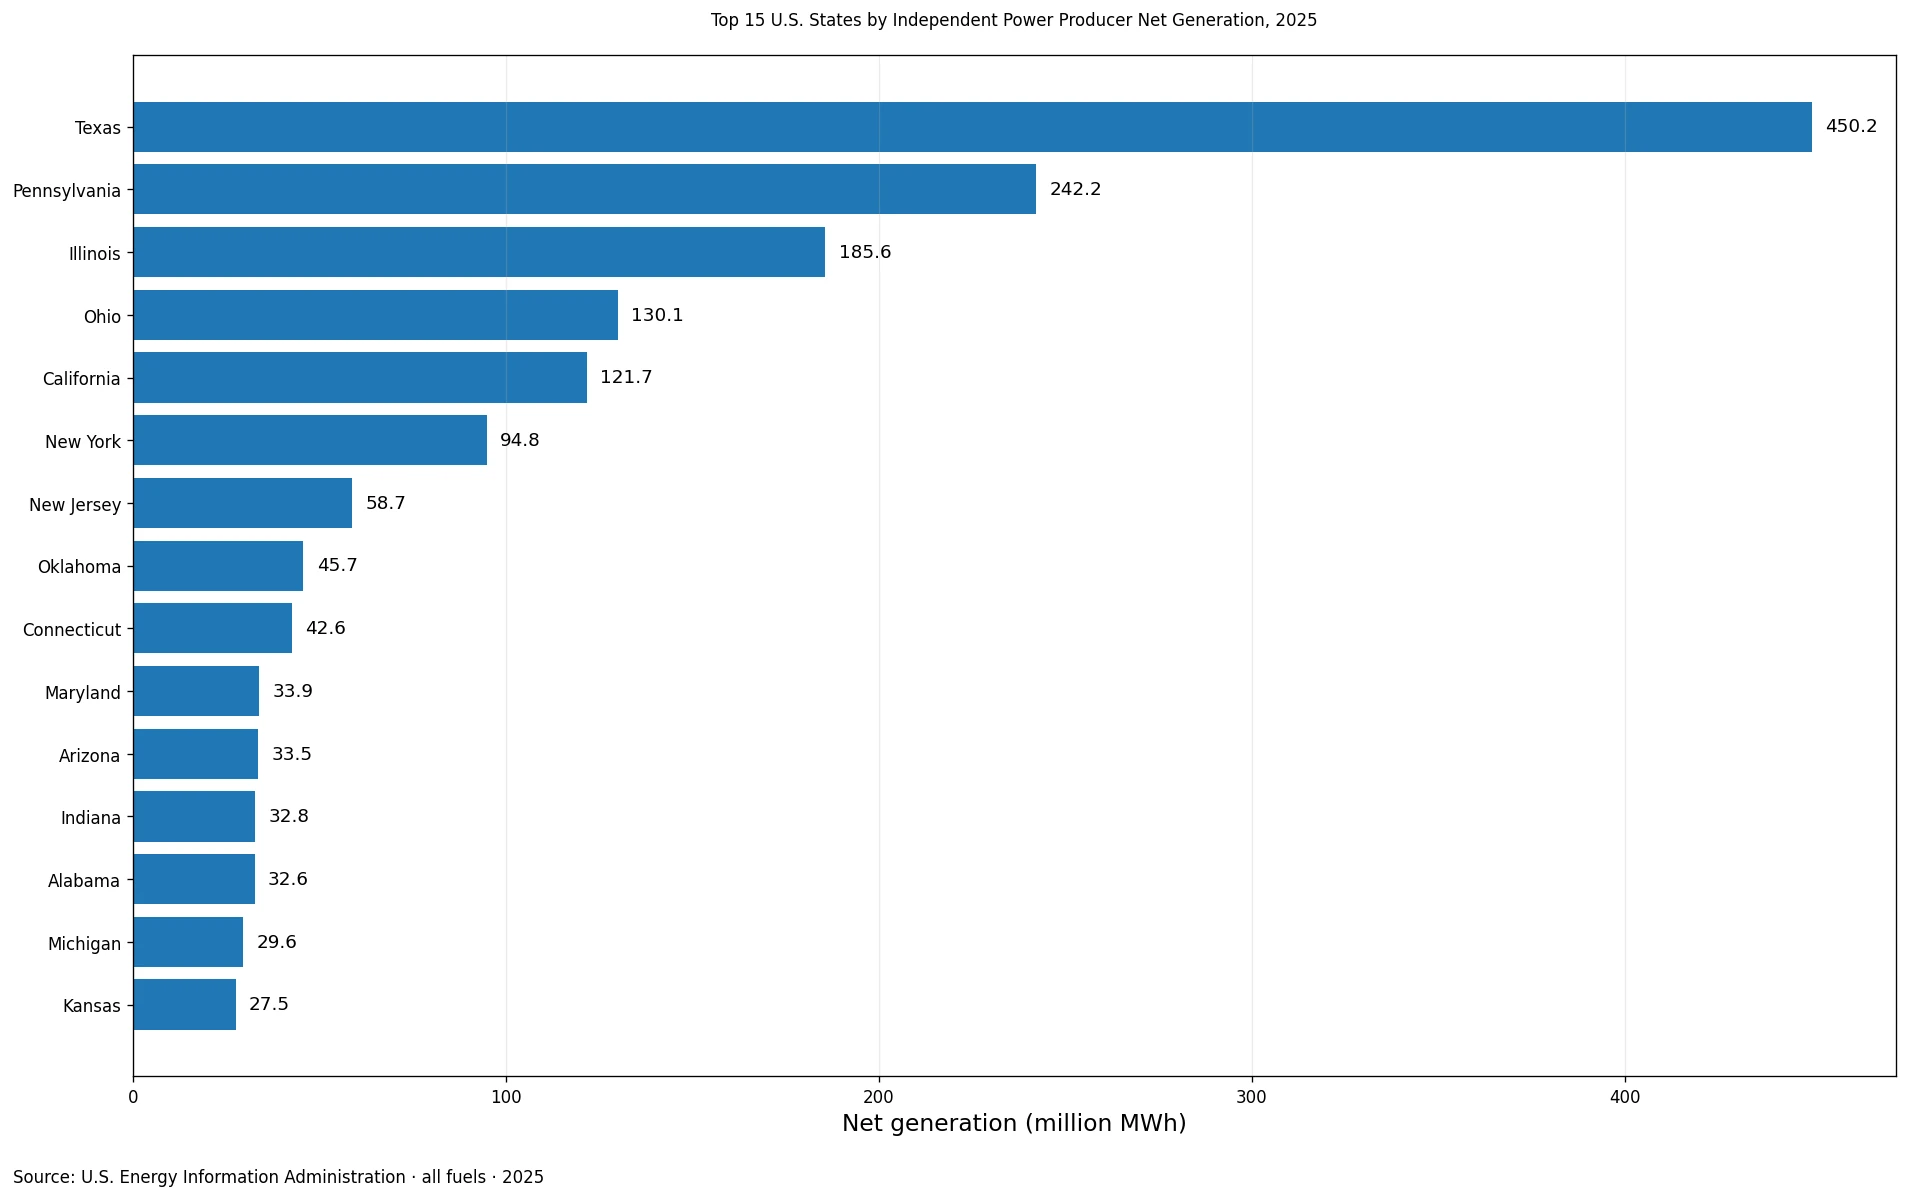
Table of Contents
What this EIA series measures
The series isolates generation attributed to the independent power producer sector. It therefore answers a narrower question than a conventional state electricity-generation table. A state can have large utility-owned generation, municipal generation, cooperative generation, or imported electricity while showing a smaller value in this specific sector. Net generation also differs from plant nameplate capacity: it measures electricity actually produced after station use rather than the maximum output a set of generators could theoretically deliver.
Using all fuels makes the series broad within that ownership category. Coal, natural gas, nuclear, wind, solar and other fuels can contribute to the total where they are represented in the IPP sector. That makes this article complementary to the existing solar-only IPP comparison. The solar series is useful for understanding one technology, while the all-fuels series shows the overall scale of independent generation in each state.
Texas represented nearly one quarter of the total
Texas was the clear leader with 450.2 million MWh. Its 22.83% share was larger than the combined shares of many lower-ranked states. Pennsylvania contributed 12.28% and Illinois 9.41%. Together, the top three states produced 44.53% of the net generation in this 51-jurisdiction IPP series.
Ohio ranked fourth at 130.1 million MWh and California fifth at 121.7 million MWh. Adding those two raises the top-five share to 57.30%. New York was sixth, while New Jersey, Oklahoma, Connecticut and Maryland completed the top ten. The first ten states collectively accounted for 71.29% of the total, leaving less than three tenths for the other 41 jurisdictions.
Top 15 states in 2025
| State | Net generation (million MWh) | Share of 51-jurisdiction total |
|---|---|---|
| Texas | 450.2 | 22.83% |
| Pennsylvania | 242.2 | 12.28% |
| Illinois | 185.6 | 9.41% |
| Ohio | 130.1 | 6.60% |
| California | 121.7 | 6.17% |
| New York | 94.8 | 4.81% |
| New Jersey | 58.7 | 2.98% |
| Oklahoma | 45.7 | 2.32% |
| Connecticut | 42.6 | 2.16% |
| Maryland | 33.9 | 1.72% |
| Arizona | 33.5 | 1.70% |
| Indiana | 32.8 | 1.67% |
| Alabama | 32.6 | 1.66% |
| Michigan | 29.6 | 1.50% |
| Kansas | 27.5 | 1.40% |
The ranking shows a steep rather than gradual distribution. Texas produced about 1.9 times Pennsylvania’s value and more than twice Illinois’s value. After California, the absolute amounts decline further, although several states still record tens of millions of MWh. This is why a simple rank number can be misleading: the difference between first and fifth is far larger than the difference between many positions lower in the table.
The median state was far below the average
The arithmetic mean across the 51 jurisdictions was 38.7 million MWh, but the median was only 15.7 million MWh. Only 9 jurisdictions exceeded the mean. The first quartile was about 8.1 million MWh and the third quartile about 31.1 million MWh. The large gap between the mean and median is a direct sign that a relatively small number of high-generation states pull the average upward.
For a reader trying to understand what is typical, the median is therefore more informative than the average by itself. A state near the middle of the distribution generated less than half the mean. At the same time, the top-three and top-ten shares quantify just how much the high end matters. Using these statistics together avoids treating the distribution as if it were evenly spread across the country.
Small IPP values do not mean small electricity systems
At the bottom of the table, the District of Columbia recorded about 0.048 million MWh, Alaska about 0.183 million MWh and Vermont about 1.35 million MWh. Those small values should not be interpreted as a direct measure of electricity demand, reliability, grid importance or total generation. They only describe utility-scale net generation assigned to independent power producers in the EIA sector classification.
Ownership structure can change the result substantially. In one state, a large share of generating capacity may sit with independent companies; in another, utilities or public entities may own more of the fleet. Interstate electricity trade also means a state can consume electricity generated elsewhere. The dataset does not attempt to convert these production values into a measure of self-sufficiency or consumer dependence.
Why the all-fuels ranking differs from a solar-only ranking
The related EIA solar series applies a fuel filter before ranking states. That question highlights where independent solar generation is largest. Here, the fuel facet is ALL, so every fuel used by the independent producer sector contributes to the state total. A state with substantial gas, nuclear, wind or other independent generation can rank highly overall even if its solar-only position is modest.
The reverse can also occur. A state may be prominent in solar IPP generation while remaining smaller in total IPP output if other fuels make up relatively little production. The two datasets therefore describe different dimensions of the electricity system rather than competing estimates of the same quantity. Keeping the fuel filter visible prevents a reader from treating technology-specific and all-fuel rankings as interchangeable.
The dataset shows the outcome, not a single cause
The state differences can be described precisely from the generation values, but this one series does not identify why each state landed where it did. Plant ownership, fleet size, fuel mix, capacity factors, retirements, new construction, market structure and demand conditions can all influence annual net generation. A causal explanation would require additional evidence from capacity, plant, ownership and market datasets rather than inference from the ranking alone.
Absolute generation also does not adjust for population, land area, state GDP or electricity consumption. Large export-oriented generating states can appear high even if their resident population is smaller than that of another state. Conversely, a populous state may rank lower in this IPP series if a larger portion of its generation belongs to another ownership sector. Normalized metrics answer different questions and should be calculated separately.
Source and calculation method
The source is the U.S. Energy Information Administration electric power operational data API. The annual query uses the generation field, fueltypeid ALL, sectorid 94 for independent power producers, and year 2025. The verified extract contains one row for each of the 50 states and the District of Columbia, with no missing jurisdiction in the supplied state coverage.
The source unit is thousand megawatthours. Values shown as million MWh are the published figures divided by 1,000. State shares are each state’s value divided by the sum of all 51 rows. The mean, median, quartiles and concentration shares are calculated from that same set of observations. No missing values were replaced, no other sector was added and no estimate from another year was used.
How to read the 2025 comparison
- Treat the numbers as absolute annual net generation, not capacity or market share within each state.
- Remember that the sector is independent power producers only, so the values are not identical to total state generation.
- All fuels are combined; fuel-specific rankings such as solar answer a different question.
- The 51-jurisdiction denominator includes all 50 states and the District of Columbia.
- Use additional plant, capacity and market data before attributing the state differences to a specific cause.
The clearest 2025 pattern is concentration. Texas generated almost 23% of the IPP all-fuels total in this state-level dataset, and Pennsylvania plus Illinois pushed the top-three share above 44%. The average state figure was much higher than the median, reinforcing the same conclusion from another angle. Read within its defined EIA sector and fuel scope, the series provides a useful snapshot of where independent utility-scale electricity production was largest in 2025.
Frequently Asked Questions
Which state had the most independent power producer net generation in 2025?
Texas led with 450.2 million MWh, equal to 22.8% of the total across the 50 states and District of Columbia.
Is this the same as total state electricity generation?
No. The series covers utility-scale net generation classified by the EIA in the independent power producer sector, not generation from every ownership sector in a state.
Why can the ranking differ from an IPP solar ranking?
This series combines all fuels. A solar-only ranking filters the data to one fuel, so states with large gas, nuclear, wind or other independent generation can move substantially in the all-fuels ranking.
Related Articles
Green Map creates custom-edited map images using open geographic data sources such as geoBoundaries, Natural Earth, OpenStreetMap, and government open data. These maps are edited visual materials, not raw data files, and are provided for education, documents, presentations, and graphic reference.