How often do students with an immigrant background reach minimum reading proficiency at the end of lower secondary education? UNESCO Institute for Statistics (UIS) data for 2022 contain 76 country and area observations for this subgroup. The median is 47.20%. Macao SAR is highest at 91.80%, followed by Singapore at 89.56%, Brunei Darussalam at 84.53%, Ireland at 82.77%, and Australia at 80.81%.
The denominator is not all lower-secondary students. The immigrant-background subgroup is identified first, and the indicator then measures the percentage within that subgroup that reaches at least the minimum proficiency level in reading. A value of 60% therefore means that roughly six in ten students in the subgroup meet or exceed the reading threshold.
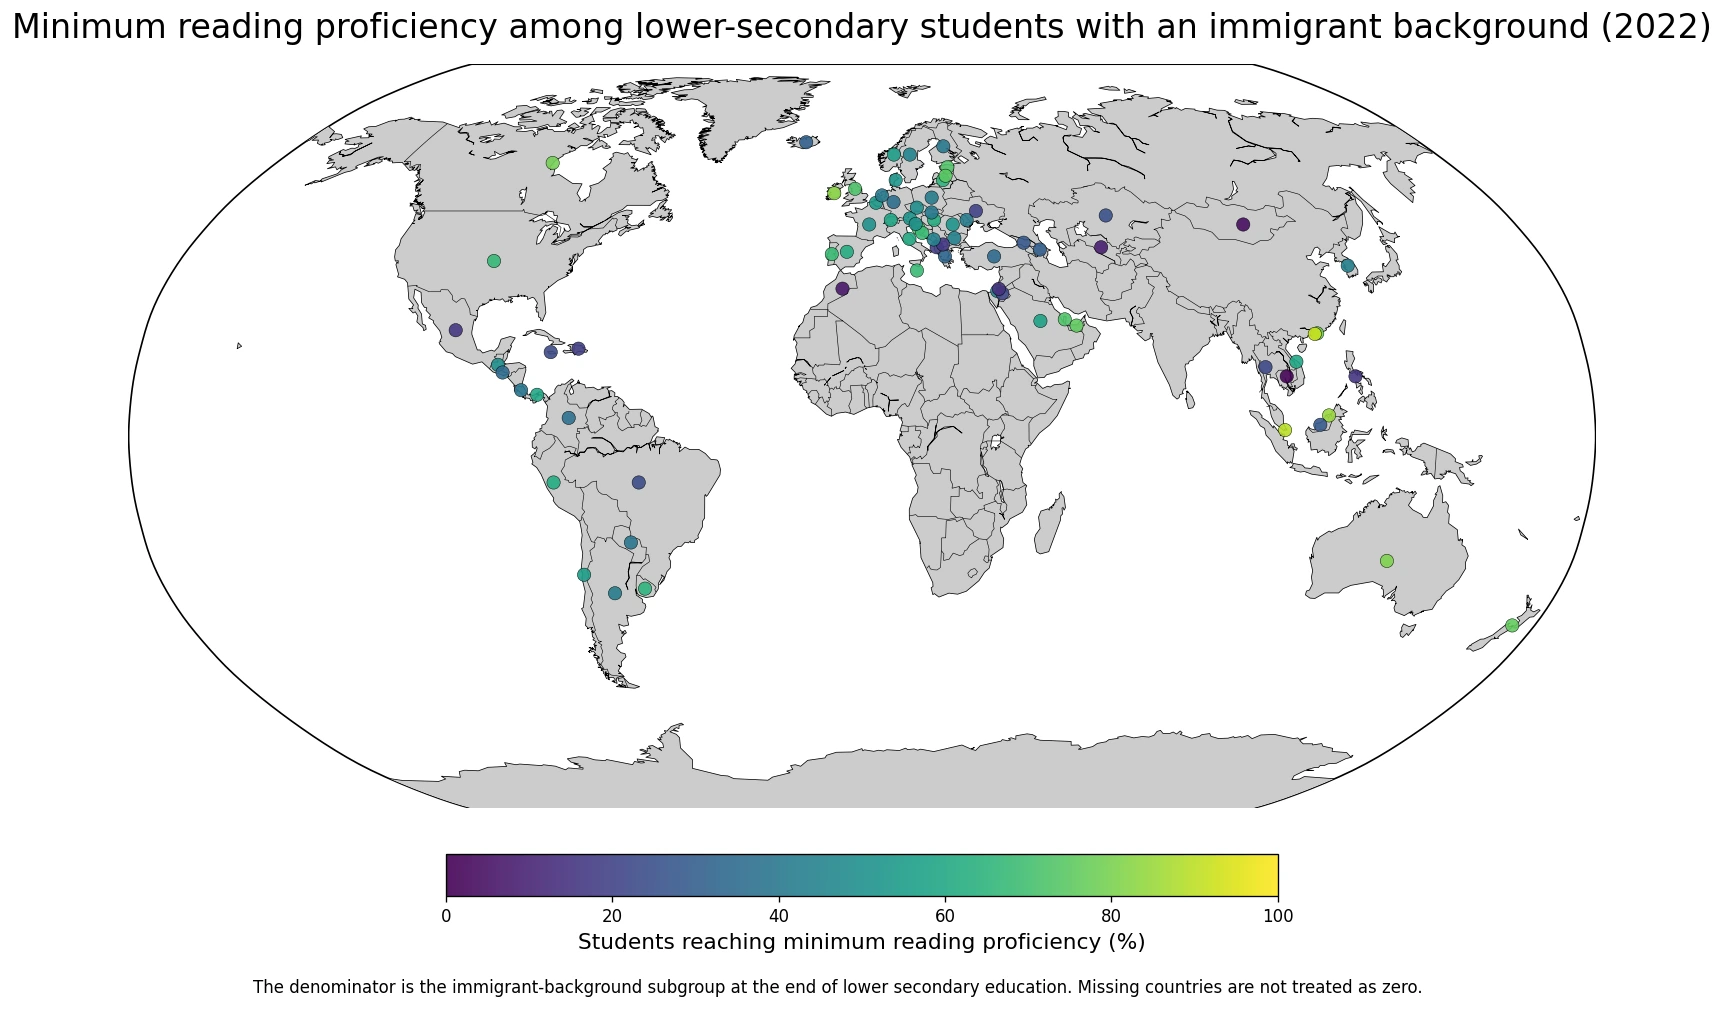
Table of Contents
Macao, Singapore, and Brunei are above 84%
Macao SAR records 91.80%, Singapore 89.56%, and Brunei Darussalam 84.53%. Ireland is 82.77% and Australia 80.81%, so 5 observations are at or above 80%. Canada, Hong Kong SAR, New Zealand, the United Arab Emirates, Latvia, Estonia, Qatar, and the United Kingdom also exceed 70%.
| Rank | Country or area | Minimum reading proficiency |
|---|---|---|
| 1 | China, Macao Special Administrative Region | 91.80% |
| 2 | Singapore | 89.56% |
| 3 | Brunei Darussalam | 84.53% |
| 4 | Ireland | 82.77% |
| 5 | Australia | 80.81% |
| 6 | Canada | 79.18% |
| 7 | China, Hong Kong Special Administrative Region | 77.97% |
| 8 | New Zealand | 76.10% |
| 9 | United Arab Emirates | 75.73% |
| 10 | Latvia | 74.43% |
| 11 | Estonia | 72.90% |
| 12 | Qatar | 72.62% |
| 13 | United Kingdom of Great Britain and Northern Ireland | 72.47% |
| 14 | Croatia | 71.80% |
| 15 | Serbia | 67.97% |
The upper end includes English-speaking systems and several East or Southeast Asian economies. That pattern does not identify a single cause. Socioeconomic background, age at migration, home language, school composition, education pathways, and assessment sampling can all shape subgroup outcomes.
The median across 76 observations is 47.20%
The median is 47.20% and the unweighted mean is 47.30%. The middle half of observations lies between 30.95% and 65.04%. 36 observations are at or above 50%, 24 are at or above 60%, and 14 are at or above 70%.
| Minimum proficiency band | Countries or areas | Share of observations |
|---|---|---|
| Below 20% | 11 | 14.5% |
| 20–39.9% | 17 | 22.4% |
| 40–59.9% | 24 | 31.6% |
| 60–69.9% | 10 | 13.2% |
| 70–79.9% | 9 | 11.8% |
| 80% or more | 5 | 6.6% |
11 observations are below 20%. The range stretches from 1.80% to 91.80%, a spread of about 90 percentage points. The distribution therefore shows much more than a single global-looking average can convey.
Cambodia, Mongolia, Morocco, and Uzbekistan are below 10%
Cambodia is lowest at 1.80%, followed by Mongolia at 3.88%, Morocco at 6.11%, and Uzbekistan at 8.47%. Palestine records 14.42%, the Philippines 14.92%, Mexico 16.21%, North Macedonia 16.66%, Albania 18.35%, the Dominican Republic 18.59%, and Ukraine 19.93%.
| Low-end order | Country or area | Minimum reading proficiency |
|---|---|---|
| 1 | Cambodia | 1.80% |
| 2 | Mongolia | 3.88% |
| 3 | Morocco | 6.11% |
| 4 | Uzbekistan | 8.47% |
| 5 | Palestine | 14.42% |
| 6 | Philippines | 14.92% |
| 7 | Mexico | 16.21% |
| 8 | North Macedonia | 16.66% |
| 9 | Albania | 18.35% |
| 10 | Dominican Republic | 18.59% |
| 11 | Ukraine | 19.93% |
| 12 | Jordan | 21.60% |
| 13 | Thailand | 21.92% |
| 14 | Jamaica | 22.35% |
| 15 | Brazil | 23.32% |
Low values indicate that a small share of the immigrant-background subgroup reaches the minimum reading benchmark. They do not prove that immigrant status itself causes the outcome. Immigrant background can overlap with socioeconomic conditions, language exposure, migration timing, and school composition.
Immigrant background is not the same as speaking a different language at home
The UIS learning-outcome indicator list treats READ.LOWERSEC.NONNATIVE, labelled immigrant background, separately from READ.LOWERSEC.NONLANGTEST, which identifies students who did not speak the test language at home. The two subgroup dimensions are related in some settings but are not interchangeable.
A student with an immigrant background may speak the test language at home, while a non-immigrant student may belong to a linguistic minority and use a different language at home. The two series should therefore be analysed separately rather than substituted for one another.
PISA classifies immigrant background using students’ and parents’ countries of birth
The OECD PISA 2022 framework uses country-of-birth information for students and their parents to distinguish immigrant and non-immigrant backgrounds and to separate first- and second-generation immigrant students. This makes immigrant background a migration-history classification rather than a simple citizenship label.
International learning datasets rely on the subgroup definitions in their underlying assessments. Country-specific legal categories for migrants, residence status, or citizenship can differ from the statistical background variable used for education analysis, so those concepts should not be merged.
Minimum proficiency is a threshold outcome, not an average test score
This percentage is not the average reading score of immigrant-background students. Students are evaluated against a defined minimum proficiency threshold, and the indicator reports the share of the subgroup that meets or exceeds that threshold.
A value of 75% therefore means about three quarters of the subgroup achieved at least the minimum benchmark. Average scores, top-performance shares, or detailed reading-domain results require other assessment statistics.
The gap with non-immigrant students cannot be calculated from this series alone
READ.LOWERSEC.NONNATIVE provides the proficiency percentage for the immigrant-background subgroup only. A matched READ.LOWERSEC.NATIVE value for the same country, year, and assessment conditions is needed to calculate a direct immigrant–non-immigrant gap.
A value of 40% for immigrant-background students does not imply 60% for non-immigrant students. The two are not complementary shares; each is a proficiency percentage calculated within its own subgroup.
The indicator does not reveal the size of the immigrant-background subgroup
A country can record 80% or 30% proficiency while having very different numbers or shares of immigrant-background students. If the subgroup represents 3% of students in one country and 30% in another, the same proficiency percentage corresponds to a very different scale of educational need.
Planning support therefore requires subgroup counts or shares in addition to this outcome rate. READ.LOWERSEC.NONNATIVE is strongest for comparing learning outcomes within the subgroup, not its demographic weight.
Immigrant-background students are not a homogeneous population
First- and second-generation students can differ in exposure to the school language and education system. Family education, income, migration pathway, country of origin, age at arrival, and the concentration of immigrant students across schools can also vary.
OECD PISA analyses show that reading-performance differences associated with immigrant background can change after accounting for socioeconomic status and language spoken at home. For that reason, the country ranking should not be turned into a simple ranking of migration integration or school quality.
One peer observation is close to the dataset median
The Republic of Korea records 43.39% in 2022, slightly below the 47.20% median across the 76 observations. This is not the reading-proficiency rate of all lower-secondary students in Korea. It applies only to the immigrant-background subgroup represented in the indicator.
All observations use 2022, but coverage is not universal
All 76 rows use the 2022 reference year, avoiding a comparison that mixes different assessment years. Coverage is still limited to countries and areas with eligible learning-assessment data and the background information required to identify the subgroup.
The unweighted mean of 47.30% is not a student-weighted global immigrant-background proficiency rate. Each country or area contributes one row regardless of subgroup size, and countries without a value remain missing rather than being assigned zero.
Data scope and source
The analysis uses 76 national-level 2022 observations from the UNESCO Institute for Statistics official API indicator READ.LOWERSEC.NONNATIVE. The official metric is the proportion of students at the end of lower secondary education achieving at least a minimum proficiency level in reading, restricted to the immigrant-background subgroup, both sexes.
The observed range is 1.80% to 91.80%, with a median of 47.20% and an unweighted mean of 47.30%. Rankings, quartiles, and proficiency bands are calculated directly from the supplied values. Missing countries are not converted to zero.
The main takeaway
Macao SAR has the highest 2022 observation at 91.80%, followed by Singapore at 89.56% and Brunei Darussalam at 84.53%. The median across the 76 available countries and areas is 47.20%, while 11 observations are below 20%. The indicator measures reading proficiency within the immigrant-background subgroup; it does not show the subgroup’s share of all students or the proficiency gap with non-immigrant students.
Frequently Asked Questions
Does this indicator show the share of all students with an immigrant background?
No. It identifies the immigrant-background subgroup first and then measures the percentage within that subgroup that reaches at least minimum reading proficiency.
Is immigrant background the same as not speaking the test language at home?
No. UIS reports immigrant background and test-language use at home as separate subgroup dimensions.
Can this series show the reading gap with non-immigrant students?
Not by itself. A matching non-immigrant-background proficiency series is needed for the same country, year, and assessment conditions.
Related Articles
Green Map creates custom-edited map images using open geographic data sources such as geoBoundaries, Natural Earth, OpenStreetMap, and government open data.
These maps are edited visual materials, not raw data files, and are provided for education, documents, presentations, and graphic reference.