Maryland recorded the largest 2024 state value in the U.S. Energy Information Administration series for petroleum liquids consumed for useful thermal output in the Electric Power sector. Its value was 1.78826 million MMBtu, followed by Hawaii at 1.47488 million MMBtu. The 50 state observations sum to 3.95668 million MMBtu. Maryland represented 45.20% of that sum and Hawaii 37.28%, so the two states together accounted for 82.47%.
The metric is narrowly defined. It comes from the EIA electric-power-operational-data route with field consumption-uto-btu, fueltypeid=PEL for petroleum liquids, and sectorid=98 for Electric Power. It measures the heat-content basis of fuel consumed for useful thermal output. It is not electricity generation, retail electricity consumption, total petroleum use, or the combined amount of fuel used for both electricity and useful heat. Keeping those distinctions visible is necessary because several EIA series have similar names but answer different questions.
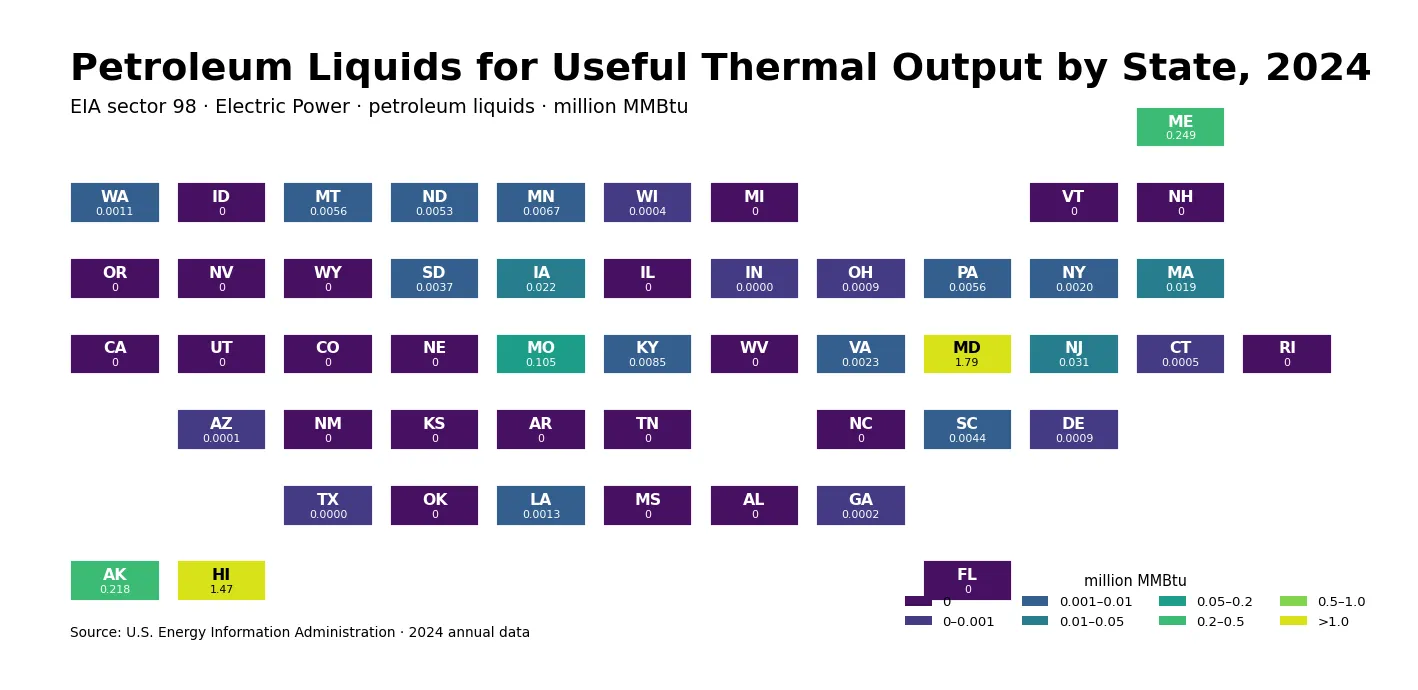
Table of Contents
Maryland and Hawaii accounted for 82.5% of the state-level sum
Maryland exceeded Hawaii by 0.31338 million MMBtu and was about 1.21 times as large. The more striking feature, however, is the gap between the first two states and the rest of the distribution. Maine ranked third at 0.24878 million MMBtu and Alaska fourth at 0.21766. After removing Maryland and Hawaii, the remaining 48 states together sum to only 0.69354 million MMBtu, or 17.53% of the total.
The cumulative shares make the concentration easier to see. The top three states accounted for 88.76% of the 50-state sum, the top five for 96.91%, and the top ten for 99.13%. Missouri, fifth at 0.10500 million MMBtu, was already far below the two leaders. New Jersey, Iowa, Massachusetts, Kentucky, and Minnesota completed the top ten with values ranging from roughly 0.031 down to 0.007 million MMBtu.
Values fall sharply after the first few states
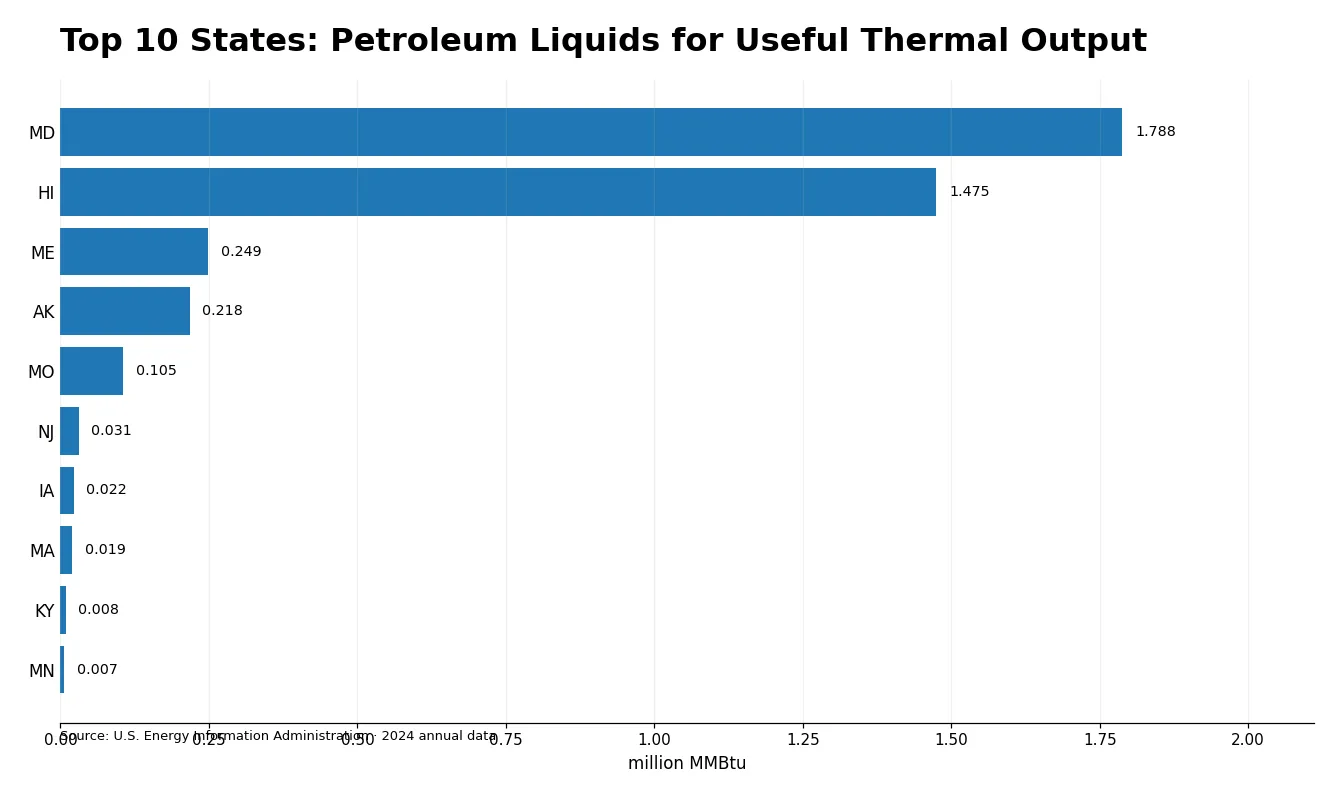
The ten largest observations make up 99.13% of the total, leaving only 0.87% for the other 40 states. A simple average therefore gives a misleading impression of a typical state. The arithmetic mean is 0.07913 million MMBtu, while the median is only 0.00008. The average is pulled upward by the two very large observations and several smaller but still positive values at the upper end.
| Rank | State | Consumption (million MMBtu) | Share of 50-state sum |
|---|---|---|---|
| 1 | Maryland | 1.78826 | 45.20% |
| 2 | Hawaii | 1.47488 | 37.28% |
| 3 | Maine | 0.24878 | 6.29% |
| 4 | Alaska | 0.21766 | 5.50% |
| 5 | Missouri | 0.10500 | 2.65% |
| 6 | New Jersey | 0.03064 | 0.77% |
| 7 | Iowa | 0.02236 | 0.57% |
| 8 | Massachusetts | 0.01937 | 0.49% |
| 9 | Kentucky | 0.00849 | 0.21% |
| 10 | Minnesota | 0.00668 | 0.17% |
The table should be read only within this EIA metric. It does not rank states by total petroleum consumption, total energy consumption, electricity generation, heat production, or all-sector fuel use. The numerator is petroleum-liquid fuel energy assigned to useful thermal output, the sector is Electric Power, the year is 2024, and the geography is the state. Changing any of those dimensions can produce a very different ordering.
Twenty-three states have published zeros, not missing observations
All 50 states are present in the data. 27 states have values above zero and 23 states have a published value of exactly zero. Those zeros were not created by replacing missing values. This distinction matters because states that are large in other electricity or petroleum datasets can legitimately appear as zero in this particular slice. California, Florida, Michigan, and North Carolina are examples of states with zero values here even though they are substantial energy states in many other contexts.
A zero in this series means that the published observation for this field, fuel, sector, year, and state is zero. It does not mean the state has no petroleum use of any kind, no power plants, or no thermal-energy activity. Missing data would represent a different situation and should be shown separately. The visualization therefore uses a dedicated zero category and preserves every state row supplied by the EIA data.
The unit measures fuel energy, not generated electricity
The EIA unit is million MMBtu. One MMBtu is one million British thermal units, so one million MMBtu equals one trillion Btu. On that basis, Maryland’s 1.78826 million MMBtu corresponds numerically to about 1.78826 trillion Btu of fuel energy in this metric. The conversion helps with scale, but it does not change the underlying definition or turn the measure into an electricity-generation statistic.
It would be incorrect to compare the number directly with MWh of net generation as if the units were interchangeable. Fuel heat content is an input-side energy measure, while MWh is commonly used for electrical output. Converting fuel energy into electricity output would require information about plant efficiency and operating conditions. This state table does not provide enough information to calculate generation, heat efficiency, or the amount of useful heat delivered from the fuel input.
Useful-thermal-output consumption is separate from electricity-generation fuel use
The EIA operational dataset contains several fuel-consumption fields that can sound similar in ordinary language. Fuel consumed for electricity generation, fuel consumed for useful thermal output, and total fuel consumption for both purposes are separate measures. This article uses only consumption-uto-btu. A state can therefore rank highly in petroleum fuel used for electricity generation and still rank low here, or the reverse can occur.
The distinction is especially relevant when reading data associated with systems that provide both electricity and useful heat. Even so, the state-level file does not identify individual plants or explain their operating configurations. The data show where the measured fuel energy was reported, not why a specific state used more petroleum liquids for this purpose. Plant-level operational records would be needed for that kind of causal or engineering explanation.
Sector 98 is part of the metric identity, not a decorative label
The sector facet in this series is 98, labeled Electric Power by the EIA. That facet differentiates the metric from Electric Utility, Independent Power Producer, and other sector-specific series that may use the same field or fuel family. Two articles can both contain the words petroleum, useful thermal output, and state while still describe different datasets because the sector facet is different. For duplicate control and analytical accuracy, the full combination of field, fueltypeid, sectorid, year, and unit matters more than title similarity.
The same rule applies to year-over-year analysis. To claim that a state increased or decreased from 2024 to 2025, the field, fuel, sector, geography, frequency, and unit should remain constant while only the period changes. Comparing sector 98 in one year with sector 1 or sector 94 in another would mix a classification change into the apparent time trend. This article therefore stays within the verified 2024 cross-section and does not infer a trend from a single year.
The data describe concentration but do not explain its causes
The concentration in Maryland and Hawaii is a direct statistical result. Explaining the causes would require additional evidence. Possible influences in an energy system can include plant configuration, the presence of facilities that deliver useful heat, fuel substitution, operating schedules, local demand, fuel costs, and regulatory or environmental constraints. None of those variables is included in the 50-row state file, so attributing the ranking to one of them would go beyond what the evidence supports.
The same caution applies to low values. A zero or near-zero result should not be described as evidence that a state does not use petroleum. This metric covers one purpose inside one EIA sector. Petroleum can be used for transportation, industry, space heating, electricity generation, or other purposes outside this slice. The safest interpretation is narrow: the value shows the published 2024 fuel energy assigned to useful thermal output for petroleum liquids in Electric Power.
Median, zero count, and cumulative shares are more informative than the mean alone
Across all 50 states, the mean is 0.07913 million MMBtu and the median is 0.00008. The first quartile is 0.00000 and the third quartile 0.00511. Because 23 states are exactly zero, the center of the full distribution sits very close to zero. Among only the 27 states with positive values, the median is 0.00443 million MMBtu and the mean is 0.14654, again showing how the upper tail raises the average.
For a heavily skewed distribution, describing a “typical” state with the mean can obscure the actual pattern. The combination of 23 zeros, a low median, and an 82.5% share for the top two states conveys the structure much more clearly. The 2024 pattern is not a broad, even spread of petroleum-liquid fuel energy for useful thermal output. It is a concentrated distribution with two dominant states, a small secondary group, and many zero or very small observations.
Frequently Asked Questions
Which state had the highest petroleum-liquid fuel consumption for useful thermal output in 2024?
Maryland ranked first at 1.78826 million MMBtu in the EIA sector 98 Electric Power series, followed by Hawaii at 1.47488 million MMBtu.
Are the zero-valued states missing data?
No. All 50 states are present, and 23 states have published numeric zeros. The values were not created by filling missing observations with zero.
Is this an electricity-generation measure?
No. consumption-uto-btu measures fuel energy consumed for useful thermal output and is reported in million MMBtu, not MWh of electricity generation.
Why can this ranking differ from other petroleum-use articles?
The metric depends on the EIA field, fueltypeid, sectorid, year, and unit. This article is limited to petroleum liquids, sector 98 Electric Power, and useful-thermal-output fuel consumption in 2024.
Related Articles
Green Map creates custom-edited map images using open geographic data sources such as geoBoundaries, Natural Earth, OpenStreetMap, and government open data. These maps are edited visual materials, not raw data files, and are provided for education, documents, presentations, and graphic reference.