Hydroelectricity plays radically different roles across national power systems. In the verified 2021 World Bank file, 208 of 217 country/economy master rows have a numeric observation. Of those 208, 156 report a hydroelectric share above zero and 52 report exactly 0.0%. The unweighted mean is 25.1%, while the median is only 10.3%. That gap matters: a group of very high-share systems pulls the average upward, but half of the numeric observations are at or below roughly one-tenth of electricity production.
The indicator is World Bank World Development Indicators series EG.ELC.HYRO.ZS, Electricity production from hydroelectric sources (% of total). It measures the share of each country or economy’s electricity production that comes from hydroelectric sources. It does not measure installed hydro capacity, annual hydro generation in TWh, or a country’s share of global hydro output. A value of 60% means hydro supplied 60% of that system’s electricity production in the reference year.
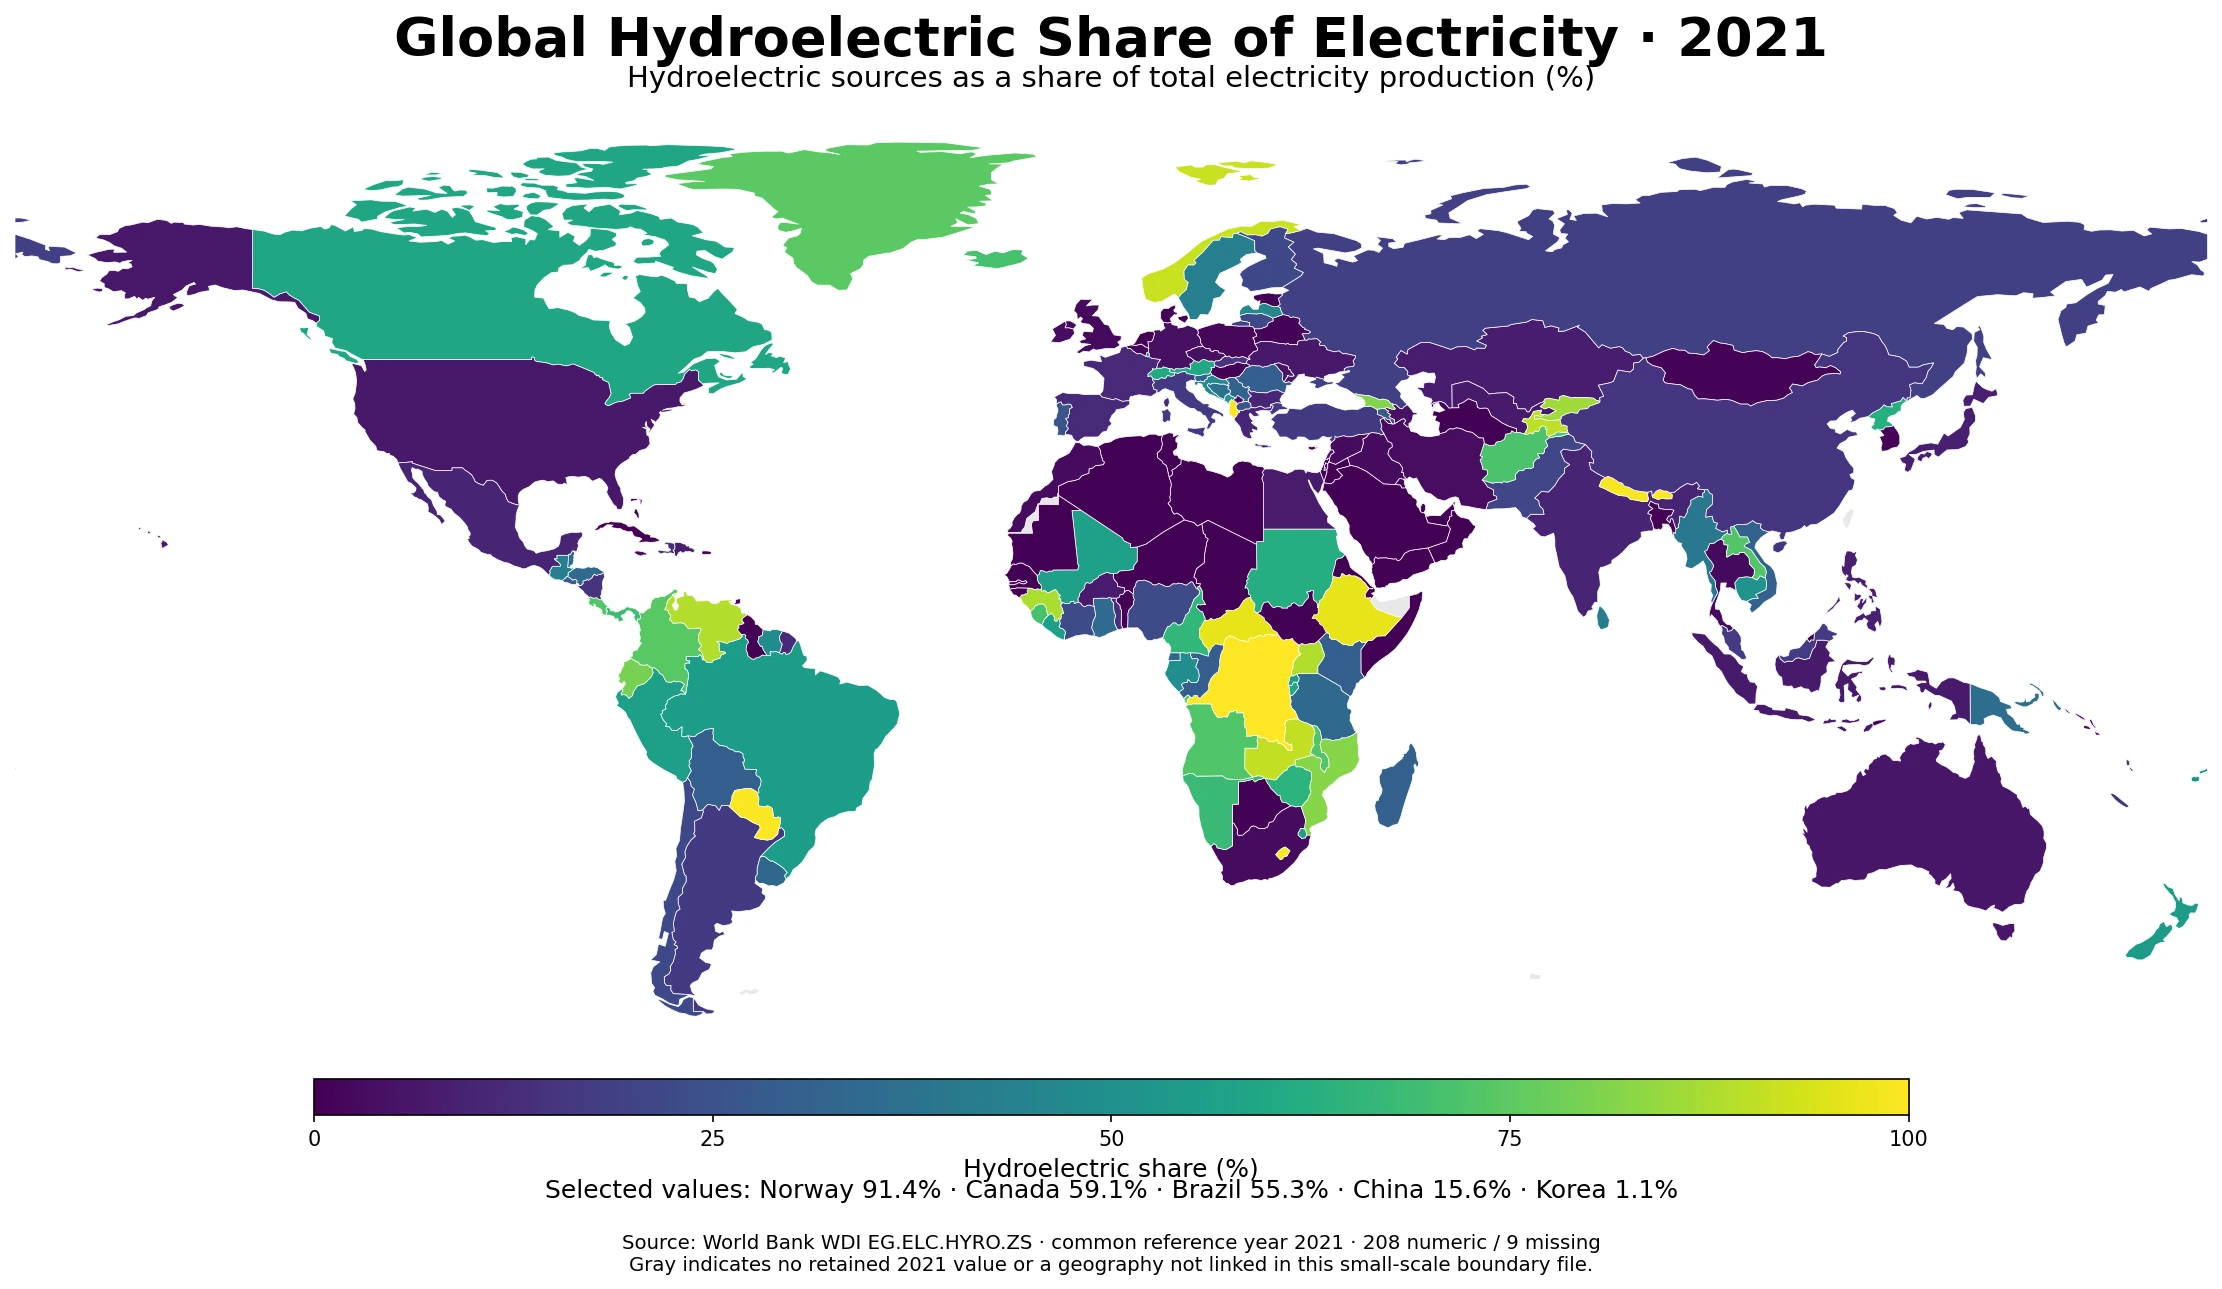
Table of Contents
The 2021 distribution stretches from zero to almost 100%
A quarter of the numeric observations, 52 of 208, are exactly 0%. Another 37 are above zero but below 5%. Twenty-five fall in the 5–15% band, and another 25 are between 15% and 30%. There are 21 observations from 30% to below 50%, 29 from 50% to below 75%, and 19 at 75% or higher. This means 48 country/economy observations get at least half of their electricity production from hydro, while 89 are below 5%. The global map therefore contains both hydro-dominant systems and systems where hydro is marginal or absent.
| 2021 hydroelectric share | Countries/economies | Share of 208 |
|---|---|---|
| 0% | 52 | 25.0% |
| >0% to <5% | 37 | 17.8% |
| 5% to <15% | 25 | 12.0% |
| 15% to <30% | 25 | 12.0% |
| 30% to <50% | 21 | 10.1% |
| 50% to <75% | 29 | 13.9% |
| 75%+ | 19 | 9.1% |
If the calculation is restricted to the 156 positive observations, the mean rises to 33.5% and the median to 25.0%. Those figures answer a different question from the all-observation average. They describe the systems that report at least some hydroelectric generation, not the entire 208-observation distribution. None of these unweighted statistics should be read as the hydro share of world electricity, because every country or economy receives one observation regardless of the size of its power market.
Bhutan, Lesotho, DR Congo, Albania, and Paraguay are above 99%
Bhutan has the highest 2021 observation at 99.99%. Lesotho is at 99.64%, the Democratic Republic of the Congo at 99.61%, Albania at 99.54%, Paraguay at 99.44%, and Nepal at 99.10%. The Central African Republic and Ethiopia are both above 96%. Norway records 91.42% and Zambia 90.66%, completing the top ten. These values show how dominant hydro is inside those electricity mixes, but they do not rank the countries by the amount of hydroelectricity generated.
| Rank | Country or economy | 2021 hydro share |
|---|---|---|
| 1 | Bhutan | 100.0% |
| 2 | Lesotho | 99.6% |
| 3 | Congo, Dem. Rep. | 99.6% |
| 4 | Albania | 99.5% |
| 5 | Paraguay | 99.4% |
| 6 | Nepal | 99.1% |
| 7 | Central African Republic | 96.2% |
| 8 | Ethiopia | 96.1% |
| 9 | Norway | 91.4% |
| 10 | Zambia | 90.7% |
A small electricity system can have a hydro share near 100% while generating less hydroelectricity in absolute terms than a much larger system with a lower percentage. The supplied dataset does not contain each country’s total electricity production, so an absolute TWh ranking would require another verified series. This article deliberately does not infer that missing denominator.
Canada and Brazil are above 50%, while South Korea is near 1%
Among large and frequently compared electricity systems, Norway stands at 91.4%, Canada at 59.1%, and Brazil at 55.3%. China is at 15.6%, France 11.5%, India 9.9%, Japan 8.5%, the United States 6.3%, Australia 5.7%, Germany 4.2%, and Korea, Rep. 1.1%. Because every value comes from the same 2021 reference year, these comparisons avoid the common problem of mixing each country’s latest available observation from different years.
| Country or economy | 2021 hydroelectric share |
|---|---|
| Norway | 91.4% |
| Canada | 59.1% |
| Brazil | 55.3% |
| China | 15.6% |
| France | 11.5% |
| India | 9.9% |
| Japan | 8.5% |
| United States | 6.3% |
| Australia | 5.7% |
| Germany | 4.2% |
| Korea, Rep. | 1.1% |
High hydro shares appear in several regions rather than one single cluster
The world map shows high-share systems across several continents. In South America, Paraguay is at 99.4%, Venezuela 88.5%, Ecuador 79.4%, Colombia 74.1%, Peru 56.0%, and Brazil 55.3%. In Africa, the Democratic Republic of the Congo is at 99.6%, the Central African Republic 96.2%, Ethiopia 96.1%, Zambia 90.7%, Uganda 87.9%, and Mozambique 82.0%. Europe includes Albania at 99.5%, Norway 91.4%, Switzerland 60.2%, and Austria 60.1%. In Asia, Bhutan is essentially 100%, Nepal 99.1%, Tajikistan 90.0%, the Kyrgyz Republic 85.6%, and Georgia 80.5%.
Those spatial patterns are descriptive, not causal. The packaged file contains the hydroelectric share but not rainfall, river discharge, reservoir storage, dam capacity, investment policy, or electricity-market structure. It would therefore be an overreach to attribute a country’s share to one geographic or policy factor from this dataset alone. The map answers where hydro has a large role in the electricity mix; explaining why requires additional primary evidence.
Hydroelectric share is not the same as capacity or generation volume
Three distinctions prevent the most common misreading of this indicator. First, it is not installed hydro capacity in megawatts. Second, it is not annual hydroelectric generation in terawatt-hours. Third, it is not a country’s percentage of global hydro production. EG.ELC.HYRO.ZS answers a composition question: what percentage of this electricity system’s production came from hydroelectric sources? That makes it especially useful for comparing electricity mixes, but insufficient for ranking absolute output.
The same caution applies when this map is compared with fossil-fuel, coal, nuclear, wind, or solar shares. Shares can illuminate dependence on different generation sources, but combining indicators requires compatible definitions and reference years. This article does not force unrelated series into a synthetic 100% total. It stays within the verified hydro series supplied in the package.
A reported 0.0% is different from a missing 2021 observation
Nine master rows have no retained 2021 value: Bermuda, the Channel Islands, Gibraltar, the Isle of Man, Liechtenstein, Macao SAR, Monaco, the Northern Mariana Islands, and San Marino. They remain missing rather than being converted to zero or filled with another year. The 52 zero-share rows, by contrast, are numeric 0.0% observations in the cleaned file. This distinction matters on a map, where a geography with no retained value should not be interpreted as evidence of zero hydroelectric production.
Why the comparison holds every observation to 2021
The collection rule behind this package chooses the latest single year that reaches at least 80% coverage across the country/economy master rather than mixing each geography’s latest year. For EG.ELC.HYRO.ZS, 2021 provides 208 numeric observations out of 217 rows, or 95.9% coverage. A fixed reference year makes the cross-country map internally consistent. Later values may exist for individual countries, but they are outside this common-year snapshot and are not silently substituted.
Data source and calculation method
The primary source is World Bank WDI EG.ELC.HYRO.ZS. The cleaned package excludes World Bank regional and income aggregates while retaining a 217-row country/economy master, including separately reported territories where applicable. All 208 numeric 2021 values are used as supplied, and nine source-missing rows remain missing. The mean, median, threshold counts, top-ten ranking, and selected-country comparisons in this article are calculated directly from that CSV. The map is an original rendering that joins the verified ISO3 values to country boundaries; no third-party article map or graphic was copied.
Frequently Asked Questions
Which country had the highest hydroelectric share of electricity in 2021?
Bhutan has the highest observation in the verified file at 99.99%, followed by Lesotho, the Democratic Republic of the Congo, Albania, and Paraguay, all above 99%.
What was South Korea’s hydroelectric share in 2021?
Korea, Rep. records 1.08% in World Bank WDI series EG.ELC.HYRO.ZS. This is the share of national electricity production from hydro, not a share of global hydro output.
Does a high hydroelectric share mean a country generates more hydroelectricity in absolute terms?
Not necessarily. This indicator is a percentage of each electricity mix and does not include total electricity generation or hydro output in TWh.
Why does this map use 2021 for every country?
The package selects the latest single year with at least 80% coverage. The 2021 snapshot contains 208 numeric observations out of 217 master rows, about 95.9% coverage.
Related Maps
Green Map creates custom-edited map images using open geographic data sources such as geoBoundaries, Natural Earth, OpenStreetMap, and government open data.
These maps are edited visual materials, not raw data files, and are provided for education, documents, presentations, and graphic reference.