You can download four high-resolution JPG maps of Gregory County from this page in one ZIP file: a general county map, a ranked city-distribution map, a terrain-and-water map, and an elevation map. Gregory and Burke are the easiest places to use as anchors, with Dallas farther west and Bonesteel and Fairfax toward the southeast. The general map also labels numbered routes including 44, 47, 251, 15, 11, US 18, and US 281. On the other maps, a dense network of creeks runs toward the broad, curving water edge along the northeast and east, while elevation drops from the western and southwestern interior toward those lower river-side valleys.
The county outline is one of the first things worth noticing. Its west and south sides are comparatively straight, but the northeastern and eastern boundary bends repeatedly around a broad body of water. That curve changes the width of the county from north to south and makes the eastern settlements and drainages feel much closer to the water than Gregory or Dallas in the west. Matching that outline across all four maps makes it easier to understand where roads, towns, creeks, and lower terrain sit in relation to one another.
The elevation map adds another strong visual cue. Its legend gives an actual range of about 375 to 718 meters and a mean of about 588 meters. Brown and tan terrain dominates much of the west and southwest, while green lowlands trace the curving eastern edge and many of the valleys feeding toward it. The water map explains why that lower ground is so finely divided: Bull Creek, Lone Tree Creek, Ponca Creek, Murphy Creek, the Whetstone Creek forks, and many smaller tributaries cut through the county.
Table of Contents
Start with Gregory, Burke, and the main numbered roads
Gregory appears in the western half of the county, close enough to the west boundary that Dallas is only a short distance farther west on the map. Burke lies southeast of Gregory and is another useful orientation point because several mapped routes pass through or near it. Herrick and St Charles continue farther southeast, while Bonesteel and Fairfax sit closer to the county’s southeastern end. Seen together, these places form a broad west-to-southeast spread rather than a tight cluster around one center.
The route labels help organize that spread. Route 44 crosses the northern part of the map, 15 and 251 are shown on the western side, and 47 runs north-south near Burke. Route 11 follows the southern part of the county, while US 18 and US 281 appear in the southeast. The map is not intended to replace a turn-by-turn road map, but it gives a clear county-level picture of which settlements lie near the principal numbered roads and how those roads approach the curved eastern boundary.
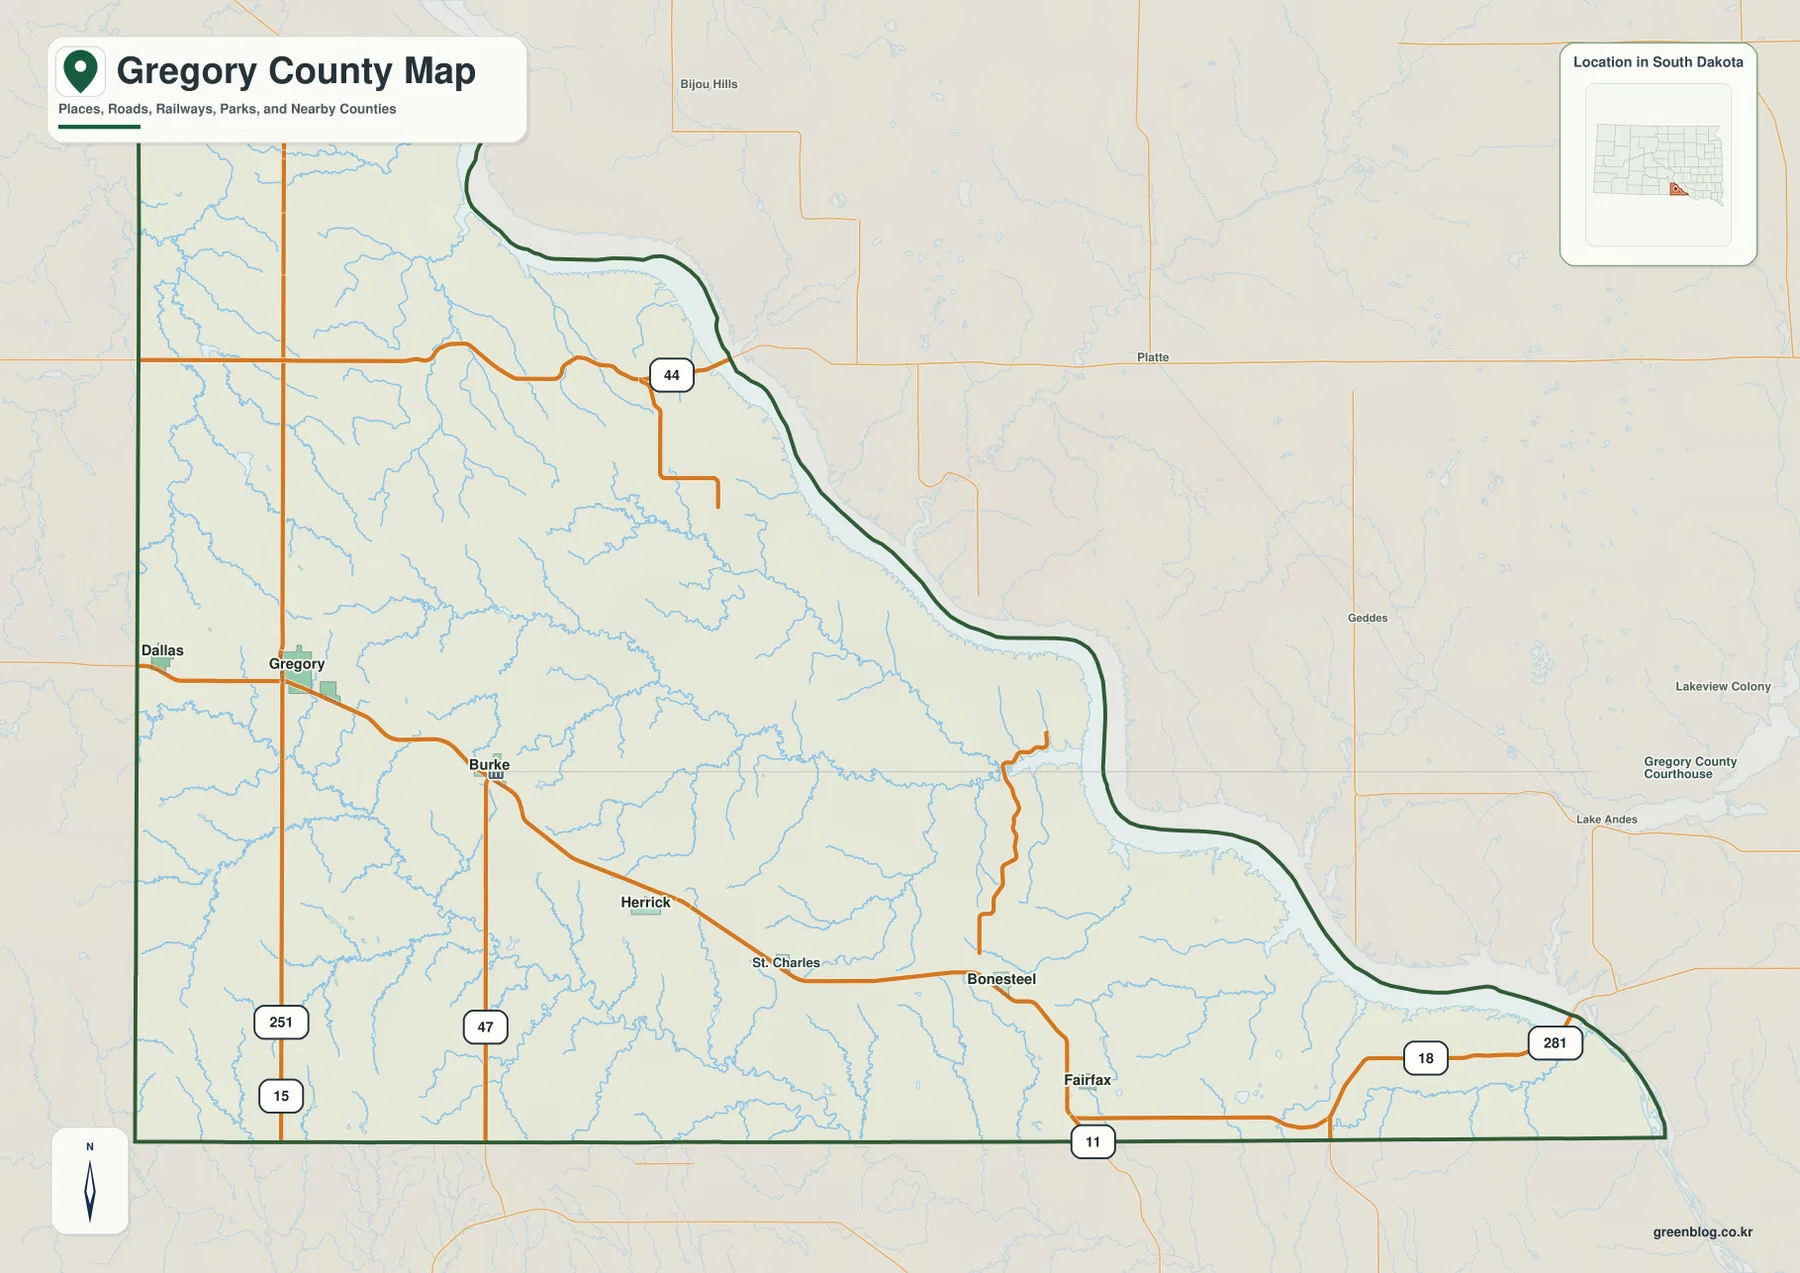
Following the county line is especially useful on the east side. The boundary sweeps south in a long curve beside the broad water body, then continues toward the southeast corner. Small streams approach that edge from the interior, and the land surface becomes more dissected as it nears the water. Looking at the outline before switching to the water and elevation maps prevents the eastern valleys from being mistaken for features outside Gregory County.
Six mapped communities stretch from the western edge to the southeast
The city-distribution map highlights Gregory, Burke, Bonesteel, Fairfax, Dallas, and Herrick. Gregory is in the western part of the county and Dallas is still farther west, close to the boundary. Burke shifts the pattern southeast, Herrick lies farther along that direction, and Bonesteel and Fairfax occupy the southeastern side. The arrangement is useful because it shows that the county’s main mapped communities are not evenly spaced or centered on a single east-west line.
This city map does not draw connector lines between the communities and it does not print distance values. It should therefore be used for relative position rather than mileage or driving-time estimates. Labels outside the county show Tripp County to the west, Lyman and Brule Counties to the north, Charles Mix and Douglas Counties to the east, and Aurora County to the southwest. Those neighboring labels provide extra orientation without turning the map into a road-distance chart.
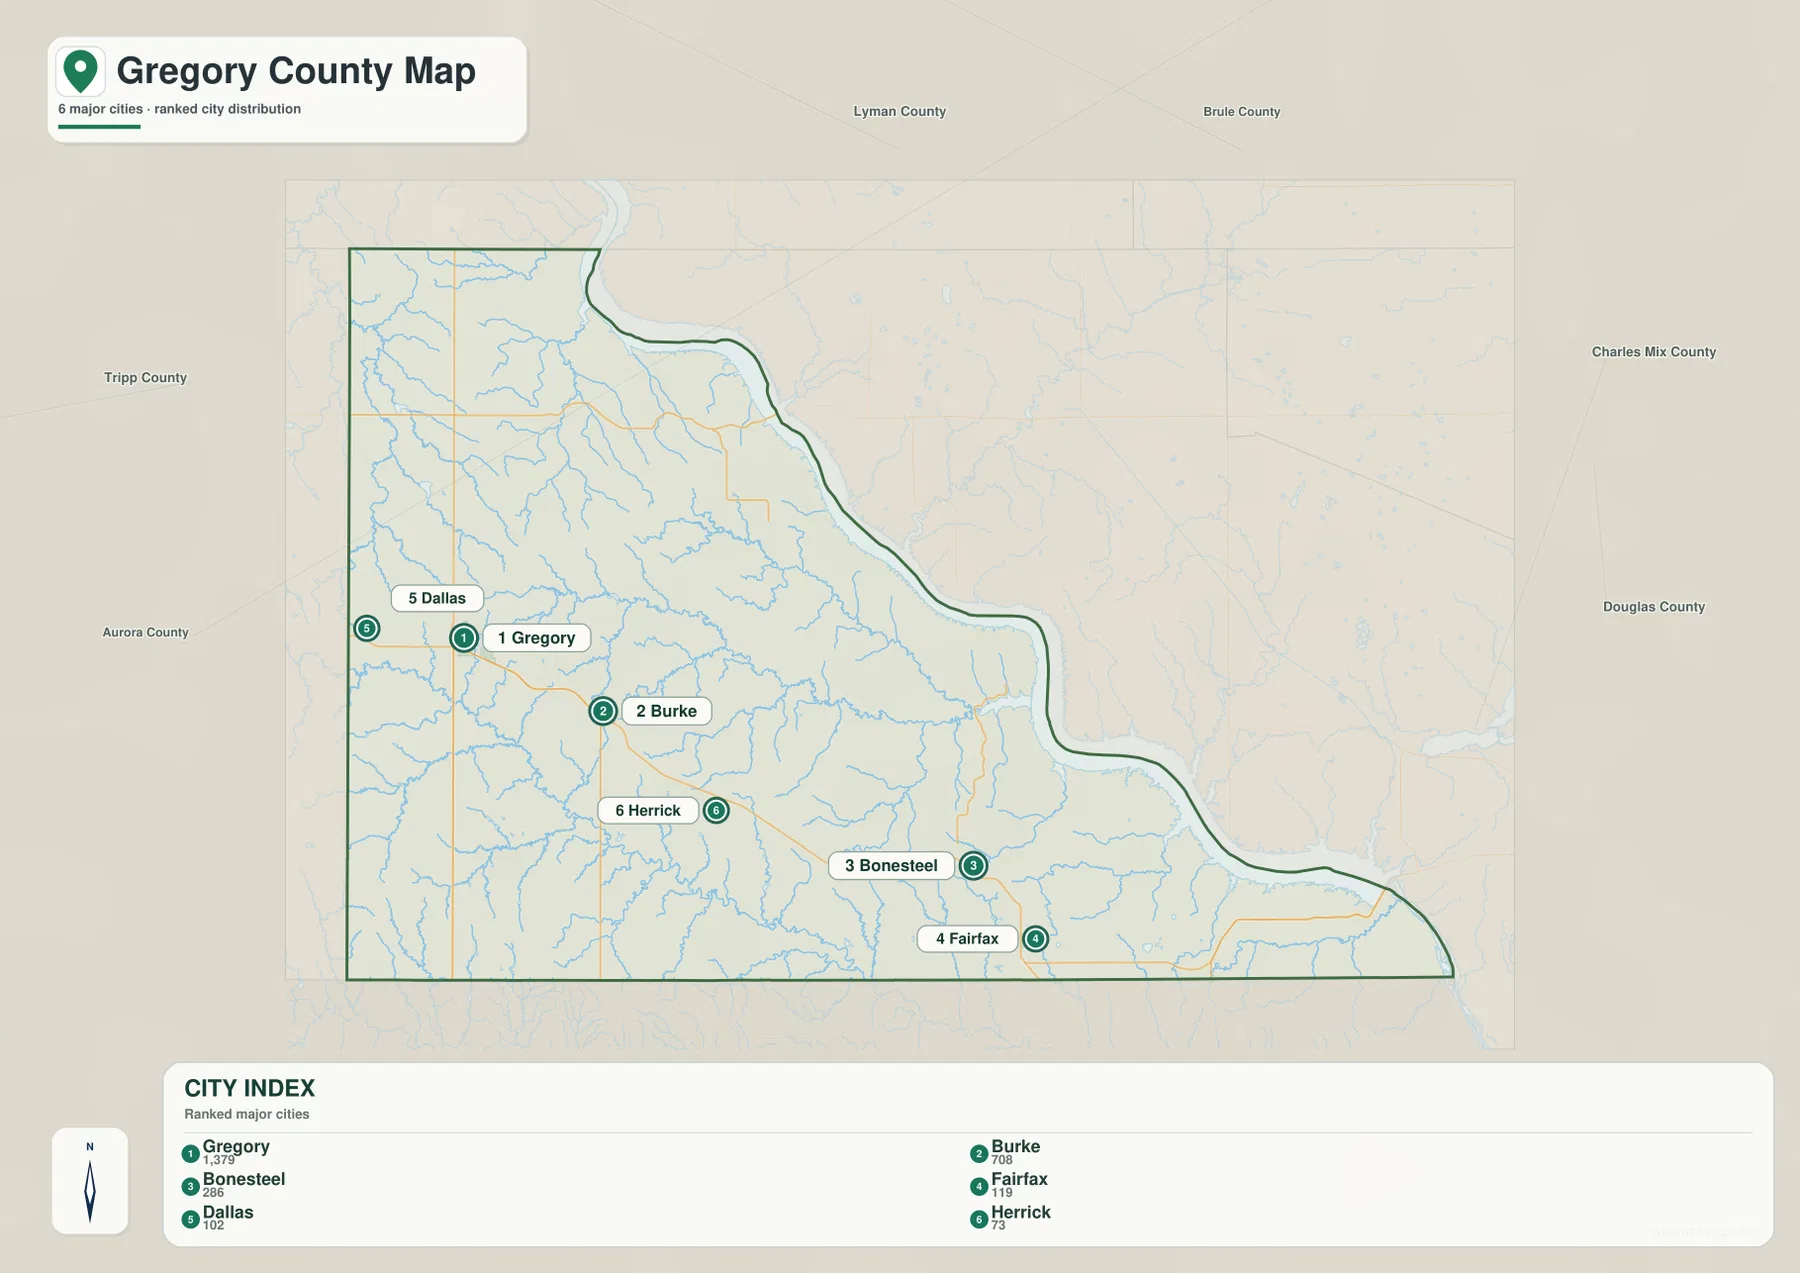
Using the city map together with the general map makes the road network easier to read. Gregory and Burke are practical reference points for the western and central-southern parts of the county, while Bonesteel and Fairfax bring the eye much closer to the eastern water boundary. Dallas, by contrast, is separated from that lowland edge by a broad area of higher interior terrain. That west-to-east change becomes even clearer once the water and elevation layers are considered.
Creeks, small lakes, and bays break up the eastern half of the county
The terrain-and-water map shows a much denser drainage network than the road map. Bull Creek and Lone Tree Creek are labeled in the northwest, while Masdon Creek, Ponca Creek, and Murphy Creek appear farther south and through the interior. In the eastern half, South Fork Whetstone Creek and North Fork Whetstone Creek bend toward Whetstone Bay. Numerous smaller, unnamed tributaries fill the spaces between these labeled channels, especially near the lower eastern edge.
Several named water bodies give the eastern side additional landmarks. Whetstone Bay is joined by Odenbach Bay and Joe Days Bay along the broad water boundary. Inside the county, Lake Burke, Lake Berry, Indian Lake, and Fairfax Lake are also labeled. These features make it possible to compare settlements with nearby water: Burke can be located relative to Lake Burke, Fairfax relative to Fairfax Lake, and the southeastern communities relative to the bays and tributaries closer to the county line.
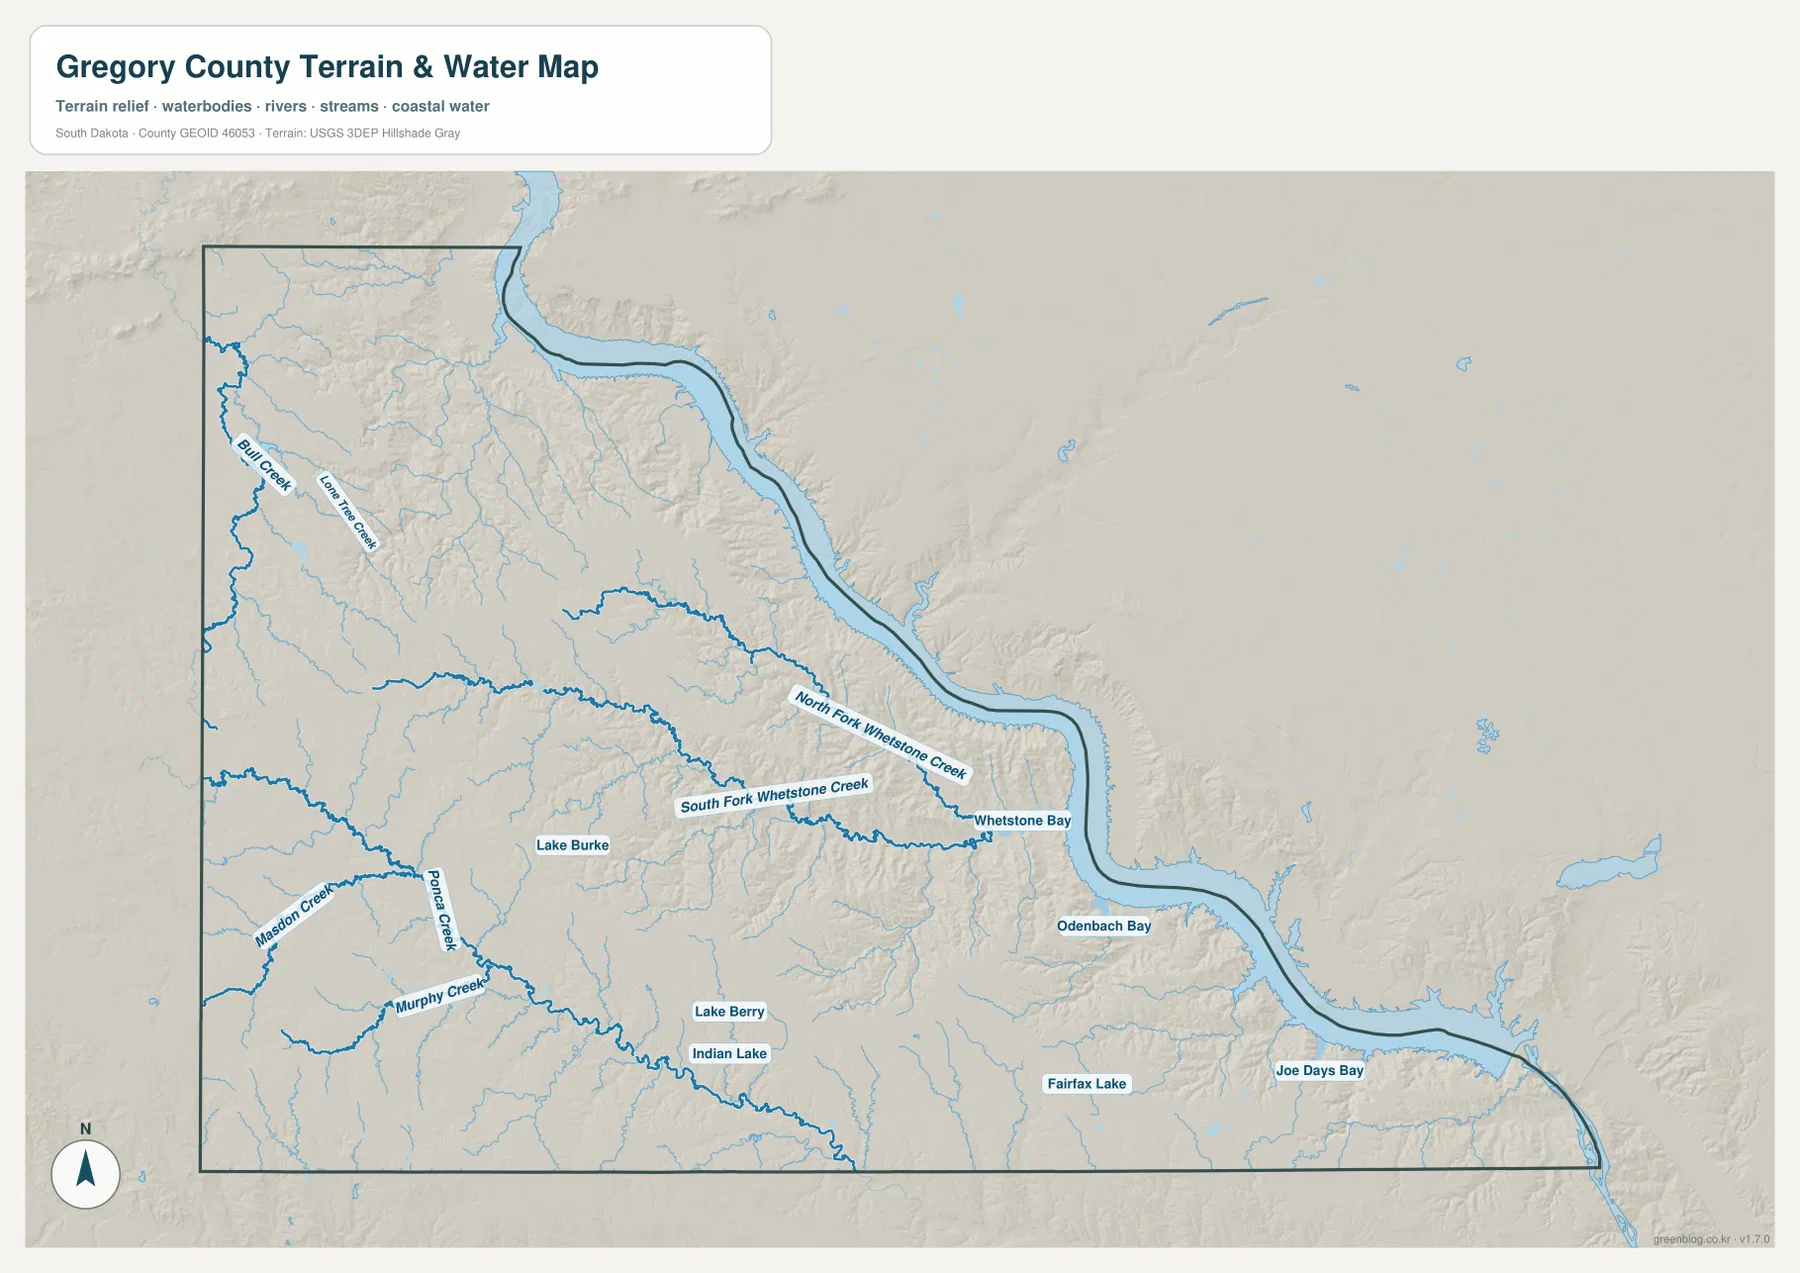
This is a reference map for the names and relative positions of waterways and terrain. It does not show flood probability, water depth, navigation conditions, legal shoreline boundaries, or parcel ownership. Readers who need detailed or current hydrography should use an official source such as USGS National Hydrography. The discussion here stays with the names and forms visible in the supplied map rather than adding water features that are not shown.
Elevation falls from the western uplands into the river-side valleys
On the elevation map, the western and southwestern interior is dominated by brown and tan colors, indicating the county’s higher ground. Moving northeast and east, those colors give way to yellow-green and then deeper green along the curved water boundary. The legend reports an actual elevation range of roughly 375–718 meters, with a mean of about 588 meters. That span is large enough to make the county’s west-to-east relief obvious even before individual valleys are examined.
The transition is not a smooth, straight slope. Narrow green valleys branch into the higher interior, creating a deeply textured edge between uplands and lowlands. When the elevation map is compared with the water map, many of these lower lines correspond to the major creek systems and their tributaries. The northeast shoreline is lined by a long low green zone, while the west and southwest retain broad patches of higher terrain interrupted by creek valleys.
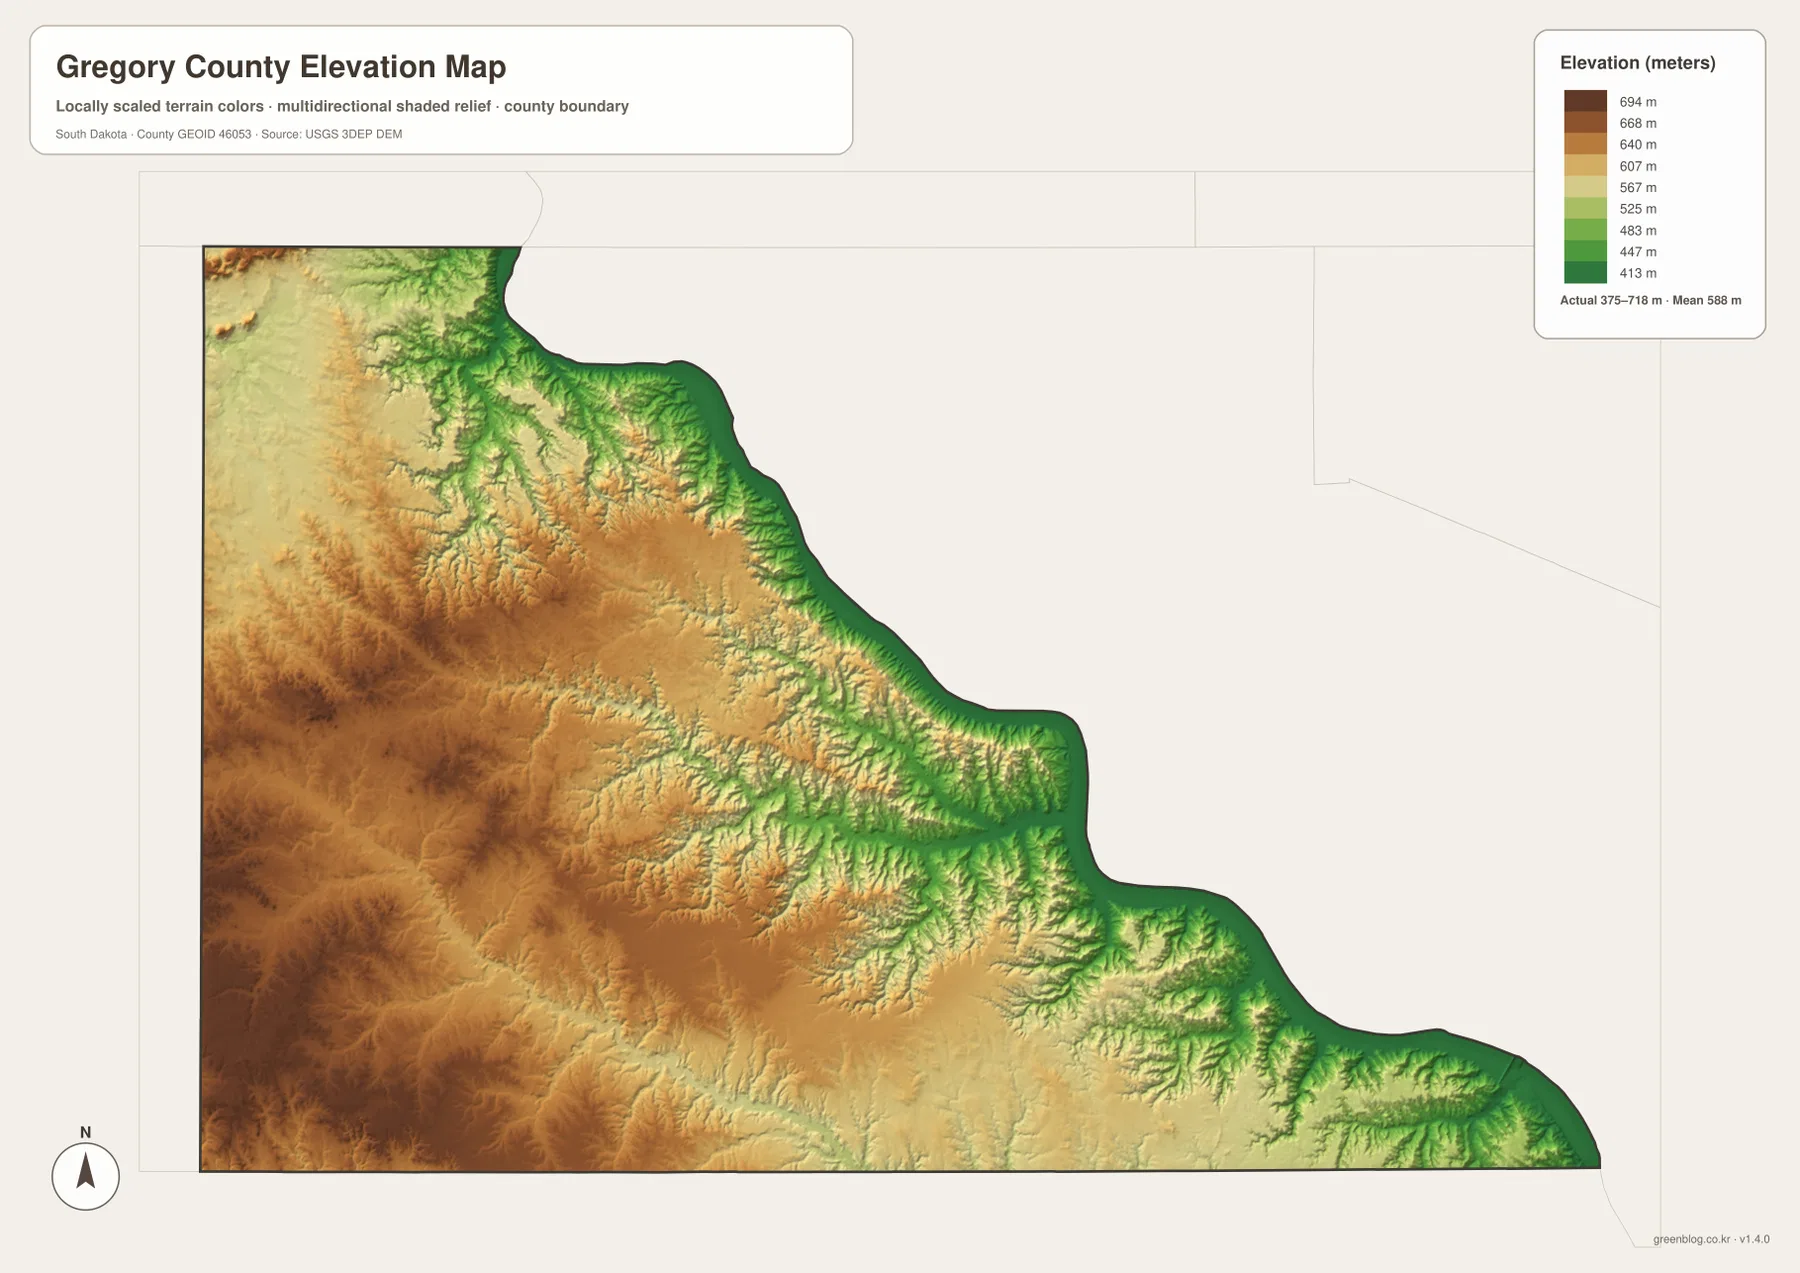
The elevation surface is intended for county-scale comparison, not survey or engineering measurement. Shaded relief makes ridges and valleys easier to see, but it should not be treated as an exact elevation reading for a road, building, or field. For precise elevation data, the USGS 3D Elevation Program is the appropriate source. This map is most useful for understanding why the western communities sit within higher terrain while the eastern creek network approaches a much lower water-side corridor.
Use the same landmarks to compare roads, water, and relief
A simple way to use the set is to keep Gregory and Burke as fixed landmarks. Find them first on the road map, then locate the same part of the county on the city map. From there, move to the water map to see Ponca Creek, the Whetstone Creek forks, and the eastern bays, and finally check the elevation map to see whether the same area lies in the higher brown interior or the lower green valleys. This sequence connects information that would be easy to miss if each map were read in isolation.
The eastern side can also be read in reverse. Start with Whetstone Bay, Odenbach Bay, and Joe Days Bay on the water map, then follow the curved county edge back to the general map. The elevation map shows why the land next to that boundary is consistently lower and more cut by valleys. In the west, Dallas and Gregory work as the equivalent reference points: their positions can be matched with the higher upland colors before following creeks eastward.
Each map is strongest for a different task. The general map is the quickest choice for roads, settlements, and the county outline. The city-distribution map simplifies the relative placement of the six highlighted communities. The terrain-and-water map is best for named creeks, bays, lakes, and drainage corridors, while the elevation map makes the western uplands and eastern lowlands immediately visible. Together they describe the same Gregory County from complementary viewpoints without requiring the reader to infer features that are not actually mapped.
Download the high-resolution Gregory County map files
The WebP images in the article are sized for quick viewing on the page. For printing, classroom work, presentations, or closer inspection, the ZIP below contains the original high-resolution JPG versions. All four files are 3638 × 2572 pixels and use the same county boundary, making it straightforward to compare roads and communities with waterways and elevation.
Frequently Asked Questions
Where are Gregory and Burke on the map?
Gregory is in the western part of the county, with Dallas still farther west near the boundary. Burke lies southeast of Gregory and is easy to locate near the north-south route labeled 47. On the city-distribution map, the two places help divide the western and central-southern portions of the county before the pattern continues toward Herrick, Bonesteel, and Fairfax.
Which waterways are labeled on the Gregory County water map?
The supplied map labels Bull Creek, Lone Tree Creek, Ponca Creek, Murphy Creek, and the North and South Forks of Whetstone Creek. It also identifies Whetstone Bay, Odenbach Bay, Joe Days Bay, Lake Burke, Lake Berry, Indian Lake, and Fairfax Lake. The map is designed to show relative water locations and terrain rather than flood, navigation, or legal-boundary information.
What does the elevation map show about Gregory County?
The legend shows an actual range of approximately 375–718 meters and a mean of about 588 meters. Higher brown and tan terrain covers much of the west and southwest, while lower green valleys follow the northeastern and eastern water edge and many creek channels. The map is useful for county-scale relief comparison but is not a substitute for survey-grade elevation data.
Map File Information
The ZIP contains high-resolution JPG originals of the Gregory County general map, city-distribution map, terrain-and-water map, and elevation map.
- Printable Size: 3638 × 2572 px each
Related Maps
Sources and references
- U.S. Census Bureau TIGER/Line Shapefiles – official boundary and geographic reference data.
- USGS National Hydrography – official U.S. hydrography and surface-water reference data.
- USGS 3D Elevation Program – official elevation and terrain source data.
Green Map creates custom-edited map images using open geographic data sources such as geoBoundaries, Natural Earth, OpenStreetMap, and government open data.
These maps are edited visual materials, not raw data files, and are provided for education, documents, presentations, and graphic reference.