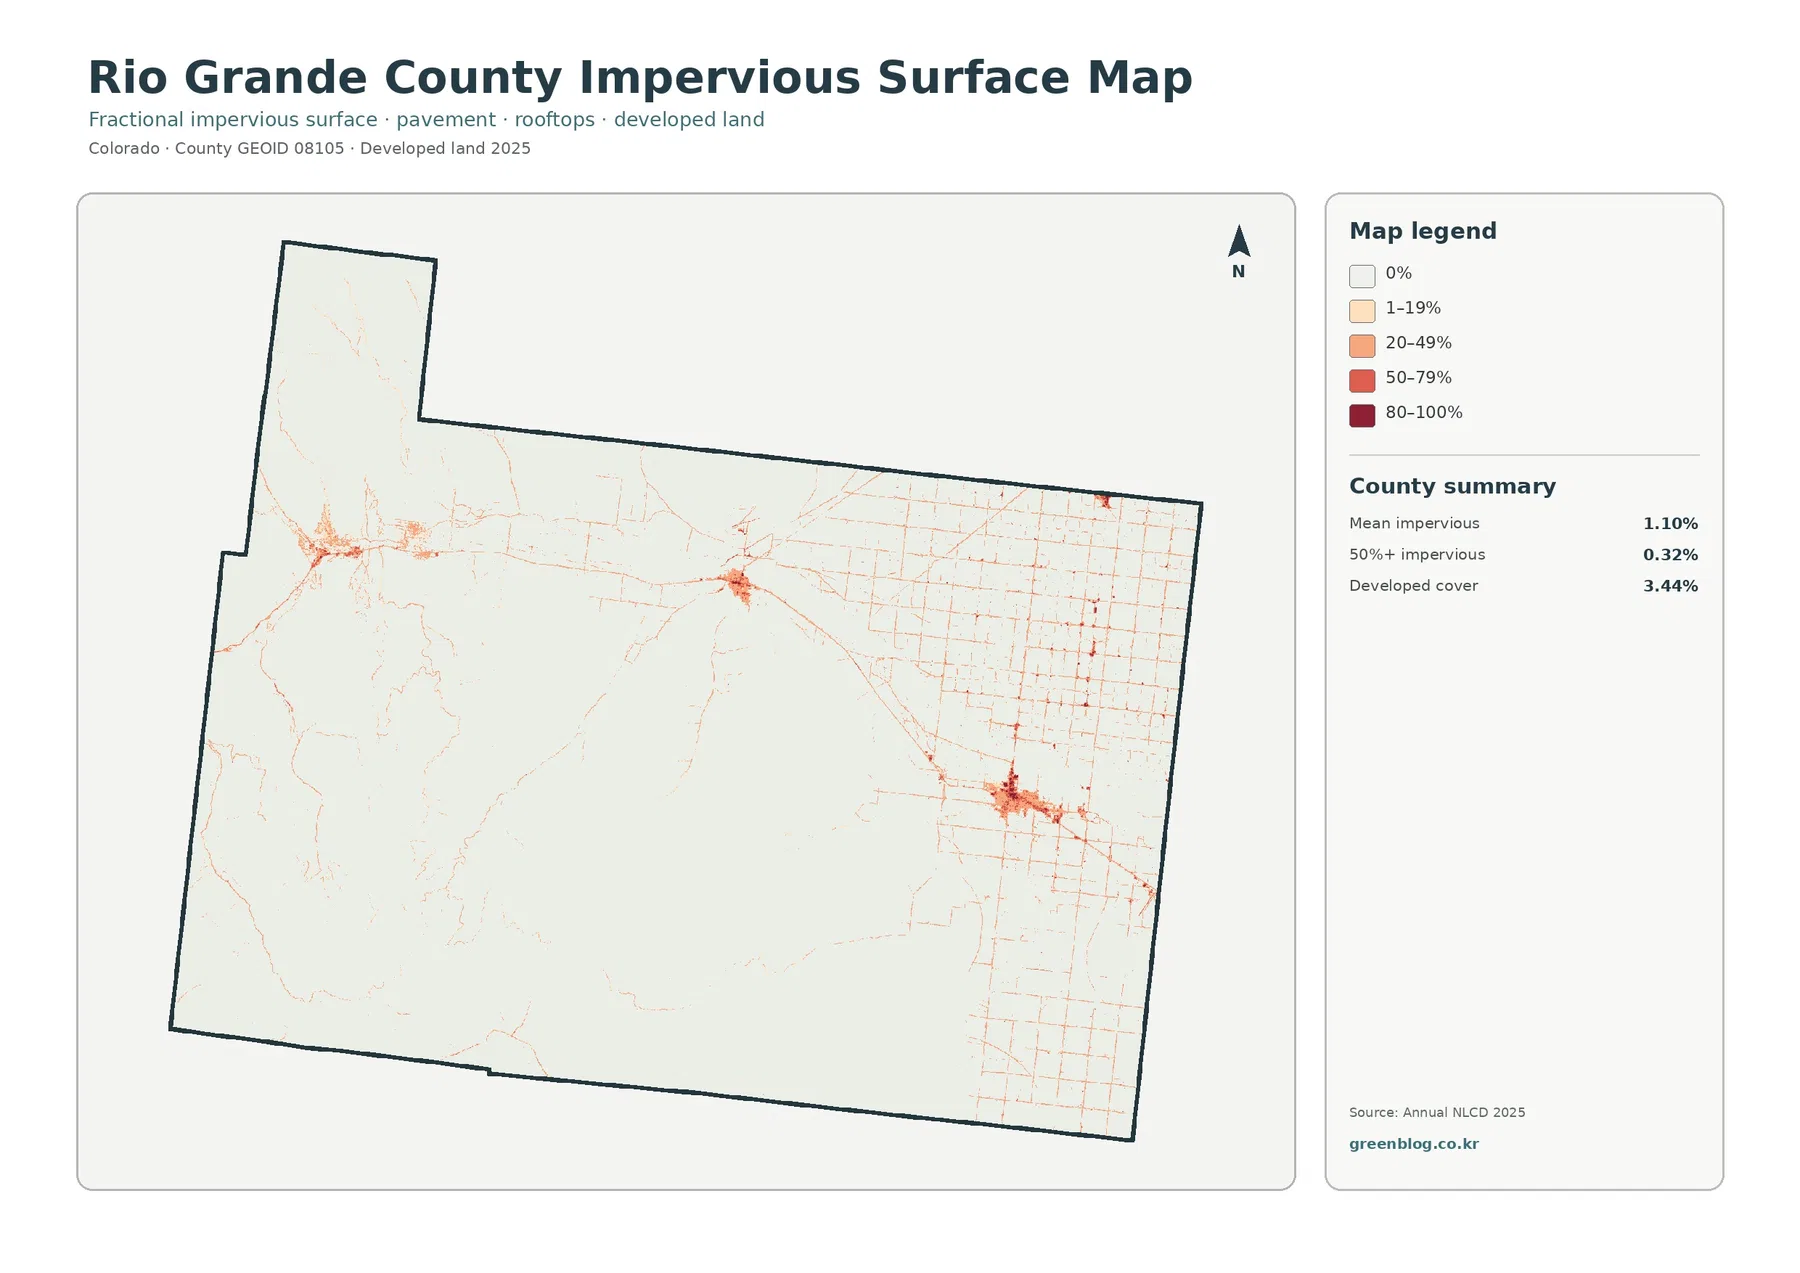
Rio Grande County has a sharply divided 2025 land-cover pattern. Forest occupies 35.39% of the county and shrubland 34.32%, while agriculture accounts for 15.98%. The western and southern portions are dominated by broad forest cover, the middle contains extensive shrubland, and the eastern side is marked by a dense pattern of agricultural fields. Wetlands add another 7.14%, creating a second important pattern around and between the eastern farm areas.
This page compares four views of that same county: current land cover, forest and farmland, impervious surface and developed land, and mapped class differences between 1985 and 2025. The four original JPG maps are available together in one ZIP below, so the same set can be used for classroom reference, county comparisons, environmental presentations, or closer visual study.
Table of Contents
The county changes from broad natural cover to a field-dominated eastern side
The general land-cover map gives the clearest overview. Forest is concentrated across much of the west and south, while shrubland fills large parts of the center and north. Agriculture becomes increasingly prominent toward the east, where repeated yellow field shapes form a much more regular texture than the natural cover on the other side of the county.
Forest and shrubland together represent almost seven-tenths of the mapped area. Their percentages are close, but their locations are not interchangeable. Forest forms larger continuous green areas in the western and southern portions, whereas shrubland occupies a broad middle zone and extends toward the agricultural side. That separation is more informative than simply ranking the classes by percentage.
Agriculture covers 15.98% and is strongly concentrated rather than evenly scattered. Many agricultural patches on the eastern side have rectangular or near-circular shapes, while smaller bands extend into the central part of the county. These are land-cover classifications derived from imagery. They should not be treated as parcel boundaries, farm ownership lines, or a count of active farms.
Wetlands account for 7.14%, a substantial share compared with many of the smaller classes in the summary. They appear most often in the central-to-eastern and southeastern portions of the map, including broad patches around agricultural cover. Water itself is only 0.11%, so the wetland layer carries much more of the visible water-related pattern than open water does.
Developed land is 3.44%. It appears as several compact red concentrations rather than one continuous urban area, with smaller lines and patches extending through the more heavily farmed side of the county. Grassland is 2.96% and is mixed through the transition between forest, shrubland, agriculture, and wetlands rather than forming the dominant countywide cover.
Impervious surfaces reveal where built areas are actually concentrated
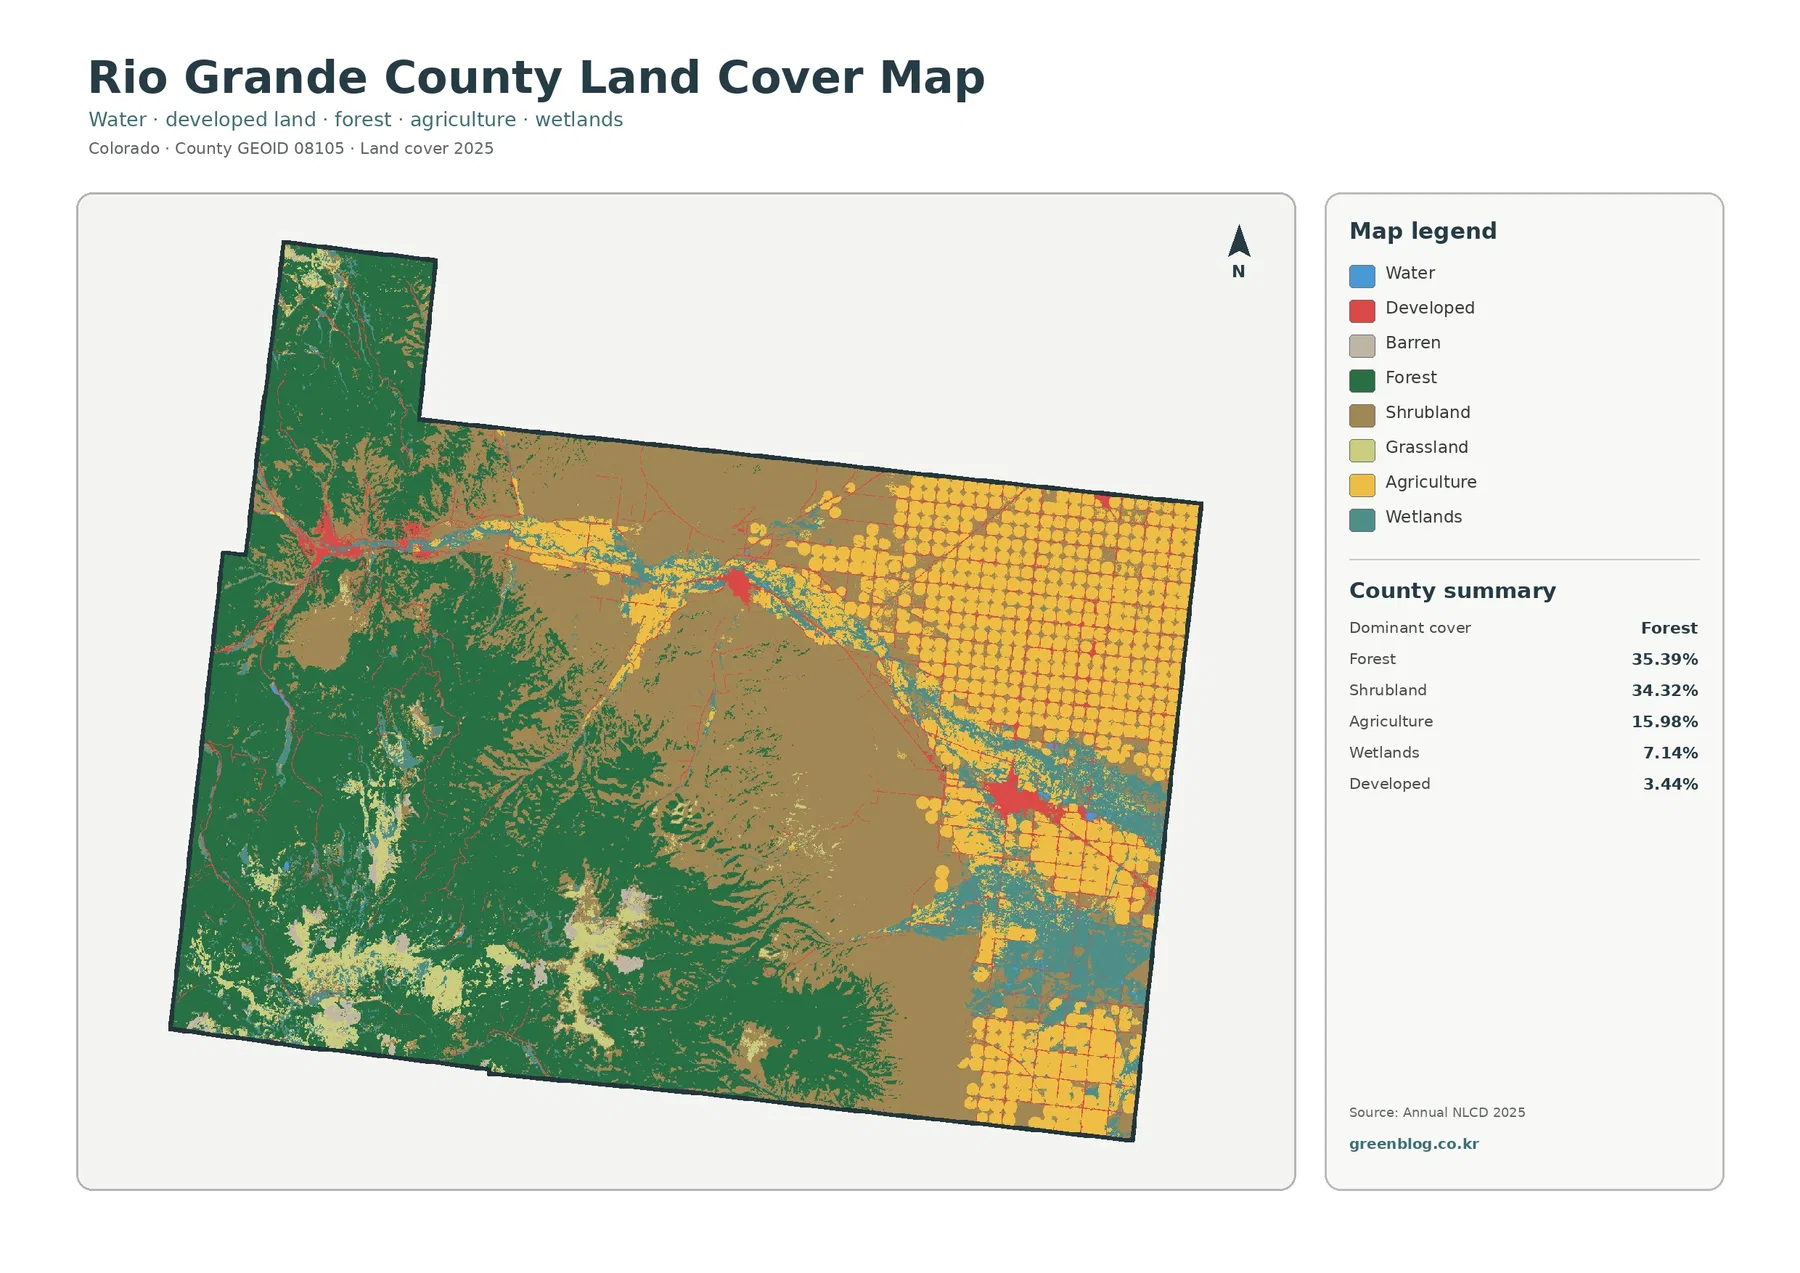
The impervious-surface map isolates hard surfaces such as pavement and rooftops. Rio Grande County has a mean impervious value of 1.10%, and only 0.32% of the county is mapped at 50% impervious or higher. Those numbers are consistent with a county where broad natural and agricultural surfaces cover far more land than dense built surfaces.
Several compact concentrations stand out on the map, roughly aligned through the central part of the county and into the eastern agricultural zone. Thin linear features also cross the farmed area, but most of the map remains in the lowest impervious classes. The contrast is especially strong when this image is compared with the general land-cover map, where developed land occupies 3.44% but does not indicate how much of each developed cell is actually hard surface.
A developed land-cover class and an impervious percentage answer different questions. A developed cell may include vegetation, bare ground, and other permeable surfaces along with pavement or buildings. The impervious layer focuses on the fraction of hard surface within the mapped cell. This is why the countywide mean of 1.10% can be much lower than the 3.44% developed-cover share.
The map is useful for locating broad concentrations of built surface, not for measuring individual roads or buildings. It does not show zoning, ownership, drainage capacity, building permits, or development rights. Those questions require separate administrative or site-specific data.
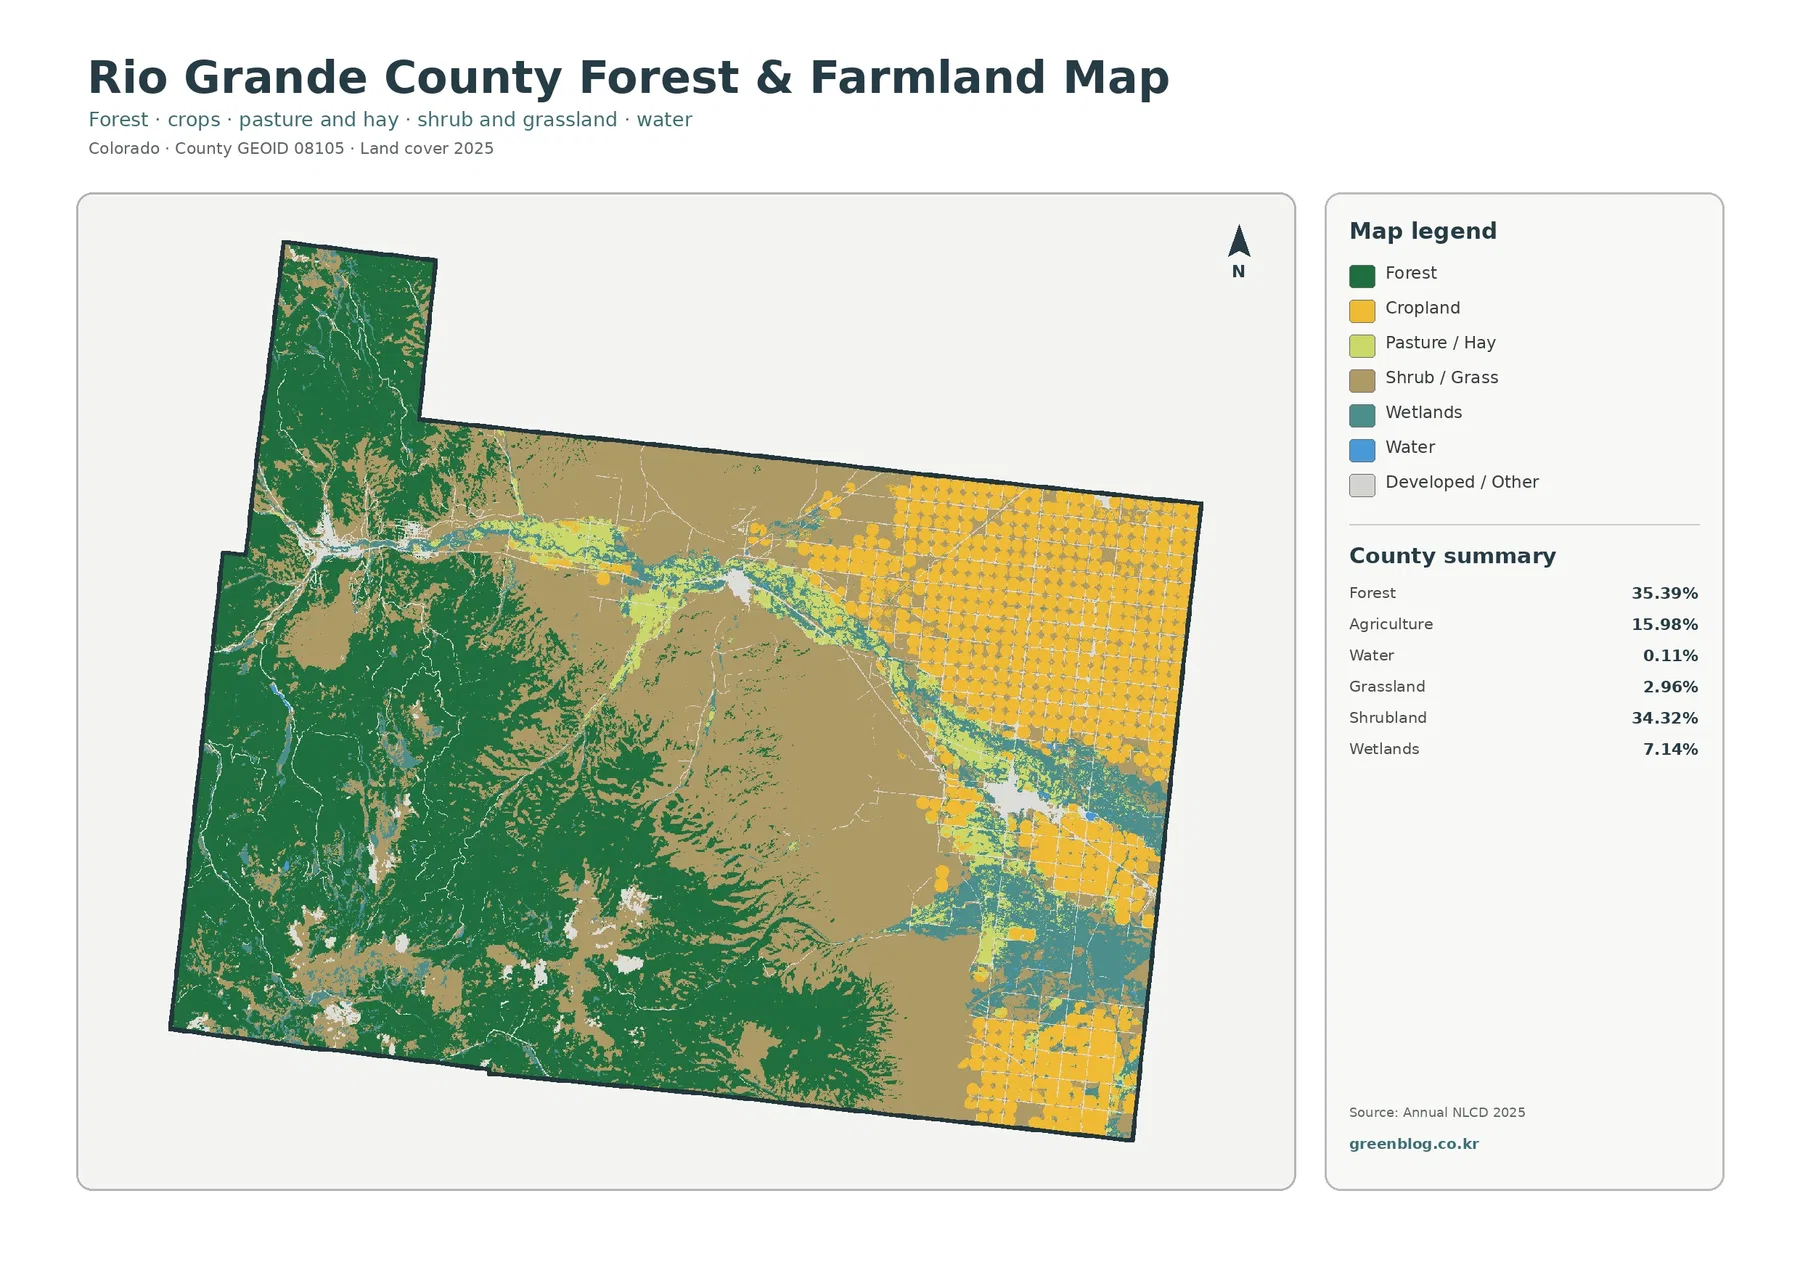
The forest and farmland view simplifies the east-west contrast
The forest-and-farmland map reduces some of the detail in the full legend and makes the main contrast easier to follow. Forest still dominates much of the western and southern area. Cropland and other agricultural cover stand out in the east, where the repeated field pattern creates the most structured part of the image. Shrub and grass cover fills much of the broad middle ground between those two major zones.
Agricultural cover is not a measure of legal land use. The 15.98% figure represents cells classified in agricultural categories for the mapped year. Land used for grazing can appear in another cover class, and an agricultural parcel can contain non-agricultural surfaces. The map is best read as a picture of what the surface looked like to the classification system, not as a cadastral or land-use inventory.
Wetlands remain visually important in this simplified version. Teal patches are especially noticeable among the farmed areas in the east and southeast, and a narrower band continues through the central portion. Because wetlands cover 7.14%, they are not merely isolated specks on the map. They form a meaningful part of the transition between agriculture, shrub or grass cover, and the small amount of open water.
Forest edges are more complex than a single clean line. Green areas break into shrub and grass cover in parts of the center, and small non-forest patches interrupt some otherwise broad forested areas. Raster mapping assigns a representative class to each cell, so edges can include mixed pixels where several surface types occur together. That limitation matters most when interpreting narrow features or detailed boundaries.
1985–2025 differences are concentrated in several distinct patterns
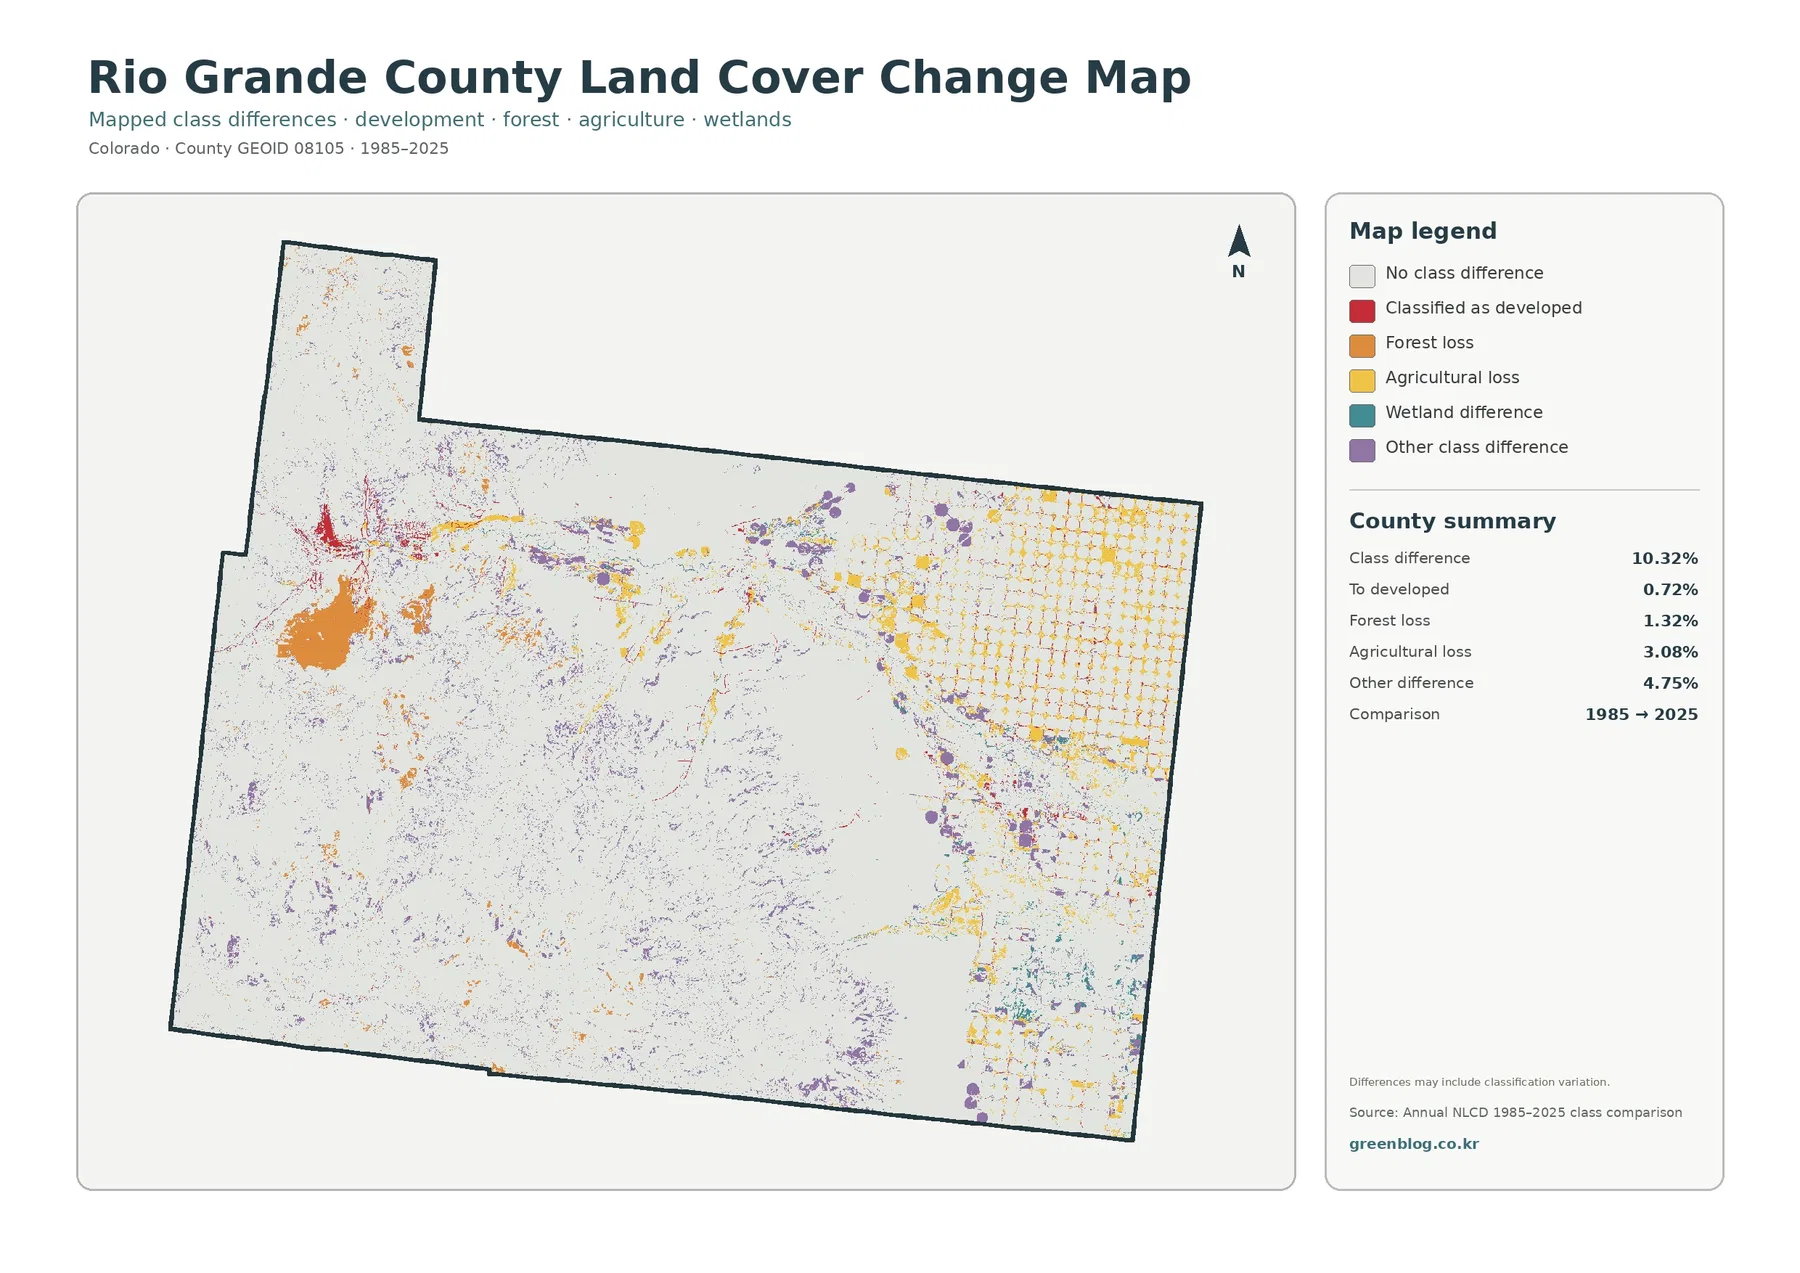
The change map compares the class assigned to the same location in 1985 and 2025. The county summary reports 10.32% class difference overall. Within that total, 0.72% is mapped as changed to developed, 1.32% as forest loss, 3.08% as agricultural loss, and 4.75% as other class difference. These categories describe classification differences between two dates; they are not direct measures of permanent damage.
Agricultural-loss cells are especially visible in the eastern grid, where yellow patches repeat across the same area that still contains extensive agriculture in 2025. A cell in that category indicates that its class differed between the two comparison years. It does not prove that farming stopped permanently, and it does not provide the reason for the change.
A larger orange forest-loss patch appears in the western portion, while smaller orange areas occur elsewhere near forest boundaries. Purple other-difference cells are scattered more broadly through the center and east. These patterns are useful for identifying places that deserve a closer look, but they need intermediate-year imagery or other records before a cause can be assigned.
Red cells classified as changed to developed are limited in area and tend to occur near the same compact concentrations that are strongest on the impervious-surface map. Comparing those two views can help separate current hard-surface concentration from broader historical class differences. The 0.72% developed-change figure is therefore best treated as a mapped category, not as a county growth rate.
Classification can change because the land surface changed, but it can also be affected by imagery date, vegetation condition, mixed cells, and classification behavior. For that reason, the 10.32% figure should never be rewritten as ‘10.32% of the county was damaged’ or ‘10.32% was developed.’ It is a screening measure for class difference between the two mapped years.
A practical way to compare the four maps
Start with the general land-cover map when the goal is to understand the county as a whole. It establishes the dominant forest and shrubland, the concentrated agricultural east, and the large wetland share. Then use the forest-and-farmland map to simplify that pattern and see the separation between the greener western and southern areas and the more regular eastern field pattern.
The impervious layer is most useful after the general map because it answers a narrower question: where are hard built surfaces concentrated? It makes several compact developed areas easier to find and shows that most of the county remains at very low impervious levels. The change map belongs last in the sequence because its colors only make sense after the current cover has been understood.
- Use the 2025 land-cover map for the full mix of forest, shrubland, agriculture, wetlands, developed land, grassland, and water.
- Use the forest-and-farmland map when the eastern farm pattern and the broad western and southern forest areas are the main comparison.
- Use the impervious-surface map to locate concentrated pavement and rooftops rather than relying only on the broader developed-land class.
- Use the 1985–2025 change map to locate cells with different classifications between the two dates, then compare those locations with the current maps before drawing conclusions.
All four images are generalized raster maps. Small roads, narrow channels, individual buildings, tiny wetlands, and parcel edges can be smaller than the mapped cells or mixed with neighboring cover. The maps are therefore appropriate for county-scale explanation and comparison, not for surveying, property boundaries, or site-level regulatory decisions.
The current maps represent 2025. Any change after that observation year will not appear in the 2025 layers. When a recent or site-specific decision depends on current conditions, the map should be supplemented with newer imagery, field information, or the appropriate local records.
Download the four Rio Grande County JPG maps
The ZIP below contains the four original JPG maps discussed on this page: 2025 land cover, forest and farmland, impervious surface and developed land, and the 1985–2025 class-difference map. Each image is 2480×1754 pixels. The supplied asset manifest does not mark these files as meeting its A3 high-resolution reference, so very large printing or detailed analytical work should use the underlying data or another higher-resolution source when needed.
Frequently Asked Questions
What is the largest land-cover class in Rio Grande County?
Forest is the largest 2025 class at 35.39%, followed closely by shrubland at 34.32%. Agriculture covers 15.98%, wetlands 7.14%, developed land 3.44%, and grassland 2.96%.
Why does the eastern side look so different from the western side?
The 2025 map contains a concentrated pattern of agricultural cover in the east, while broad forest and shrubland dominate much of the west, south, and center. The map shows surface classification, not parcel ownership or zoning.
Does the 10.32% change value mean that 10.32% of the county was damaged?
No. It is the share of cells assigned different land-cover classes in 1985 and 2025. Real surface change can contribute, but imagery conditions, vegetation state, mixed pixels, and classification differences can also affect the result.
Map File Information
The ZIP includes all four original JPG maps: 2025 land cover, forest and farmland, impervious surface and developed land, and 1985–2025 class differences.
- Included Files: Use only the versions confirmed in the article and supplied images
- File Type: Use the confirmed download contents
- Intended Use: Printing, education, presentations, and map-based projects
Related Maps
- Adams County Colorado Land Cover Map
- Alamosa County Colorado Land Cover Map
- Arapahoe County Colorado Land Cover Map
Sources and References
- MRLC Annual NLCD Data – source data for land cover and impervious-surface mapping
- USGS Annual NLCD Land Cover Classification – class definitions and classification reference
- U.S. Census Bureau TIGER/Line Shapefiles – county boundary reference
Green Map creates custom-edited map images using open geographic data sources such as geoBoundaries, Natural Earth, OpenStreetMap, and government open data.
These maps are edited visual materials, not raw data files, and are provided for education, documents, presentations, and graphic reference.