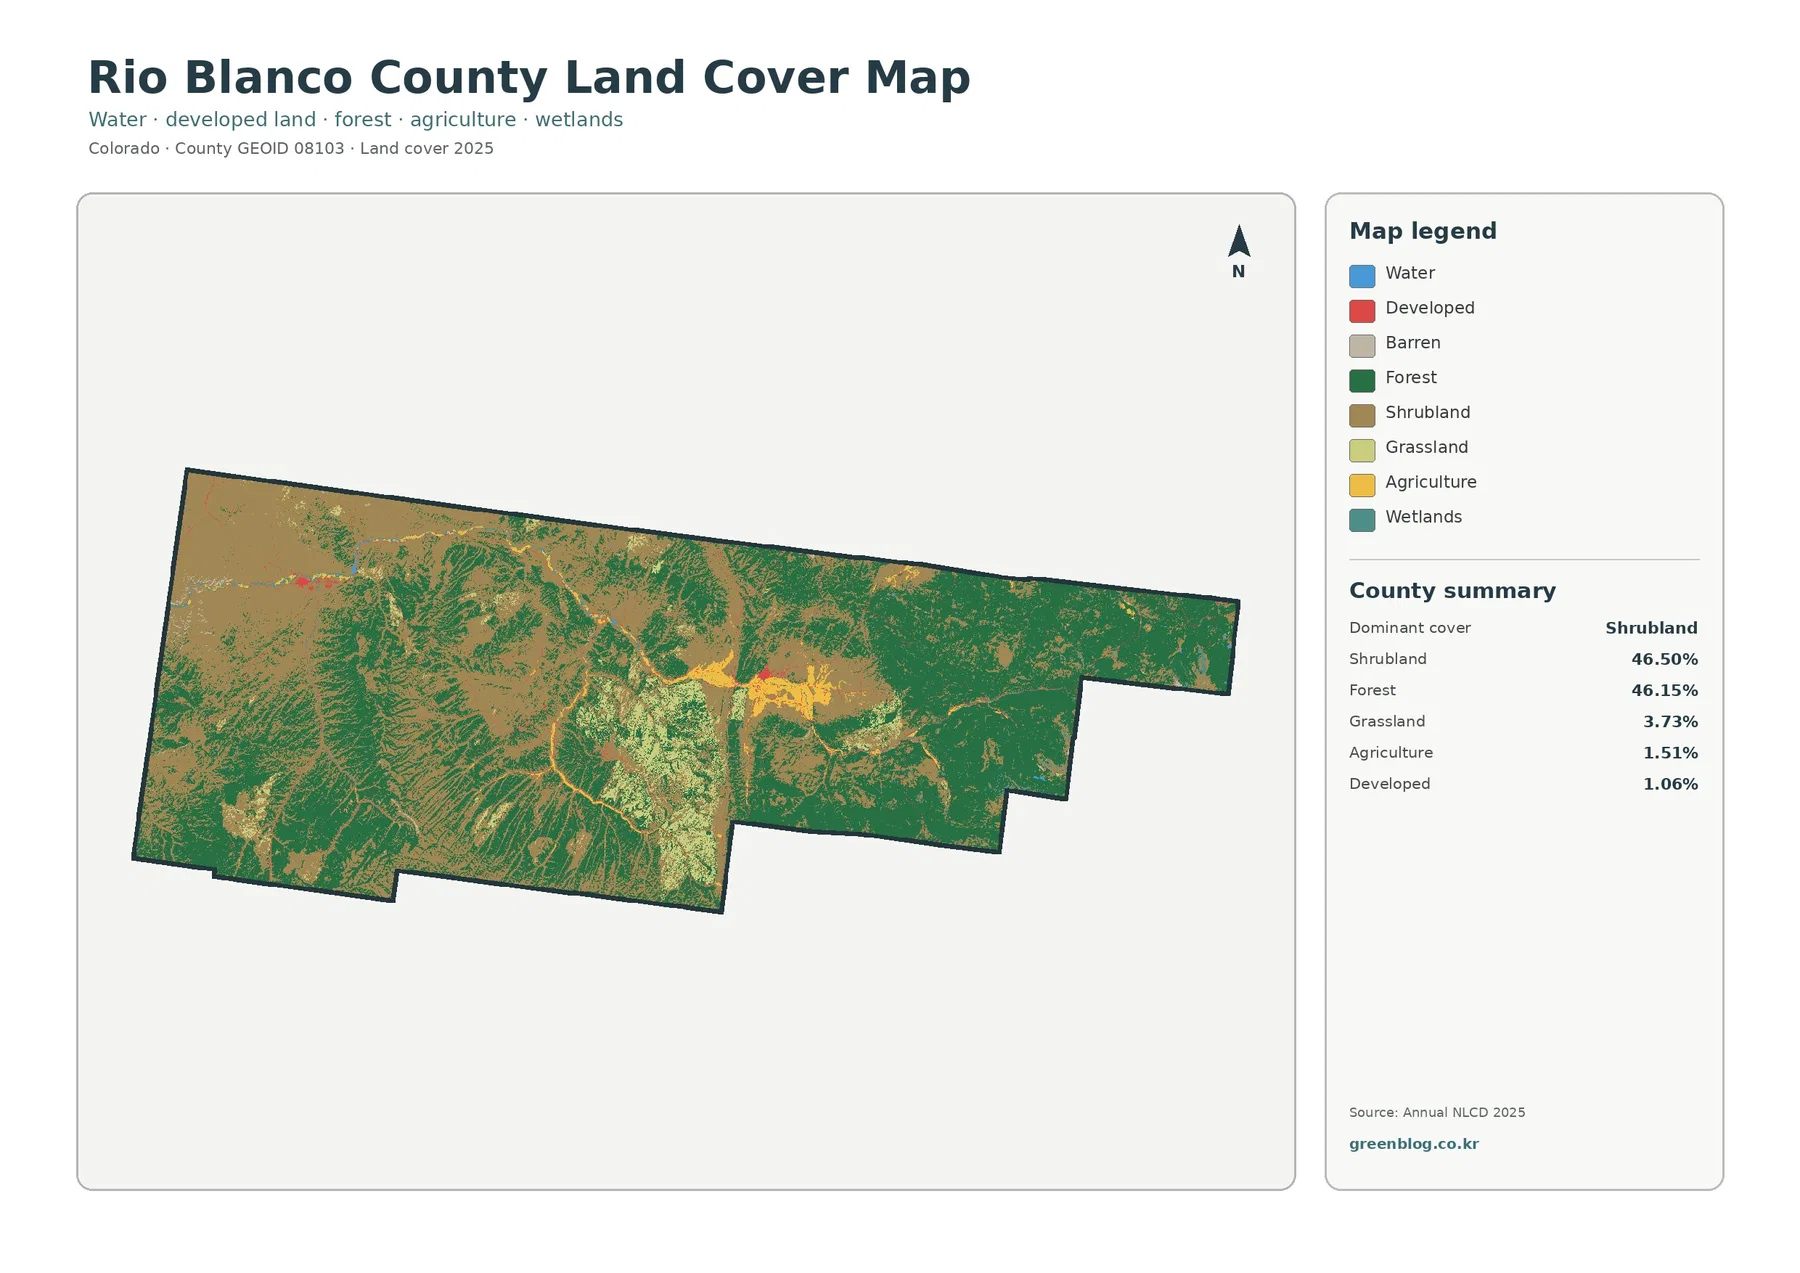
Rio Blanco County in northwestern Colorado is dominated by two land-cover types that are almost evenly matched. The 2025 summary lists shrubland at 46.50% and forest at 46.15%, followed by grassland at 3.73%, agriculture at 1.51%, developed land at 1.06%, wetlands at 0.78%, and water at 0.09%. On the map, broad shrub-covered country in the west and center contrasts with extensive forest in the east and south, while the settled White River corridor occupies only a small part of the county.
This page brings together four views: current land cover, forest and farmland, impervious surface and developed land, and mapped class differences between 1985 and 2025. The four original JPG maps are also available in one ZIP below for presentations, classroom work, regional comparisons, and general reference.
Table of Contents
A county split almost evenly between shrubland and forest
Rio Blanco County does not have one land-cover type that overwhelms everything else. Shrubland leads the 2025 summary by only 0.35 percentage points over forest. The distinction becomes much clearer when location is considered. Shrubland occupies large parts of the western and central county, while forest expands across the eastern and southern uplands and appears repeatedly along ridges and drainage breaks.
Grassland accounts for 3.73% of the county. It is much less extensive than either shrubland or forest, but it adds a lighter open-cover pattern in valleys and transitional areas. Agriculture is smaller again at 1.51%. Instead of forming broad blocks across the county, agricultural cover appears in limited patches, especially near flatter valley terrain and settlements.
Developed land represents 1.06% of the mapped area. That small percentage matches what the countywide view suggests: towns and built surfaces are compact compared with the surrounding natural cover. Wetlands and water are smaller by area, yet narrow riparian features can still be important visual landmarks because they trace channels through otherwise broad shrub and forest cover.
Land cover should not be confused with zoning, ownership, or legal land use. These classes describe what the surface was classified as from remotely sensed data. A shrubland cell does not tell you whether the property is public or private, and an agricultural classification does not establish a parcel’s legal designation. County planning and parcel records are the appropriate sources for those questions.
The White River corridor puts the smaller classes in context
The broad natural cover can make the county’s smaller land-cover classes easy to overlook until the White River corridor is used as a reference. A Colorado water-planning study notes that both Meeker and Rangely are located on the White River and that Rio Blanco County lies within the White River sub-basin. That geographic context helps explain why the river corridor is a useful line for comparing settlement, agriculture, wetlands, and surrounding uplands.
Around Meeker and Rangely, the maps show small concentrations of developed cover compared with the much larger shrubland and forest areas. Agricultural patches also become easier to see when the forest-and-farmland view removes some of the detail from the general map. They remain limited in countywide percentage, but their placement near the valley floor gives them a clear spatial pattern.
Wetland and water classes are modest in the county summary, yet they often form narrow shapes rather than large polygons. A thin river or wetland strip can be visually meaningful without taking up much total area. For watershed education or regional landscape comparisons, this is why the map should be read by both percentage and location rather than percentage alone.
Forest and farmland appear at very different scales
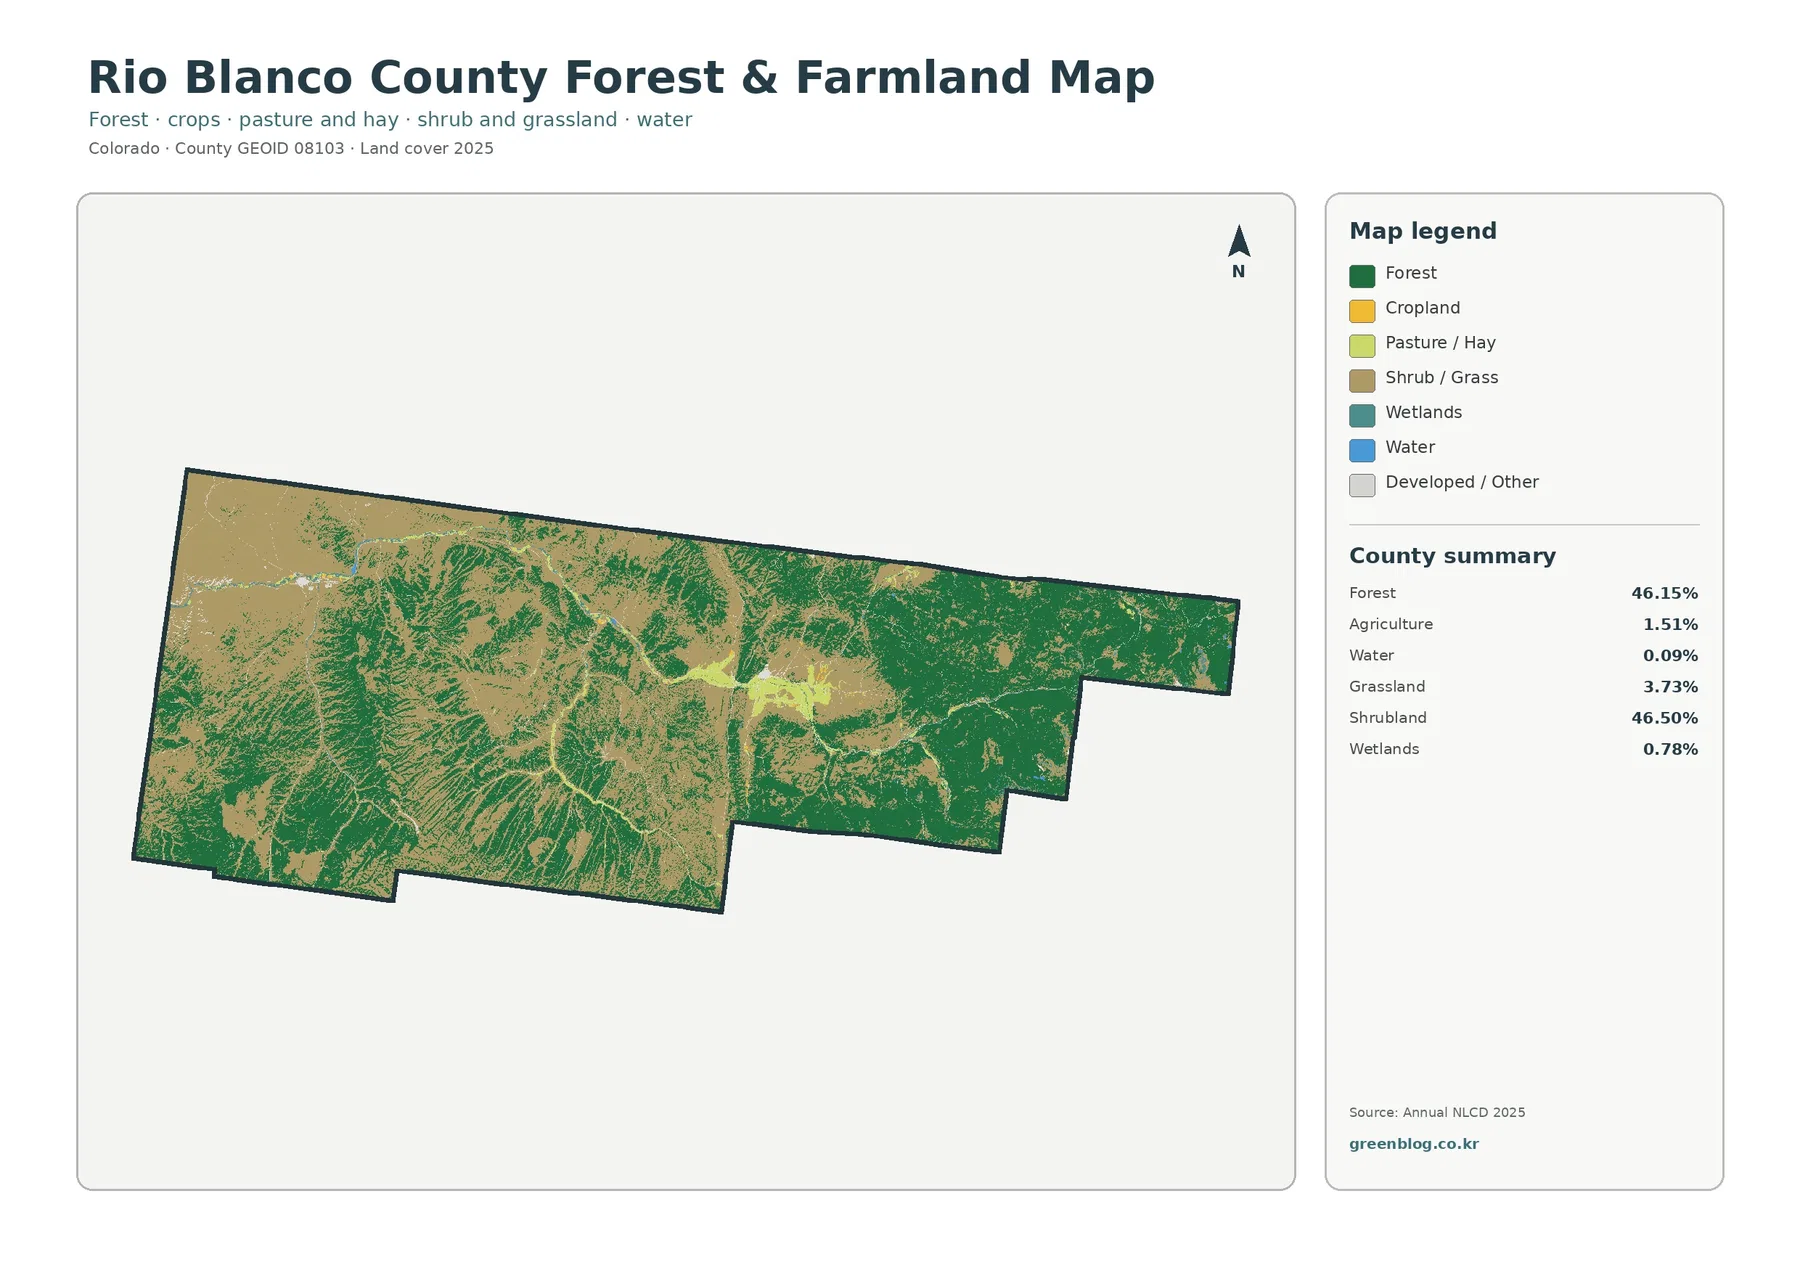
The forest-and-farmland map simplifies the county into a smaller set of reader-friendly categories. Forest remains the major green component at 46.15%, covering extensive uplands in the east and south and appearing in additional patches farther west. Agriculture, by contrast, is only 1.51% and is concentrated in much smaller areas.
That contrast is useful because it prevents a common misunderstanding. The agricultural percentage is a land-cover classification, not a measure of the county’s agricultural economy, ranch acreage, or number of farms. Grazing can occur on land classified as grassland or shrubland, and legal agricultural parcels may contain multiple surface-cover types. The map only reports the cover category assigned to each raster cell.
The boundaries between forest, shrubland, and grassland are irregular. In several areas the classes interlock rather than forming simple east-west bands. This makes the map useful for comparing upland vegetation, open valleys, and forest edges, but it should not be treated as a survey of individual stands or fields.
For a general reader, the most practical use of this view is to locate where forest is continuous and where agricultural cover is concentrated. It also works well in classroom or presentation settings because the legend is simpler than the full land-cover map while still retaining water, wetlands, and open-cover categories.
Impervious surfaces stay tightly concentrated around towns
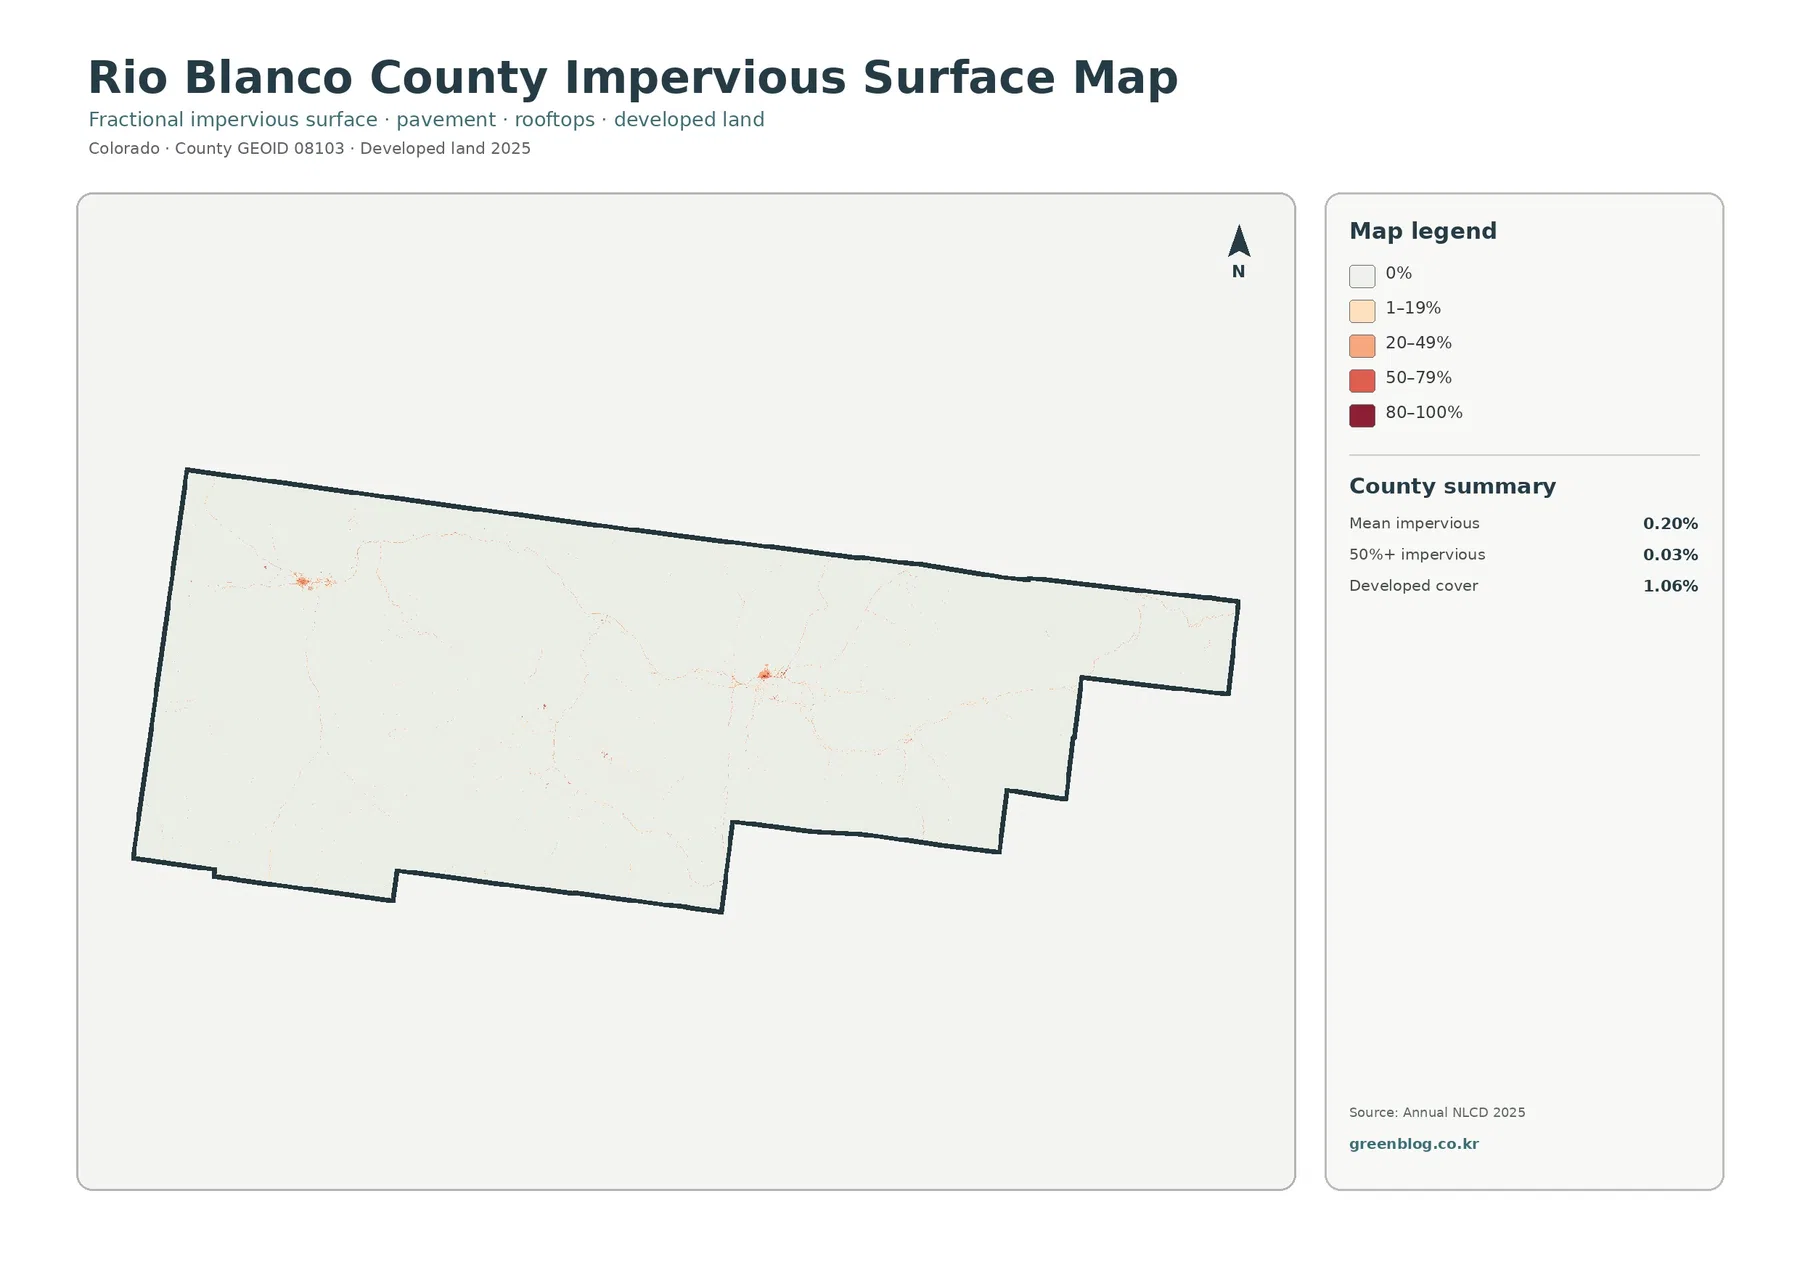
Impervious surface means pavement, rooftops, and other hard surfaces that do not readily absorb water. Rio Blanco County has a mean impervious value of just 0.20%, and only 0.03% of the county is mapped at 50% or more impervious cover. Those figures are consistent with the visual impression of a county where built surfaces occupy a very small share of the total area.
The strongest concentrations appear around Meeker and Rangely. They stand out as small warm-colored clusters against a county that is otherwise very pale on the impervious map. Thin linear traces and isolated developed spots occur elsewhere, but there is no broad urban field comparable with a metropolitan county.
Developed cover, at 1.06%, is larger than the mean impervious percentage because the two measures describe different things. A developed land-cover class can include low-density places where buildings, roads, soil, and vegetation share the same area. The impervious layer focuses more directly on the fraction of each cell occupied by hard surfaces.
This map is useful for comparing settlement concentration, but it is not a drainage model or a building inventory. It cannot identify roof types, street classifications, or parcel-level construction. Rio Blanco County’s Planning Division is the appropriate source for zoning and land-use regulations when a question involves legal development status rather than surface cover.
The 1985–2025 map flags class differences, not a single damage rate
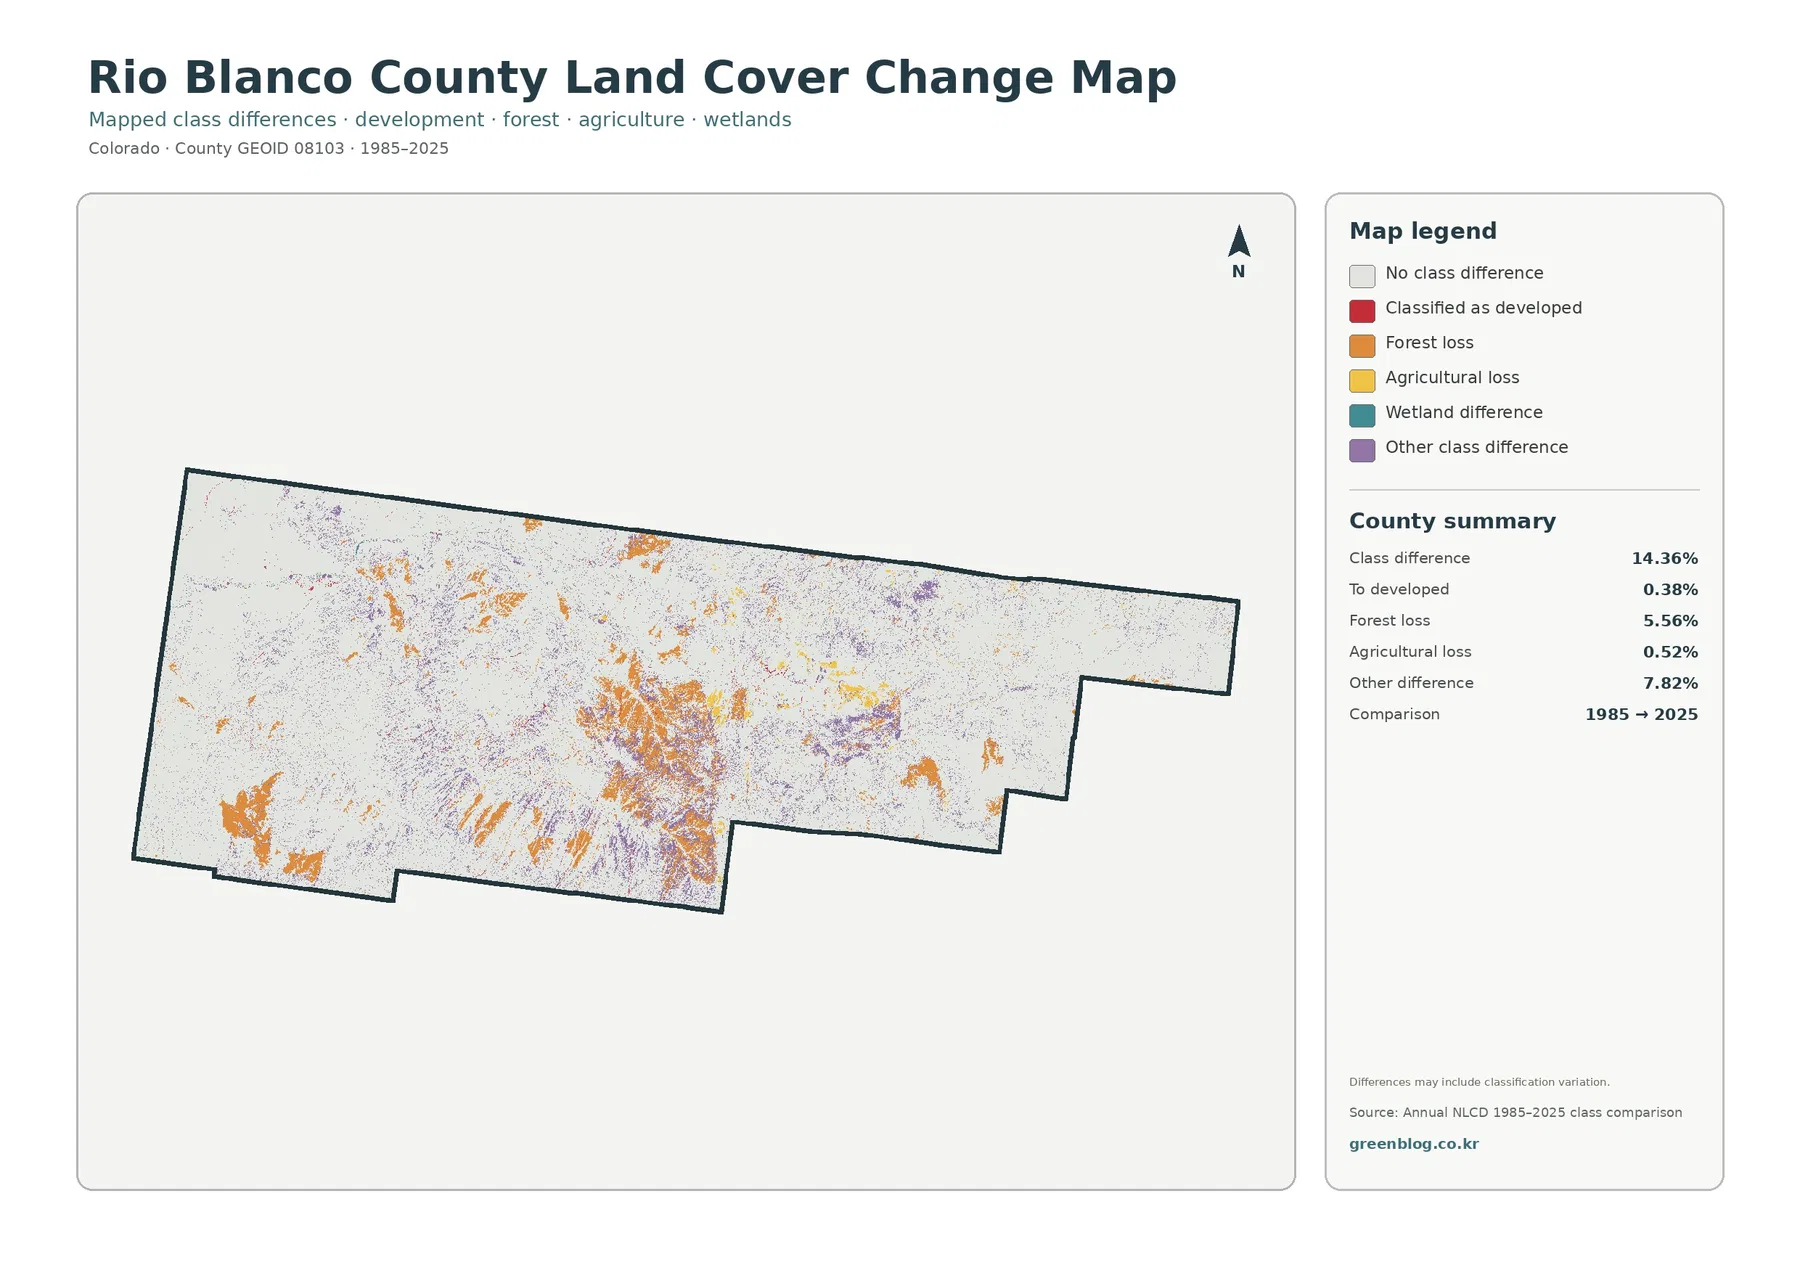
The change map compares mapped classes from 1985 and 2025. It reports a total class difference of 14.36%. The summary separates 0.38% classified to developed, 5.56% forest-loss classification, 0.52% agricultural-loss classification, and 7.82% other class difference. Orange and purple patches are scattered widely, with some of the larger clusters occurring across central and southern parts of the county.
The 14.36% figure should not be read as 14.36% of the county being damaged or developed. It means that the class assigned at the two endpoints was different for that share of mapped cells. Real land-cover change can contribute to the result, but so can differences in vegetation condition, observation timing, disturbance and recovery, imagery, and classification methods.
The same caution applies to the 5.56% forest-loss category. It identifies cells that moved from a forest classification to another class in the endpoint comparison. It does not, by itself, prove permanent forest removal across 5.56% of the county. Intermediate Annual NLCD years, aerial photography, fire records, or forest-management information would be needed to investigate the cause of a particular patch.
Used properly, the change map is a screening tool. A large orange patch can be checked against the current forest map; a purple area can be compared with present shrubland and grassland; and red developed changes near towns can be viewed alongside the impervious layer. This sequence helps turn the change map into a set of locations for closer review rather than a final conclusion.
How to choose among the four Rio Blanco County maps
- Use the 2025 land-cover map for the broadest comparison of shrubland, forest, grassland, agriculture, developed land, wetlands, and water.
- Use the forest-and-farmland map when the main question is where forest dominates and where the county’s relatively small agricultural patches occur.
- Use the impervious-surface map to locate the compact built-up concentrations around Meeker and Rangely and compare them with the surrounding natural cover.
- Use the 1985–2025 change map to identify cells with different endpoint classifications and then investigate those locations with current and intermediate-year sources.
These maps are generalized raster products. Raster data divide the ground into grid cells and assign each cell a representative value, so narrow streams, small wetlands, individual buildings, field edges, and mixed vegetation can be simplified. A mixed pixel may contain more than one real surface type even though only one class is displayed.
That limitation does not make the maps less useful; it defines the right scale for using them. They are well suited to countywide environmental education, watershed context, regional presentations, and comparisons among western Colorado counties. Parcel surveys, engineering design, zoning decisions, and site-specific environmental work require more detailed sources.
Local resource planning and what this map does not show
Rio Blanco County’s Natural Resources department describes a county role in balancing resource use and conservation and notes that the county worked with the White River and Douglas Creek Conservation Districts on a land and natural resources plan. That local planning context is separate from the satellite-derived classes on this page. A forest or shrubland color should not be interpreted as a policy designation.
The county Planning Division likewise handles land-use change permitting, zoning, and divisions of land. Those administrative categories answer different questions from land cover. Someone checking whether a property may be developed should use county planning and zoning information rather than infer permission from a developed, shrubland, or agricultural color on these maps.
Download the four original JPG maps
The ZIP below contains the four original JPG files described on this page. Each image is 2480×1754 pixels and can be used for reports, slides, classroom materials, or regional comparisons. The supplied asset manifest does not mark these images as meeting the A3 high-resolution reference, so large-format printing or detailed analysis is better handled with the underlying Annual NLCD data or another higher-resolution source.
Frequently Asked Questions
What is the largest land-cover type in Rio Blanco County?
Shrubland is the largest 2025 class at 46.50%, with forest almost equal at 46.15%. Grassland is 3.73%, agriculture 1.51%, and developed land 1.06%.
Which map is best for seeing development around Meeker and Rangely?
The impervious-surface and developed-land map gives the clearest view of pavement and rooftops. Meeker and Rangely appear as small concentrated clusters within a mostly low-impervious county.
Does the 14.36% class difference mean 14.36% of the county was damaged?
No. It is the share of raster cells assigned different land-cover classes in the 1985 and 2025 endpoint comparison. Real change and classification variation can both contribute.
Map File Information
The ZIP contains four original JPG maps: 2025 land cover, forest and farmland, impervious surface and developed land, and the 1985–2025 class-difference map.
- Included Files: Use only the versions confirmed in the article and supplied images
- File Type: Use the confirmed download contents
- Intended Use: Printing, education, presentations, and map-based projects
Related Maps
- Adams County Colorado Land Cover Map
- Alamosa County Colorado Land Cover Map
- Arapahoe County Colorado Land Cover Map
Sources and references
- MRLC Annual NLCD Data – land-cover and impervious datasets
- USGS Annual NLCD Land Cover Classification – class definitions
- U.S. Census Bureau TIGER/Line Shapefiles – county boundary data
- Rio Blanco County Natural Resources – county natural-resource planning and policies
- Rio Blanco County Planning Division – land-use regulations and planning responsibilities
Green Map creates custom-edited map images using open geographic data sources such as geoBoundaries, Natural Earth, OpenStreetMap, and government open data.
These maps are edited visual materials, not raw data files, and are provided for education, documents, presentations, and graphic reference.