The Sumter County Florida Land Cover Map is dominated by wetlands and agriculture, with a distinctly different developed concentration in the northeast. The 2025 county summary lists wetlands at 39.03%, agriculture at 28.59%, developed land at 15.39%, forest at 13.04%, and water at 1.89%. Those percentages become more meaningful on the map because the largest classes do not occupy the county in the same way: wetlands cover broad western and southern areas, agriculture is extensive through the center and north, and development is packed much more tightly into the northeastern corner.
This page provides four related views of the same county: 2025 land cover, forest and farmland, impervious surface and developed land, and a 1985–2025 class-difference map. The WebP images are intended for quick on-page comparison, while the four original JPG maps are available together in one ZIP download below. The set is useful when a lesson, presentation, or county comparison needs to separate broad surface composition from vegetation, hard-surface intensity, and two-date classification differences.
Table of Contents
Wetlands cover the broadest share, especially across the west and long southern section
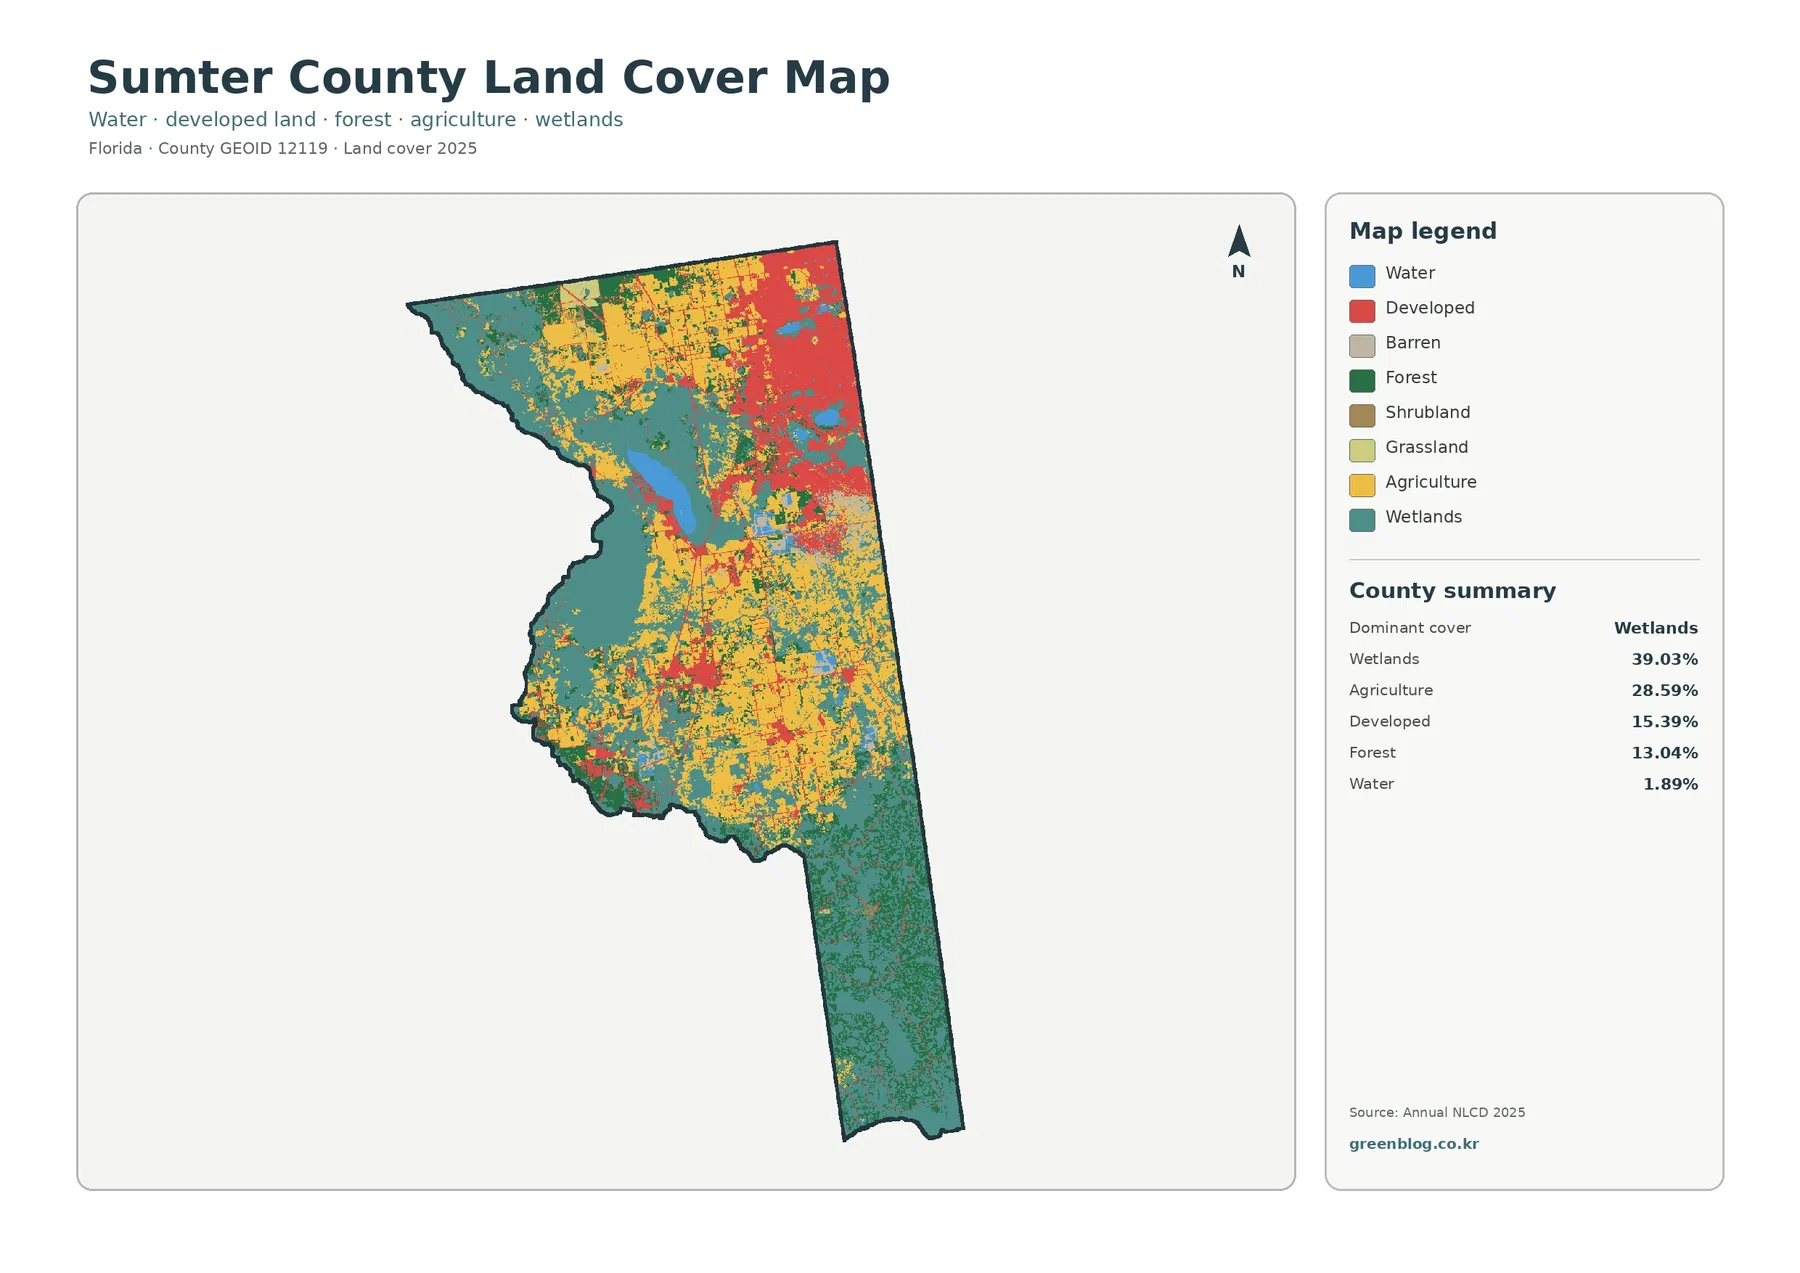
Wetlands account for 39.03% of the supplied 2025 summary and provide the strongest visual base in the map. Large teal areas occur along the western side, through west-central sections, and across most of the county’s narrow southern extension. Wetland colors also weave between agricultural blocks farther north. The distribution matters because a countywide percentage alone could suggest one continuous wet area, while the map shows several broad zones connected by smaller pockets and corridors.
Open water is only 1.89%, much smaller than the wetland share. A comparatively large blue water body appears in the west-central part of the county, and smaller blue areas occur elsewhere, but open water never approaches the area represented by wetlands. Keeping the two classes separate is essential. A wetland cell can contain vegetation and saturated or seasonally wet ground without appearing as open blue water, so “wet” land cover is not the same thing as lake or pond area.
The southern portion of the county provides the clearest contrast with the northeast. Most of the long southern section is mapped in wetland tones, with limited developed color and scattered other classes. The northeast, by comparison, contains the county’s strongest developed concentration. This directional contrast gives the overall map a clear structure without requiring assumptions about ownership, zoning, conservation status, or development rights, none of which are shown by the land-cover classification.
Agriculture fills much of the center and north but repeatedly meets wetland and forest cover
Agriculture is the second-largest class at 28.59%. Yellow agricultural blocks are common through the central and northern parts of Sumter County, including broad areas east and north of the large west-central water body. The pattern is not one uninterrupted farming district. Wetlands cut into the agricultural color in many places, and forested areas remain visible along the west and within portions of the center and north.
Land cover should not be confused with legal land use. Annual NLCD uses remotely sensed information to classify what is physically covering the ground into categories such as agriculture, forest, wetland, water, and developed land. An agricultural cell does not identify the landowner, crop, parcel boundary, zoning category, or development entitlement. The map is therefore strongest for county-scale surface comparison rather than parcel-level planning decisions.
The spatial difference between agriculture and development is especially useful. Agricultural colors occupy many broad blocks across the center and north, while the largest developed mass is compressed into the northeast. Smaller developed areas occur elsewhere, but they do not form a countywide blanket. That contrast explains more than the percentages alone because it shows that 28.59% agriculture and 15.39% development are organized very differently across the county.
A vegetation-focused view separates forest from working land more clearly
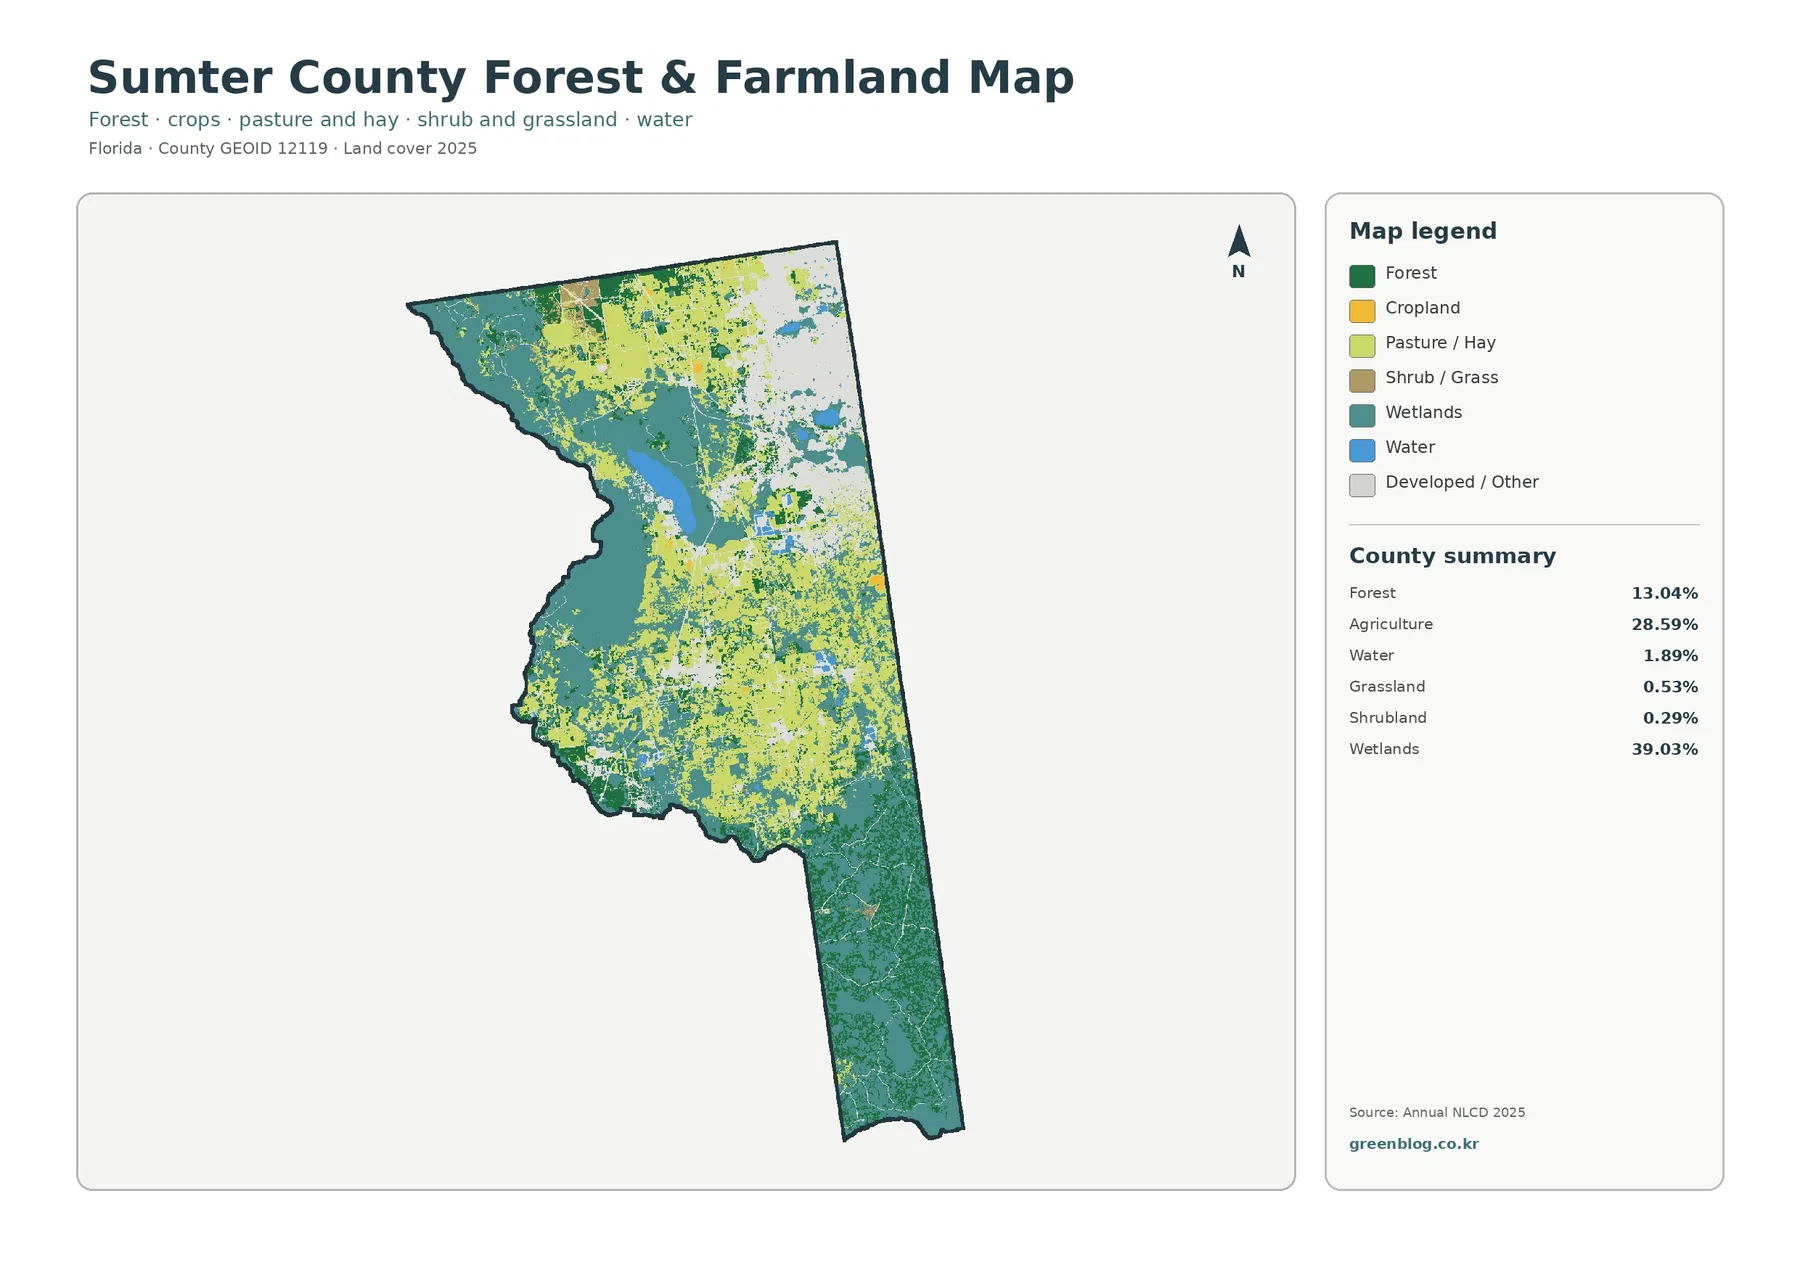
Forest covers 13.04% of the county. In the vegetation-focused map, dark green areas are most noticeable along the west and west-central side, with additional patches in the north and center. The southern extension remains dominated by wetlands rather than forest. This distribution helps explain why the general map can look strongly natural even though the forest percentage is much lower than the wetland percentage: the two natural-cover classes occupy different areas and often meet along irregular boundaries.
The forest-and-farmland map distinguishes cropland from pasture or hay with separate colors, but the supplied summary combines them into a single agriculture value of 28.59%. It would therefore be misleading to calculate exact cropland and pasture percentages by eye from the image. The focused map is better used to compare locations—where crop-colored blocks appear, where pasture or hay is common, and how both relate to wetlands and forest.
Grassland is only 0.53% and shrubland 0.29% in the county summary. These classes appear in small pieces rather than as dominant zones. At county scale, a small colored patch can look sharply bounded even though the ground may contain mixed vegetation, drainage features, tracks, trees, or bare areas. The map assigns a representative class to a raster cell, so narrow edges should be treated as generalized rather than survey-grade boundaries.
Impervious cover confirms that the northeast contains the strongest hard-surface concentration
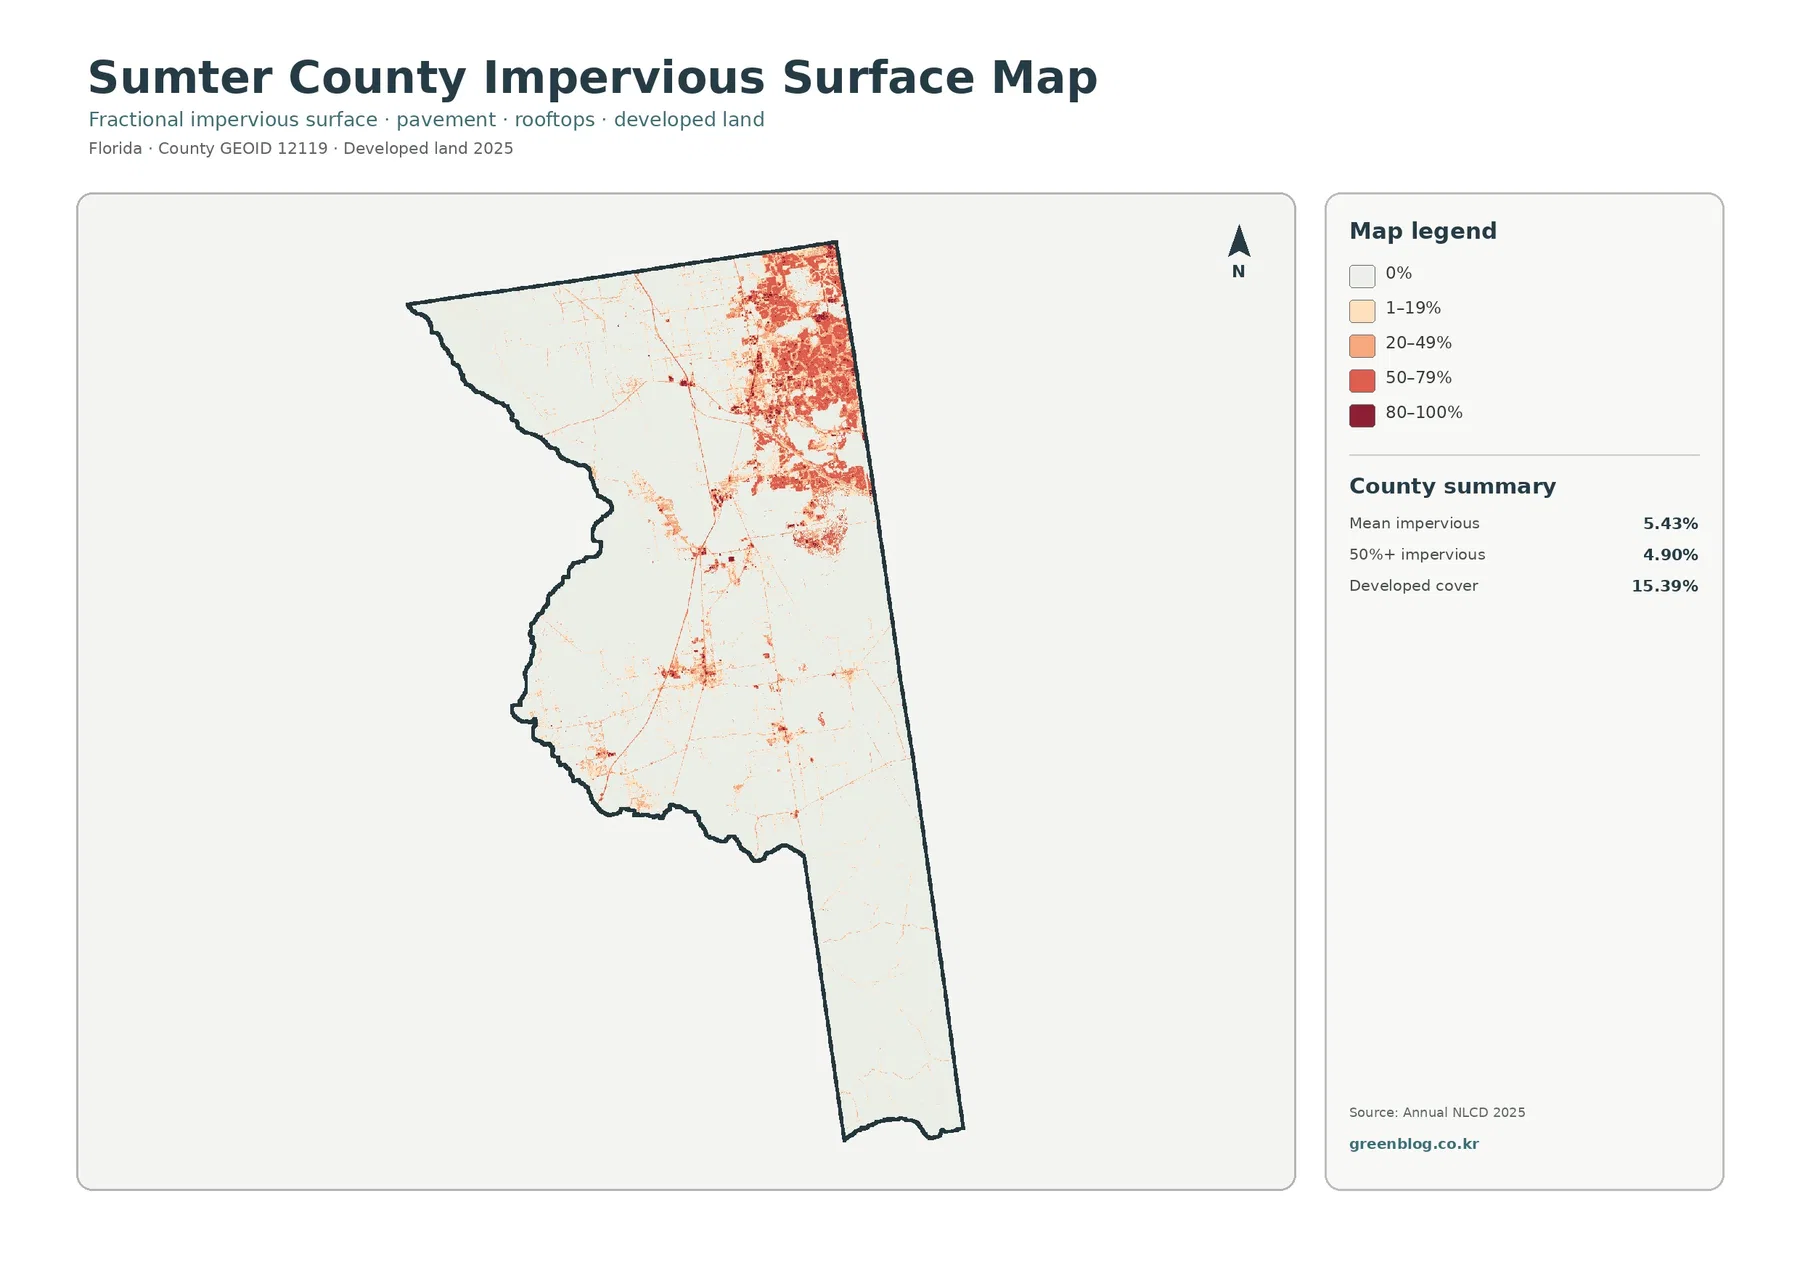
Mean impervious cover is 5.43%, considerably lower than the 15.39% developed-land share. Impervious surface means hard materials such as roofs, pavement, parking areas, and similar surfaces that do not readily absorb rainfall. Developed land is a broader land-cover category and can include lawns, trees, landscaped ground, and open space. The two statistics therefore describe related but different characteristics of the same built environment.
The darkest impervious colors cluster in the northeastern portion of the county, matching the strongest developed area in the general map. Smaller red and orange concentrations appear farther south through the center, and thin lines connect some of those areas. Much of the west and almost all of the long southern section remain at the light end of the impervious scale. The pattern is useful because it shows development intensity rather than merely the presence of a developed classification.
Only 4.90% of the county is mapped at 50% or greater impervious surface. That value, together with the 5.43% countywide mean, shows that highly hardened surfaces occupy a relatively limited share and are spatially concentrated. Thin red lines can resemble roads, but this is not a transportation map. It contains no route names, lane counts, traffic volumes, or pavement conditions, so the lines should be interpreted only as high-impervious surface patterns.
The 1985–2025 comparison is led by developed-category differences in the northeast
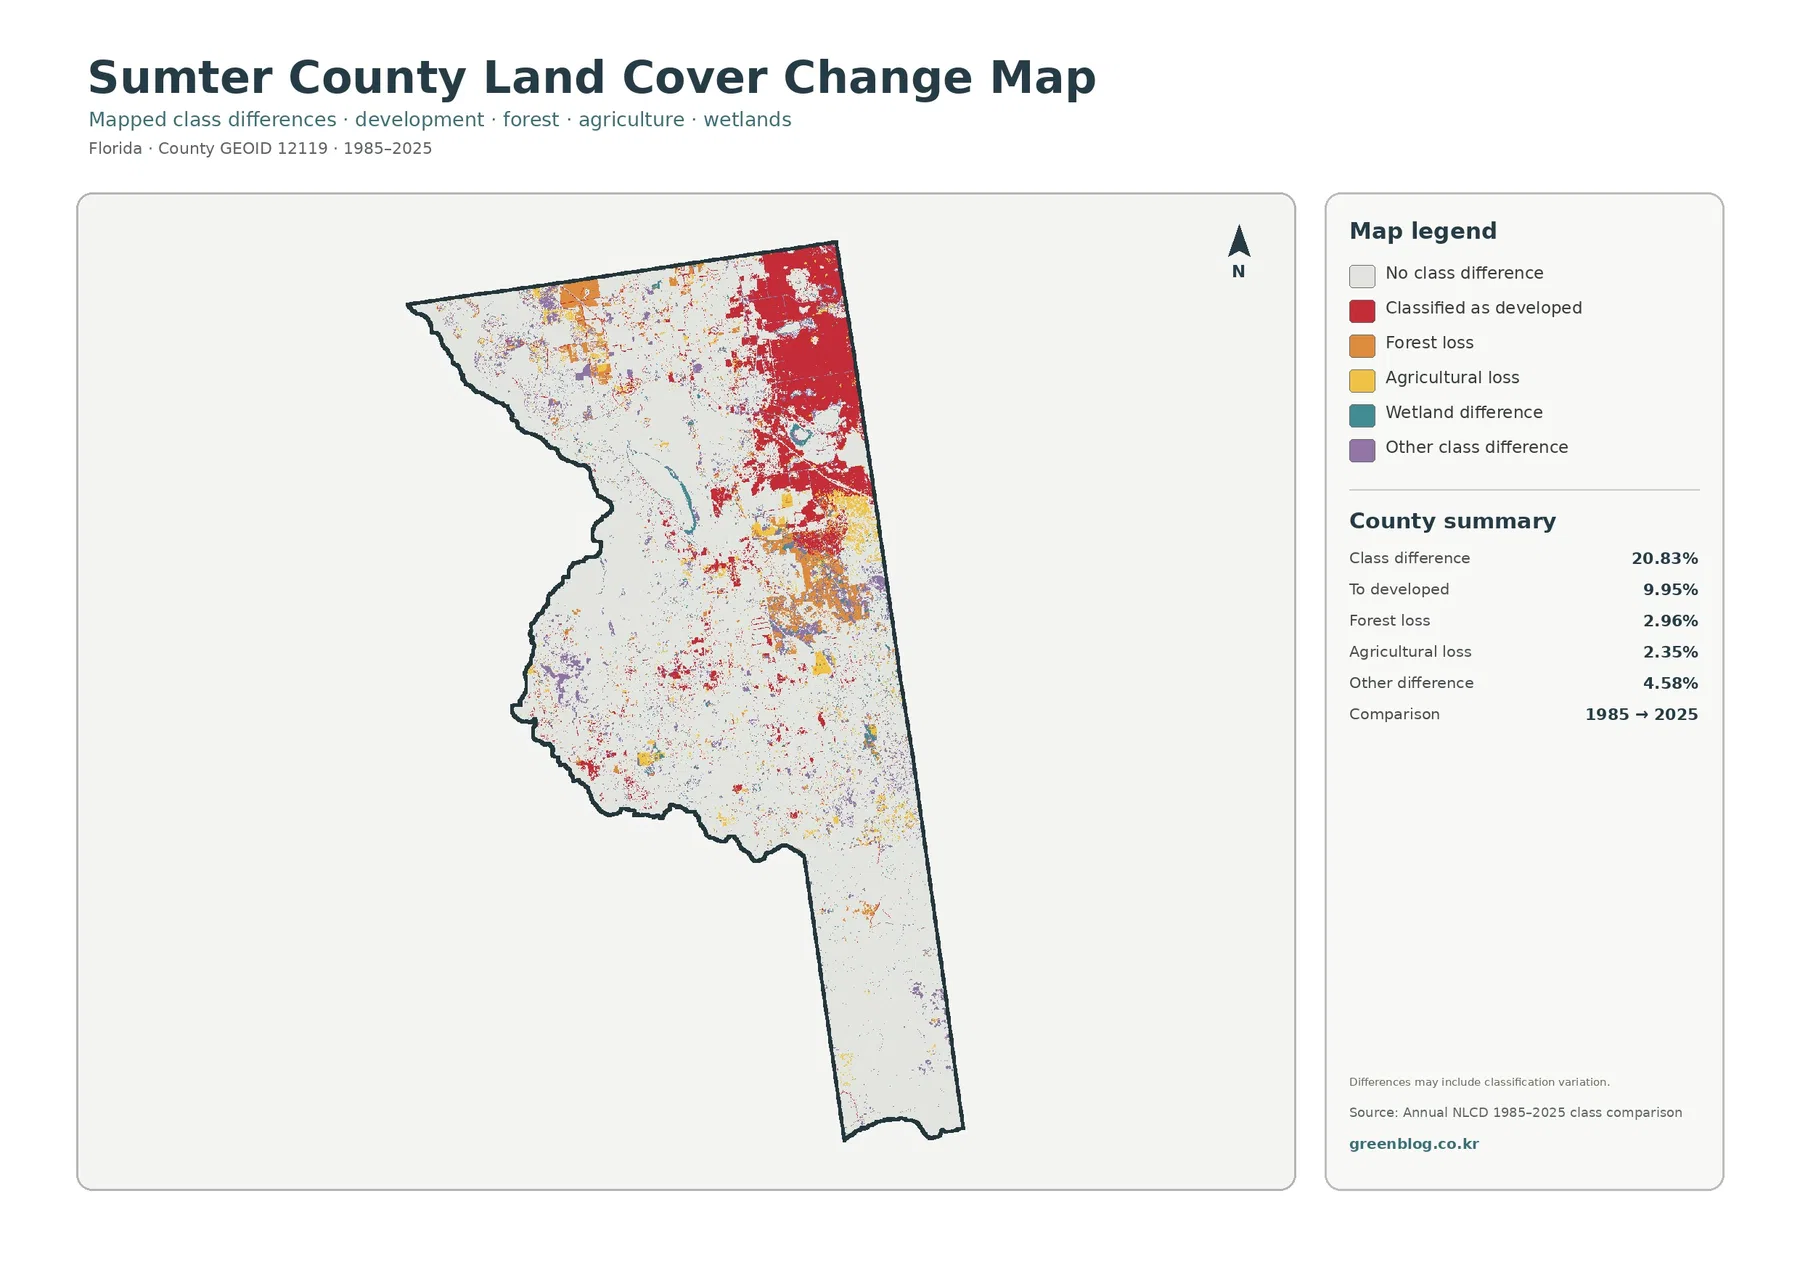
The total class difference between 1985 and 2025 is 20.83%. This value should not be presented as proof that 20.83% of the county was physically transformed. The comparison marks cells that received different land-cover classifications at the two dates, and the supplied map warns that classification variation may be included. Real surface change can contribute, but image conditions, seasonal effects, classification rules, and mixed pixels can also influence the result.
The “to developed” component is 9.95%, the largest named component in the summary. Red difference areas are especially extensive in the northeast, where current developed and impervious cover are also strongest. This visual overlap is worth noting, but it does not prove a specific cause for every changed cell. The current developed share of 15.39% and the 9.95% developed-category difference measure different things and should not be added or subtracted to create a new growth rate.
Forest loss is listed at 2.96% and agricultural loss at 2.35%. Orange forest-loss areas and yellow agricultural-loss areas occur in parts of the north and east-central county, with smaller marks elsewhere. Other class difference accounts for 4.58%. Wetland difference is included in the legend but does not receive its own percentage in the supplied county summary, so its visible locations can be described without inventing an exact number.
The change map is best used as a screening layer. A cluster of red, orange, yellow, teal, or purple cells can identify a place worth examining more closely, but it cannot establish why the classification changed. Development, agricultural management, vegetation recovery, hydrologic conditions, storms, imagery timing, or classification effects may all matter. Intermediate-year imagery and local records are needed for a site-specific history.
Three comparisons connect the four maps into one county profile
The first comparison is the wet south and west versus the developed northeast. The 2025 land-cover map establishes that directional contrast, and the impervious map makes it even stronger by showing where hard surfaces are concentrated. This is the clearest way to explain why a county with 39.03% wetlands can also contain a conspicuous developed area without those two facts being contradictory.
The second comparison is agriculture versus wetlands. Agriculture covers 28.59% and wetlands 39.03%, and the two classes repeatedly meet across the center and north. Agricultural blocks do not occupy an isolated half of the county; wetland cells cut between them and forest remains nearby in the west. Seeing those boundaries makes the map more useful than a simple ranked list of percentages.
The third comparison is developed land versus hard surface. Developed cover is 15.39%, mean impervious cover is 5.43%, and the 50%+ impervious share is 4.90%. Those figures show that a developed classification does not mean every part of a cell is paved. The impervious map is therefore the better choice when the question concerns surface hardness, while the general land-cover map is better for overall county composition.
Choose the map that matches the question instead of compressing all four into one small figure
For a broad county introduction, start with the 2025 land-cover map. It shows wetlands, agriculture, development, forest, and water in one frame and quickly establishes the northeast-versus-southwest contrast. The forest-and-farmland map works better when the subject is working land or vegetation because it reduces the visual competition from developed colors and makes agricultural blocks easier to follow.
Use the impervious map when the discussion is about how intensely the ground is covered by roofs and pavement. It explains why a 15.39% developed share does not translate into an equally large hard-surface average. The 1985–2025 comparison is most useful after the current maps, because readers need to understand the present surface before interpreting symbols that represent differences between two dates.
For comparison with another Florida county, keep the observation year and classification system consistent. Sumter County’s reference values include 39.03% wetlands, 28.59% agriculture, 15.39% developed land, and 5.43% mean impervious cover. Compare both percentages and spatial arrangement. A smaller class concentrated in one part of a county can be visually and locally important even when it does not dominate the total area.
Raster cells and the 2480×1754 JPG size limit fine-boundary interpretation
Annual NLCD is raster data, so the landscape is divided into grid cells and each cell receives a representative land-cover class. One real location may contain trees, pasture, pavement, water, grass, and bare ground within a small area, while the map simplifies that mixture into a dominant class. Edges between wetlands, farmland, forest, and development are therefore generalized and should not be treated as surveyed parcel boundaries.
The original JPG files in this package are 2480×1754 pixels each. Enlarging a map can make small patterns easier to see, but it cannot create source detail that is not present in the original image. The asset manifest does not mark these files as meeting the package’s A3 high-resolution reference. They remain useful for screen viewing, presentations, ordinary handouts, and county-scale comparison, but very large printing should be checked at the intended output size.
Land cover is also different from zoning, ownership, permitting, legal wetland jurisdiction, and land-use planning. A developed cell does not establish a parcel’s zoning designation, and a wetland-colored cell does not establish a regulatory boundary. These maps are appropriate for understanding broad surface patterns, preparing educational graphics, and selecting areas for closer study. Parcel-level decisions require more detailed and current official sources.
Frequently Asked Questions
What is the largest 2025 land-cover class in Sumter County?
Wetlands are the largest class at 39.03%, followed by agriculture at 28.59%, developed land at 15.39%, forest at 13.04%, and water at 1.89%. Wetlands are especially broad in the west and south, while the strongest developed concentration appears in the northeast.
Why is developed cover 15.39% while mean impervious cover is only 5.43%?
Developed land can contain lawns, trees, open ground, and other permeable surfaces together with buildings and roads. Impervious cover isolates hard materials such as rooftops, pavement, and parking areas, so the countywide impervious average can be much lower than the broader developed-land share.
Does the 20.83% class difference mean 20.83% of Sumter County was physically transformed?
No. The 20.83% figure is the share of cells classified differently in the 1985 and 2025 comparison. Listed components include 9.95% to developed, 2.96% forest loss, 2.35% agricultural loss, and 4.58% other difference. The map warns that classification variation may be included, so specific causes require additional evidence.
Sources and Reference Data
- MRLC Annual NLCD Data – annual land-cover data used for the 2025 and two-date comparison views.
- USGS Annual NLCD Land Cover Classification – definitions for developed, forest, agricultural, wetland, and other mapped classes.
- U.S. Census Bureau TIGER/Line Shapefiles – official geographic reference for the Sumter County boundary.
Map File Information
This ZIP contains the four original JPG maps used to compare 2025 land cover and related themes across Sumter County.
- Included Files: Maps described in this article
- File Type: ZIP archive available from the download link below
- Intended Use: Printing, education, presentations, and map-based projects
Related Maps
- Alachua County Florida Land Cover Map
- Baker County Florida Land Cover Map
- Bay County Florida Land Cover Map
Green Map creates custom-edited map images using open geographic data sources such as geoBoundaries, Natural Earth, OpenStreetMap, and government open data.
These maps are edited visual materials, not raw data files, and are provided for education, documents, presentations, and graphic reference.