Forest is the defining surface on the supplied 2025 map of Shoshone County. It covers 84.03% of the county, while a thin developed band crosses the forested interior and scattered shrub and grass areas break up parts of the southwest and central mountains. This Shoshone County Idaho Land Cover Map is most useful for seeing how a heavily forested county contains a much narrower corridor of towns, hard surfaces, and other developed land.
The page includes four related views: 2025 land cover, forest and farmland, impervious surface and developed land, and a 1985–2025 class-difference map. The WebP previews can be compared in the article, while the four original 2480 × 1754-pixel JPG maps are available together in one ZIP below. They work well for county profiles, classroom material, presentations, and broad environmental comparison, but they do not replace parcel, zoning, transportation, or regulatory maps.
Table of Contents
A county where forest covers more than four-fifths of the mapped surface
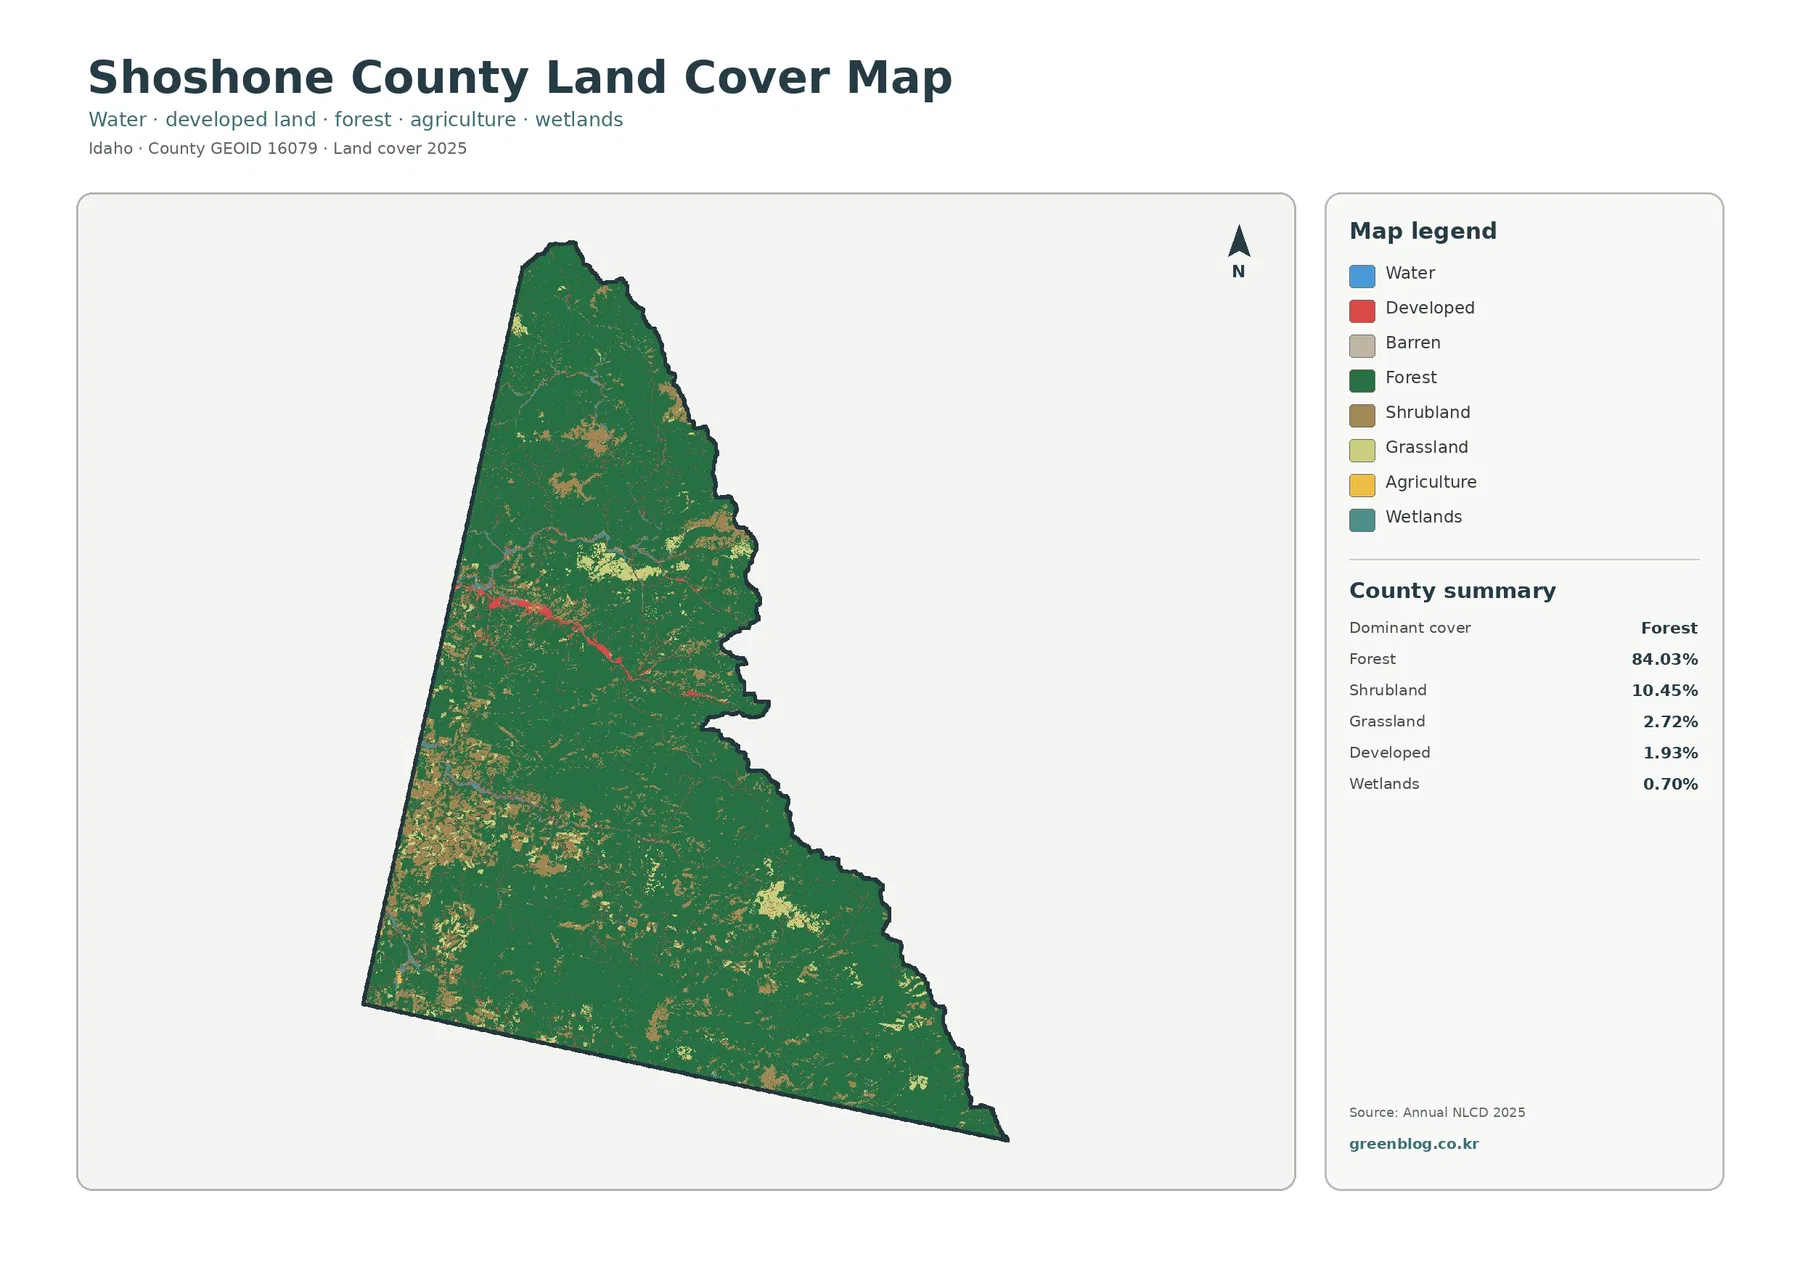
The county summary lists forest at 84.03%, shrubland at 10.45%, grassland at 2.72%, developed land at 1.93%, and wetlands at 0.70%. The forest-and-farmland view also reports only 0.08% water and 0.03% agriculture. Those numbers immediately separate Shoshone County from Idaho counties where irrigated fields, open rangeland, or urban land form large blocks. Here, forest is not simply the largest class; it is the background against which nearly every other surface appears.
Dark green continues from the narrow northern end through the long southeastern part of the county. The broadest interruptions occur in the southwest and in several central mountain areas, where brown shrub cover and lighter grass patches mix with the forest. The pattern is still predominantly wooded, but it is not uniform. Open mountain surfaces create irregular islands and edges within the larger forest matrix, especially away from the main developed corridor.
A red developed strip is easy to pick out in the north-central part of the map because it contrasts so strongly with the surrounding green. Shoshone County’s official website says that its seven incorporated cities are stretched along Interstate 90 from Pinehurst toward the Montana border and that this corridor is known as the Silver Valley. The mapped developed band broadly fits that setting. The preview does not label highways or municipal boundaries, however, so individual red cells should not be treated as an exact I-90 line or as the legal edge of any city.
Land cover describes what the ground surface is classified as from imagery. It is different from zoning, ownership, mineral rights, a parcel survey, or permission to build. A 30-meter cell can contain trees, a road, a building, grass, and exposed soil at the same time, yet the dataset still assigns a predominant class. That scale is useful for countywide patterns, but it cannot recover the detail needed for a single lot or a narrow stream crossing.
The Silver Valley becomes even narrower when only hard surfaces are emphasized
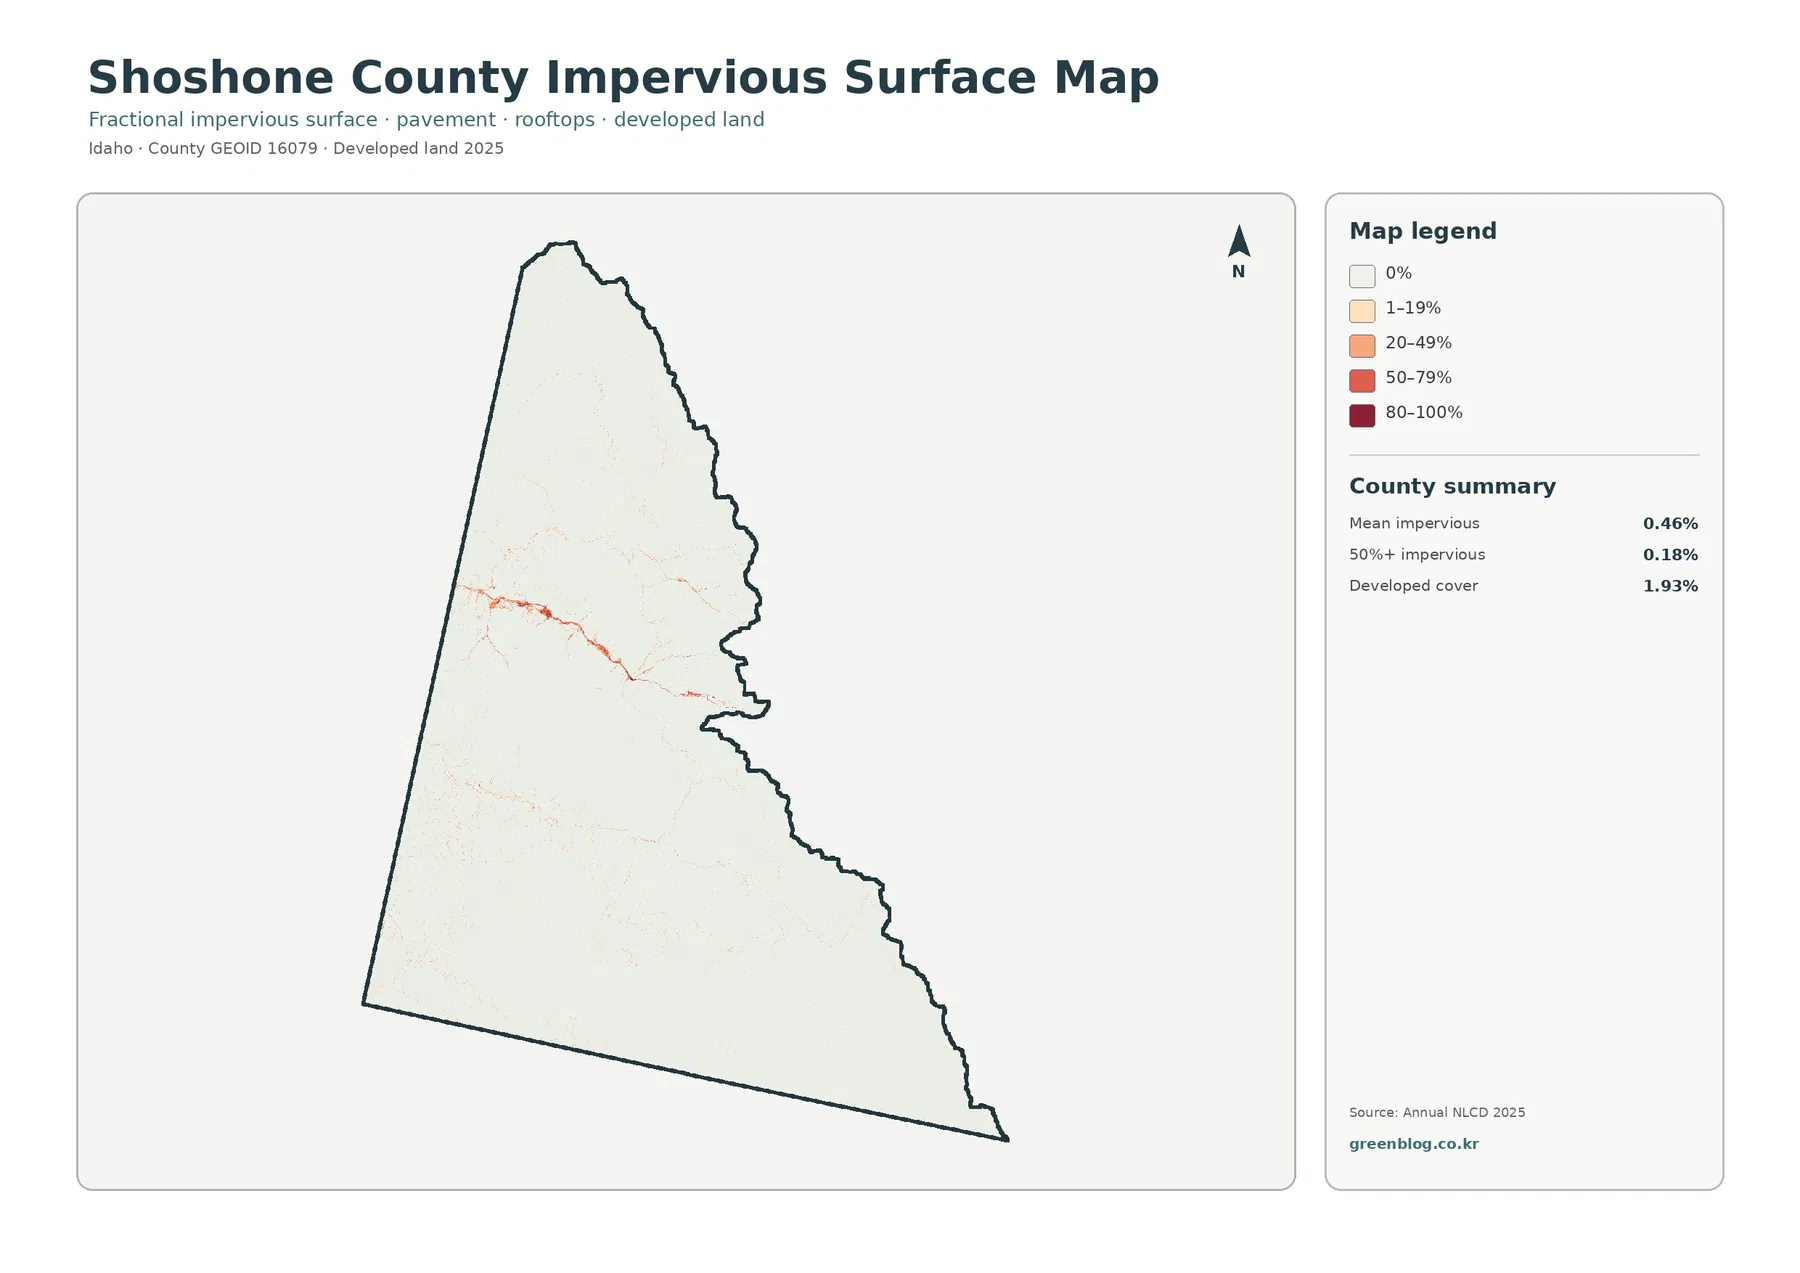
Impervious surface means material such as roofs and pavement that does not readily absorb rainfall. Shoshone County has a mean impervious value of 0.46%, and only 0.18% of the county is mapped at 50% impervious cover or greater. Both values are much smaller than the 1.93% developed share because developed land can include lawns, trees, bare soil, and other permeable surfaces around buildings and roads.
Most of the impervious map is nearly white. Stronger orange and red tones are concentrated along the same elongated north-central zone that stands out on the general land-cover map. A broader cluster appears toward the western part of that zone, followed by thinner traces and smaller concentrations to the east. In a county dominated by mountain forest, this image makes the limited footprint of built surfaces more obvious than the general classification does.
The official county description helps place that pattern in context because the Silver Valley cities line the I-90 corridor. Even so, the impervious layer does not distinguish a highway from a parking lot, industrial roof, residential street, or commercial block. Some narrow roads may be diluted by surrounding vegetation within a 30-meter cell, while several nearby hard surfaces may blend into one stronger patch. A transportation map is still necessary for exact route names, road classes, and junctions.
The countywide average also hides the contrast between the valley and the mountains. A small developed corridor can contain much higher local impervious values while large forest areas remain close to zero. For questions about runoff or drainage, location matters more than the average alone. Rainfall, slope, soil, stream channels, culverts, and wetland connections would all be needed before drawing conclusions about flooding or water movement.
Almost no mapped agriculture interrupts the forest-and-shrub pattern
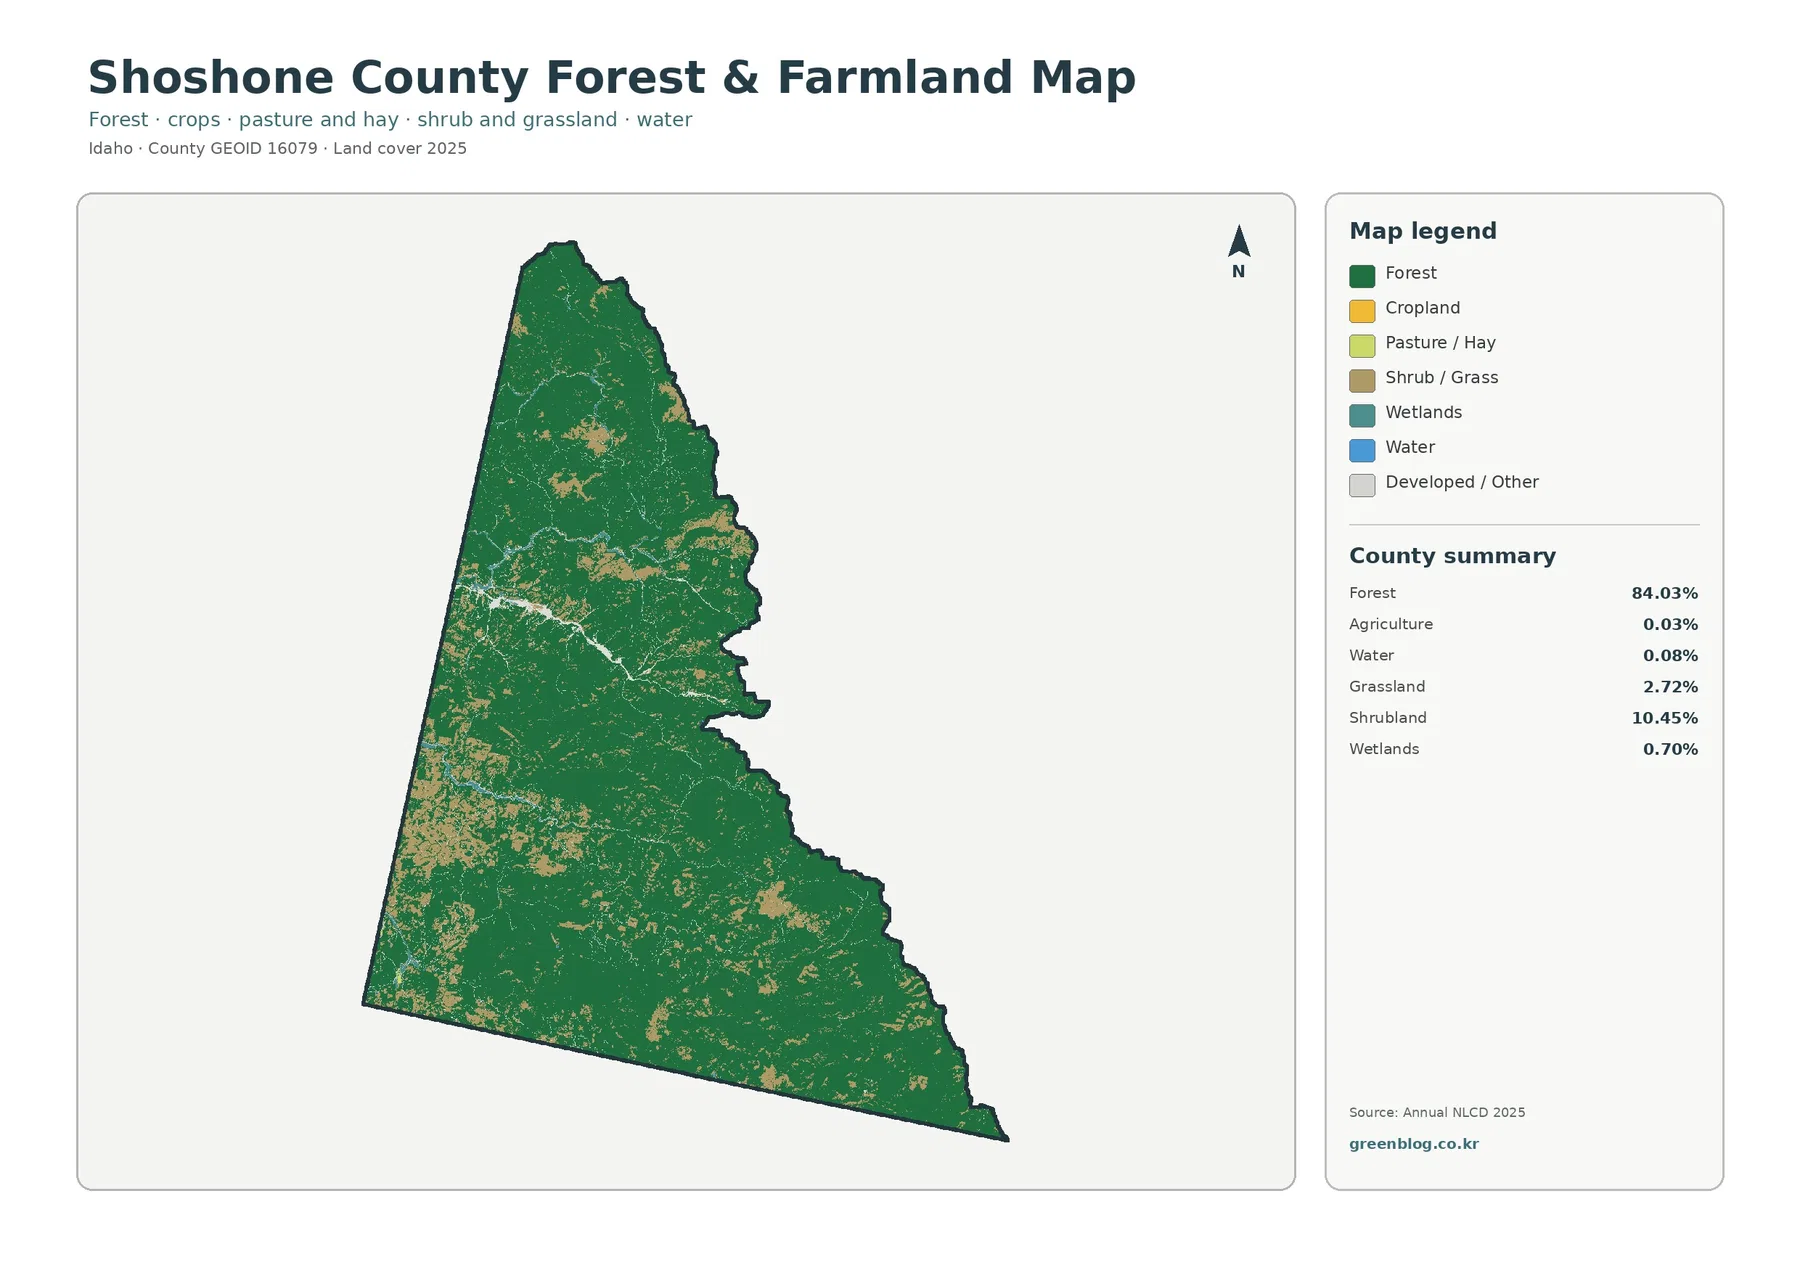
The forest-and-farmland summary reports agriculture at just 0.03%. That is a strikingly small share beside 84.03% forest, 10.45% shrubland, and 2.72% grassland. The broad rectangular farm blocks seen in many agricultural parts of Idaho are essentially absent here. Instead, the visual story is one of continuous forest with irregular shrub and grass openings across rugged country.
Fading developed and miscellaneous surfaces also makes the open mountain patches easier to see. Larger brown areas occur in the southwest, while smaller shrub and grass openings appear through central and northern portions of the county. These openings should not automatically be called ranches, clear-cuts, burns, or mine sites. The map only identifies the cover class visible at the observation date; it does not provide the cause or management history behind each patch.
Wetlands account for 0.70% and open water for 0.08%. On the preview, both appear mainly as small pieces or narrow traces rather than as a large lake or wetland plain. Shoshone County contains the Coeur d’Alene River and St. Joe River systems, but the preview has no hydrologic labels. A blue or teal feature can provide general water context, yet identifying a specific river, tributary, wetland boundary, or regulated area requires a current hydrography or jurisdictional source.
The distinction between surface cover and economic activity is important here as well. Shoshone County’s official page describes both forest resources and a long mining history, but the land-cover map does not measure timber production, mining output, employment, or ownership. A forest-classified cell simply indicates that tree cover was the predominant mapped surface in 2025. Likewise, the very small agriculture percentage describes mapped surface area, not the economic value of every agricultural operation in the county.
The 18.68% endpoint difference is led by cells leaving the forest class
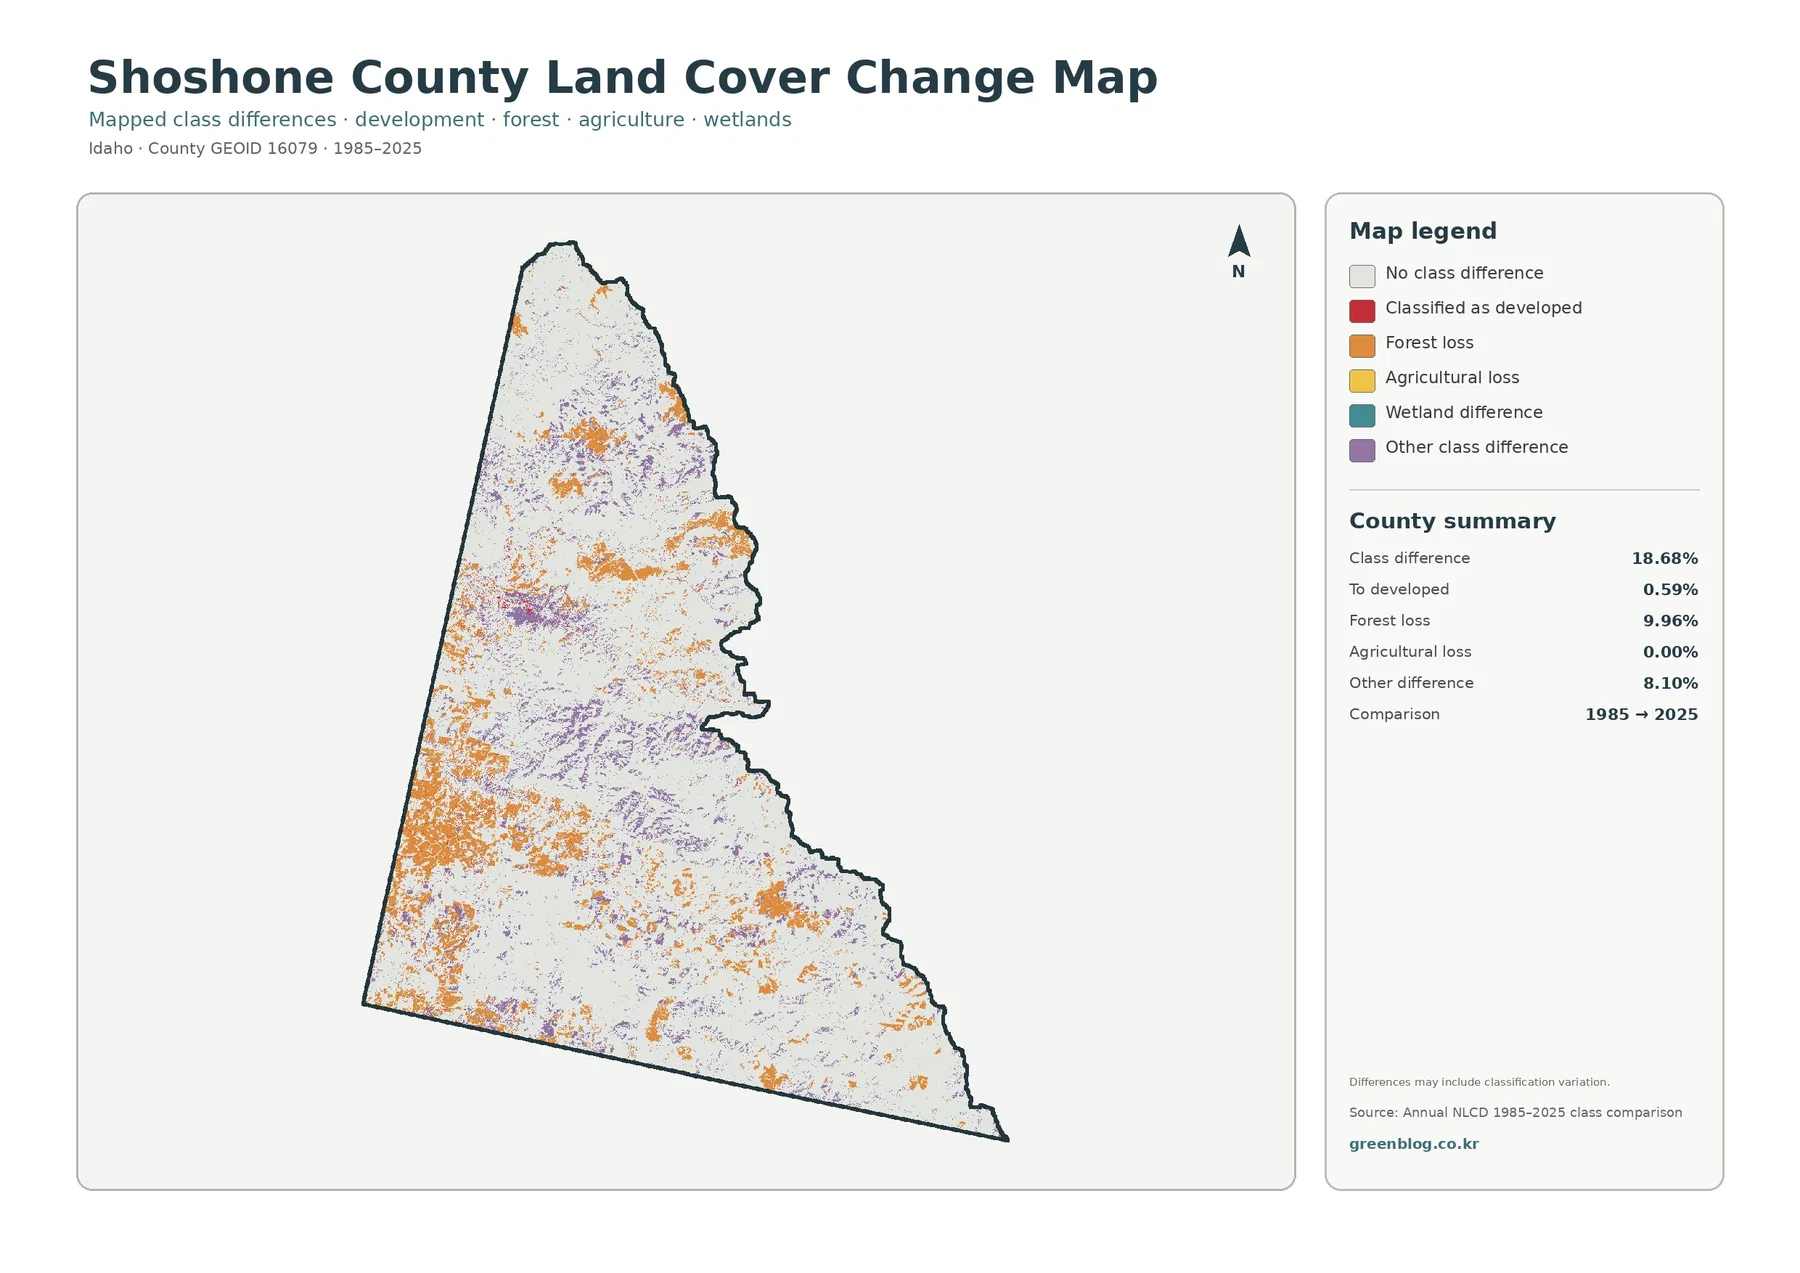
The comparison reports 18.68% total class difference between 1985 and 2025. Forest loss is listed at 9.96%, other class difference at 8.10%, and cells classified as developed at the 2025 endpoint at 0.59%. Agricultural loss is 0.00%. Wetland difference appears in the legend but has no separate percentage in the summary, so it would be incorrect to calculate a residual and present it as an official wetland-change value.
Orange forest-loss cells are widely scattered, with especially noticeable concentrations in the southwest and central parts of the county. Smaller orange patches continue into the north and east. Purple other-difference cells form another broad, dispersed pattern across mountain areas. Red developed-conversion marks occupy a much smaller footprint and are easiest to see near the Silver Valley corridor and along a few thinner traces.
“Forest loss” on this map means that a cell classified as forest in 1985 received a different class in 2025. It does not identify logging, wildfire, mining, road construction, landslide, insects, or any other single cause. A true surface change may have happened at any time between the endpoints, and classification variation can also contribute. Annual imagery, fire history, timber records, mining records, and local land-management information would be needed to establish timing and cause.
The note on the map specifically warns that differences may include classification variation. Mountain terrain can complicate image interpretation because slope, shadow, vegetation condition, seasonal moisture, and mixed pixels may influence the assigned class. Small scattered changes near class edges therefore deserve more caution than a large continuous conversion. The map is best used as a screening view that identifies areas worth checking in more detailed time-series sources.
Four views answer different questions about the same forested county
For a basic county profile, start with the 2025 overview. It establishes the 84.03% forest share, the elongated developed corridor, and the shrub and grass openings in one frame. The forest-and-farmland image is a stronger choice when the subject is natural cover because it removes much of the visual competition from development and makes the near absence of agriculture immediately apparent.
The impervious map is better for a discussion of towns, pavement, and concentrated built surfaces. Placing it after the general map helps explain why 1.93% developed land produces only a 0.46% countywide mean impervious value. The change map should normally come after the current-cover views. That sequence reduces the chance that orange forest-loss cells or purple difference cells will be mistaken for present-day land-cover classes.
A classroom comparison does not always need all four images at once. To explain why development looks linear, pair the general map with the impervious view and then add the county’s official description of the Silver Valley corridor. To discuss forest dominance, pair the overview with the forest-and-farmland image. For a long-term comparison, use the 2025 map beside the 1985–2025 difference view and clearly label one as current cover and the other as an endpoint classification comparison.
Scale, observation year, and legal boundaries set the limits of these maps
Annual NLCD uses 30-meter raster cells, meaning the landscape is divided into square grid cells and each cell receives a predominant class. A narrow road, creek, house, forest edge, and grass opening can all occur inside one cell. Enlarging the JPG makes the pixels larger, but it does not reveal parcel detail that was never part of the source data. Site-level work requires higher-resolution imagery and current local records.
The current-cover maps represent the supplied 2025 observation year. Later wildfire, timber harvest, vegetation recovery, construction, road work, mining activity, or changes in surface moisture may not be shown. The 1985–2025 map also compares two endpoints rather than providing a complete story for every year in between. A cell could change more than once and still finish in the same class, leaving that intermediate history invisible in a simple endpoint comparison.
None of the four maps establishes zoning, property ownership, mine claims, forest-management jurisdiction, wetland jurisdiction, flood zones, or legal road access. A developed cell does not mean the land can be built on, and a wetland-colored cell is not automatically a regulatory wetland boundary. The maps are broad reference graphics for understanding county-scale surface patterns and for deciding what more specific official source should be consulted next.
What is included in the four-JPG download
The download contains one original-size JPG for 2025 land cover, forest and farmland, impervious surface and developed land, and 1985–2025 land-cover change. Each image measures 2480 × 1754 pixels. The package does not state that the files meet an A3 high-resolution reference, so anyone preparing a large poster should test the final print size before relying on fine labels and legend text.
For reports and presentations, keep the legend and source area visible so the class colors remain understandable. A county introduction can use the general map as the main image, then add the impervious map for the Silver Valley corridor or the forest-focused map for natural-cover discussion. If the change map is used, the caption should mention 1985–2025 so readers do not mistake its colors for a current land-cover layer.
Frequently Asked Questions
Is Shoshone County really more than 80% forest on this map?
Yes. The supplied 2025 Annual NLCD summary lists forest at 84.03%, far above shrubland at 10.45%, grassland at 2.72%, and developed land at 1.93%. The percentage describes mapped surface cover, however, not ownership or the agency responsible for managing the forest.
Does the long developed band show the exact boundary of the Silver Valley cities?
No. The official county website says the incorporated cities extend along the I-90 corridor known as the Silver Valley, and the elongated developed cluster broadly matches that setting. The land-cover image does not contain municipal boundaries or road labels, so exact city limits and highway positions require official administrative and transportation maps.
Does 9.96% forest loss mean that all of that area was logged?
No. It is the share of cells that were classified as forest in 1985 and received a different class in 2025. Logging is only one possible explanation among many, and classification variation may also be present. Establishing the cause requires intermediate imagery and relevant fire, forestry, mining, or land-management records.
Sources and Reference Data
- MRLC Annual NLCD Data – official access point for current and annual land-cover products
- USGS Annual NLCD Land Cover Classification – definitions and guidance for forest, shrubland, developed land, wetlands, and related classes
- U.S. Census Bureau TIGER/Line Shapefiles – official county-boundary reference for Shoshone County
- Shoshone County, Idaho official website – county information describing the Silver Valley, the I-90 city corridor, and the county’s forested setting
- Shoshone County All Hazard Mitigation Plan – official local context for the Coeur d’Alene River, St. Joe River, elevation, and mountain setting
Map File Information
The ZIP contains four original JPG maps for comparing Shoshone County's forest-dominated 2025 surface, the Silver Valley development corridor, impervious cover, and 1985–2025 class differences.
- Included Files: Map files described in this article
- File Type: JPG maps packaged in a ZIP archive
- Intended Use: Printing, education, presentations, and map-based projects
Related Maps
Green Map creates custom-edited map images using open geographic data sources such as geoBoundaries, Natural Earth, OpenStreetMap, and government open data. These maps are edited visual materials, not raw data files, and are provided for education, documents, presentations, and graphic reference.