High-resolution A3 JPG files for this Chester County Tennessee Map are available in the ZIP download box below. Chester County lies in West Tennessee, and Henderson is the clearest starting point for understanding its shape. Henderson sits in the west-central part of the county, while Enville and Milledgeville pull the eye eastward and Silerton marks the southwest. That spread matters because the county is not a compact circle around one town; it has a long east-west body, a northern extension, and a pronounced southwest projection.
Start with the county reference map when you need settlements, route numbers, nearby counties, and streams on one page. The city view removes most of that detail so Henderson and Enville stand out clearly. For physical geography, the water sheet names the South Fork Forked Deer River and a web of creeks, while the elevation sheet shows an actual range of about 113 to 222 meters, with a mean of 147 meters. Placing those physical layers beside the road map makes the connection between valleys, higher ridges, and travel corridors much easier to see.
Table of Contents
Henderson gives the irregular county outline a useful center of reference
Chester County has a distinctive outline. A broad section stretches east from the Henderson area, the northern boundary rises into a narrow projection, and the southwest portion drops well below the main east-west body. Henderson sits where several route lines meet in the western half, so it works as a practical anchor when tracing the rest of the county. Enville lies much farther east, Milledgeville approaches the eastern edge, and Silerton occupies the southwest side.
The reference map labels route numbers 100 and 200 around Henderson, with 5 and 45 extending south from the city area. Farther east, 22A and 22 help connect the Enville–Milledgeville side, while 125 and 225 appear toward the southwest. Rather than treating those numbers as a checklist, it is more useful to notice how the roads fan away from Henderson and then follow the county’s long shape toward its outer communities.
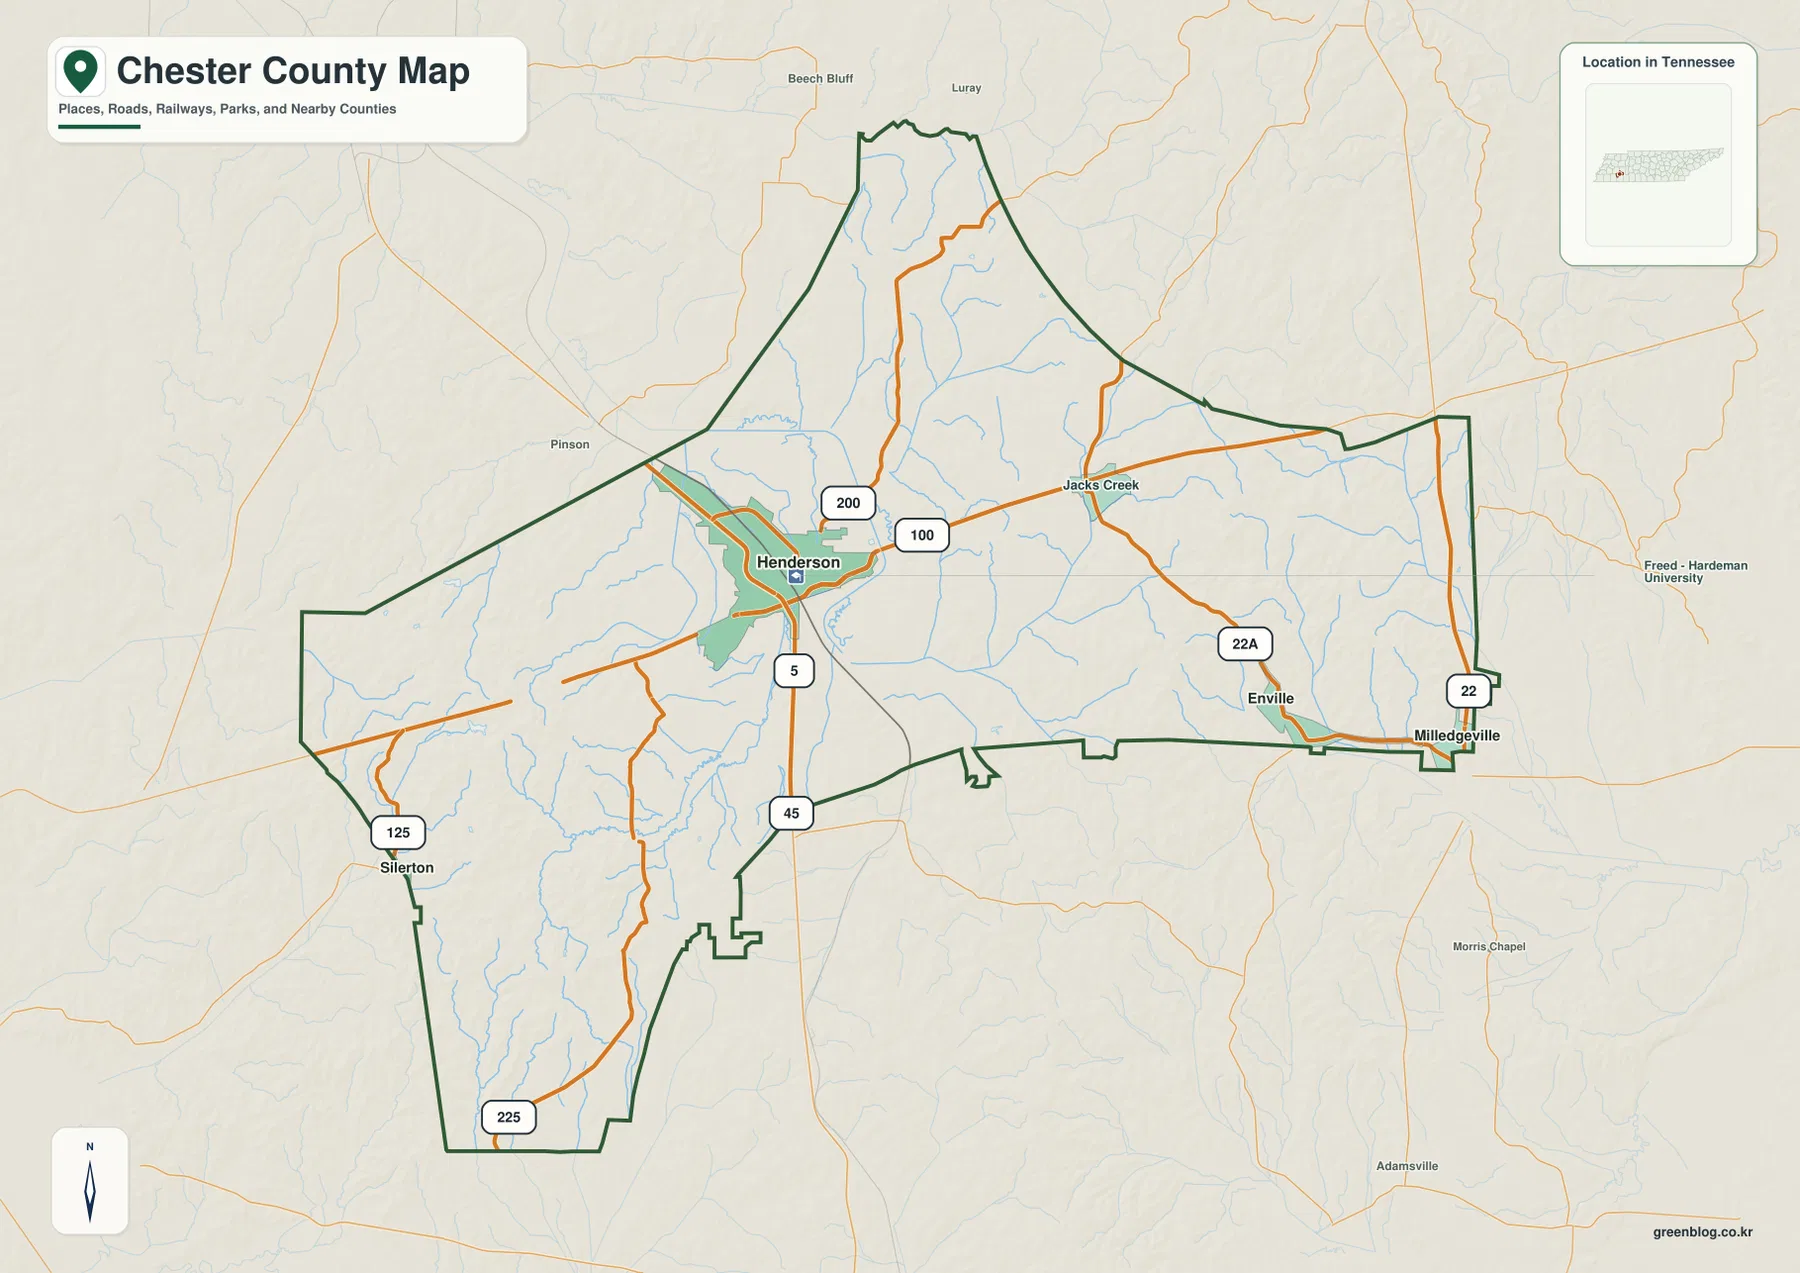
The surrounding labels add important context. Henderson County is shown to the north, Hardin County to the east, McNairy County and Madison County to the west side, and Hardeman County to the southwest. Those neighboring names make edge locations easier to interpret. Milledgeville, for example, makes more sense when read as an eastern-edge community rather than simply as another dot at the same distance from Henderson.
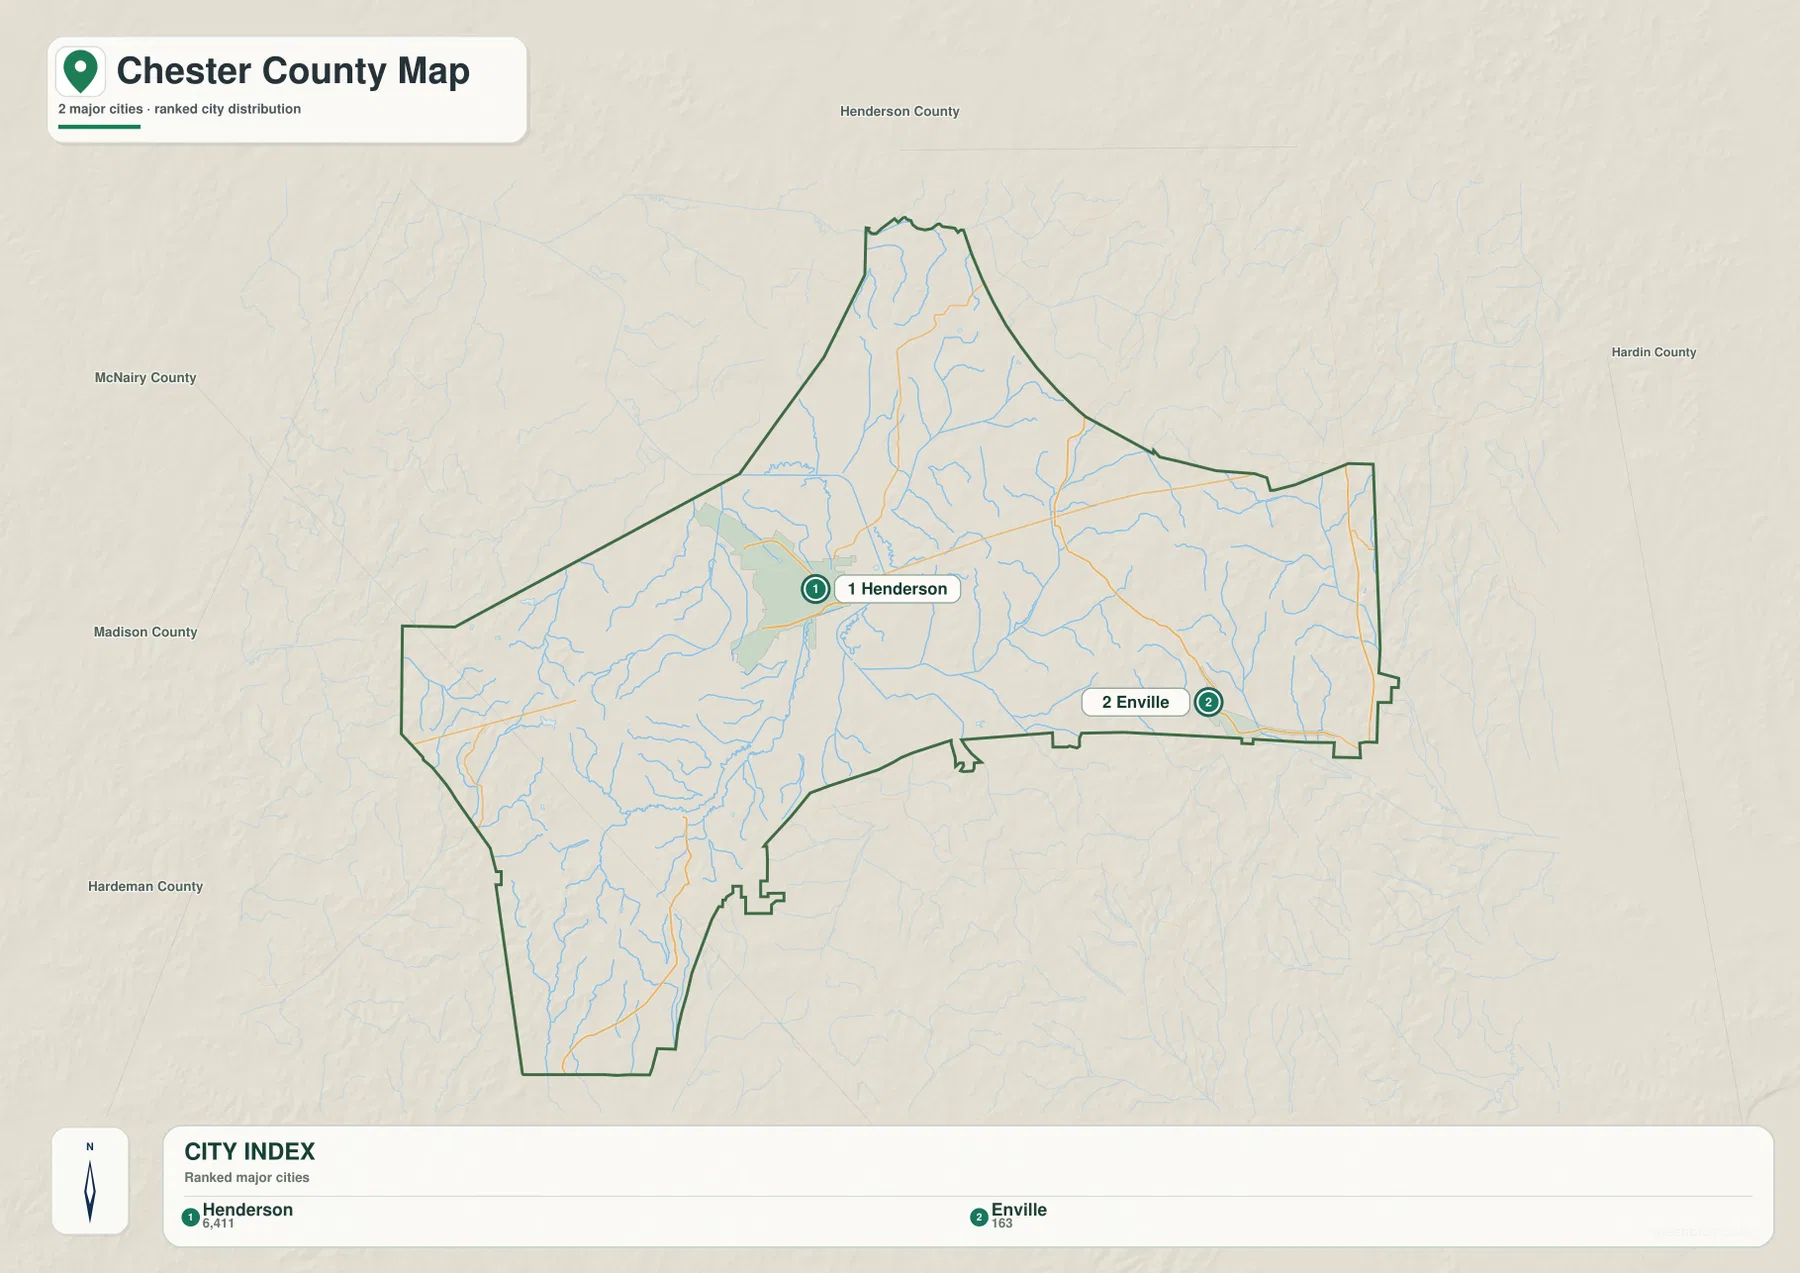
The city map reduces the county to two very different population anchors
The supplied city index ranks Henderson first at 6,411 and Enville second at 163. The map does not present those figures as a complete inventory of every settlement. Instead, it uses two labeled cities to show the contrast between the county’s main urban and administrative center and a much smaller community on the eastern side. Henderson’s position is west of the geographic middle, while Enville sits close to the long eastern portion of the county.
This simplified view is especially helpful after looking at the busier reference map. Milledgeville, Silerton, and other labels disappear, allowing the eye to focus on the distance and direction between Henderson and Enville. The absence of smaller places should not be interpreted as empty land; the map is intentionally ranked and selective. For a more complete settlement picture, the city map should be paired with the county reference view.
Countywide population provides another scale for comparison. The 2020 census counted 17,341 residents, and the package’s July 2025 Census estimate is 17,994. The 2025 Gazetteer figures list about 285.7 square miles of land and 0.2 square miles of water. Those values describe the county as a whole, so they should not be read as a direct measure of how densely every road corridor or community is settled.
The South Fork Forked Deer River is only one part of a dense creek network
The water map shows why a single river name does not describe Chester County’s drainage. The South Fork Forked Deer River appears in the north-central portion, but many named creeks branch across the county. Clarks Creek crosses the northern interior, Jacks Creek and Sandy Creek stand out farther east, and Little White Oak Creek and Middleton Creek help define the eastern side. The result is a landscape cut by many short valleys rather than one broad river corridor.
West of Henderson, Dry Creek and Turkey Creek add another set of channels, while Sugar Creek runs through the southern part of the map. Scott Lake and Lake Placid are marked in the west, and Smith Pond appears farther south. These smaller water bodies are useful orientation points, but the most informative feature is the way the named streams repeat across the county from west to east.
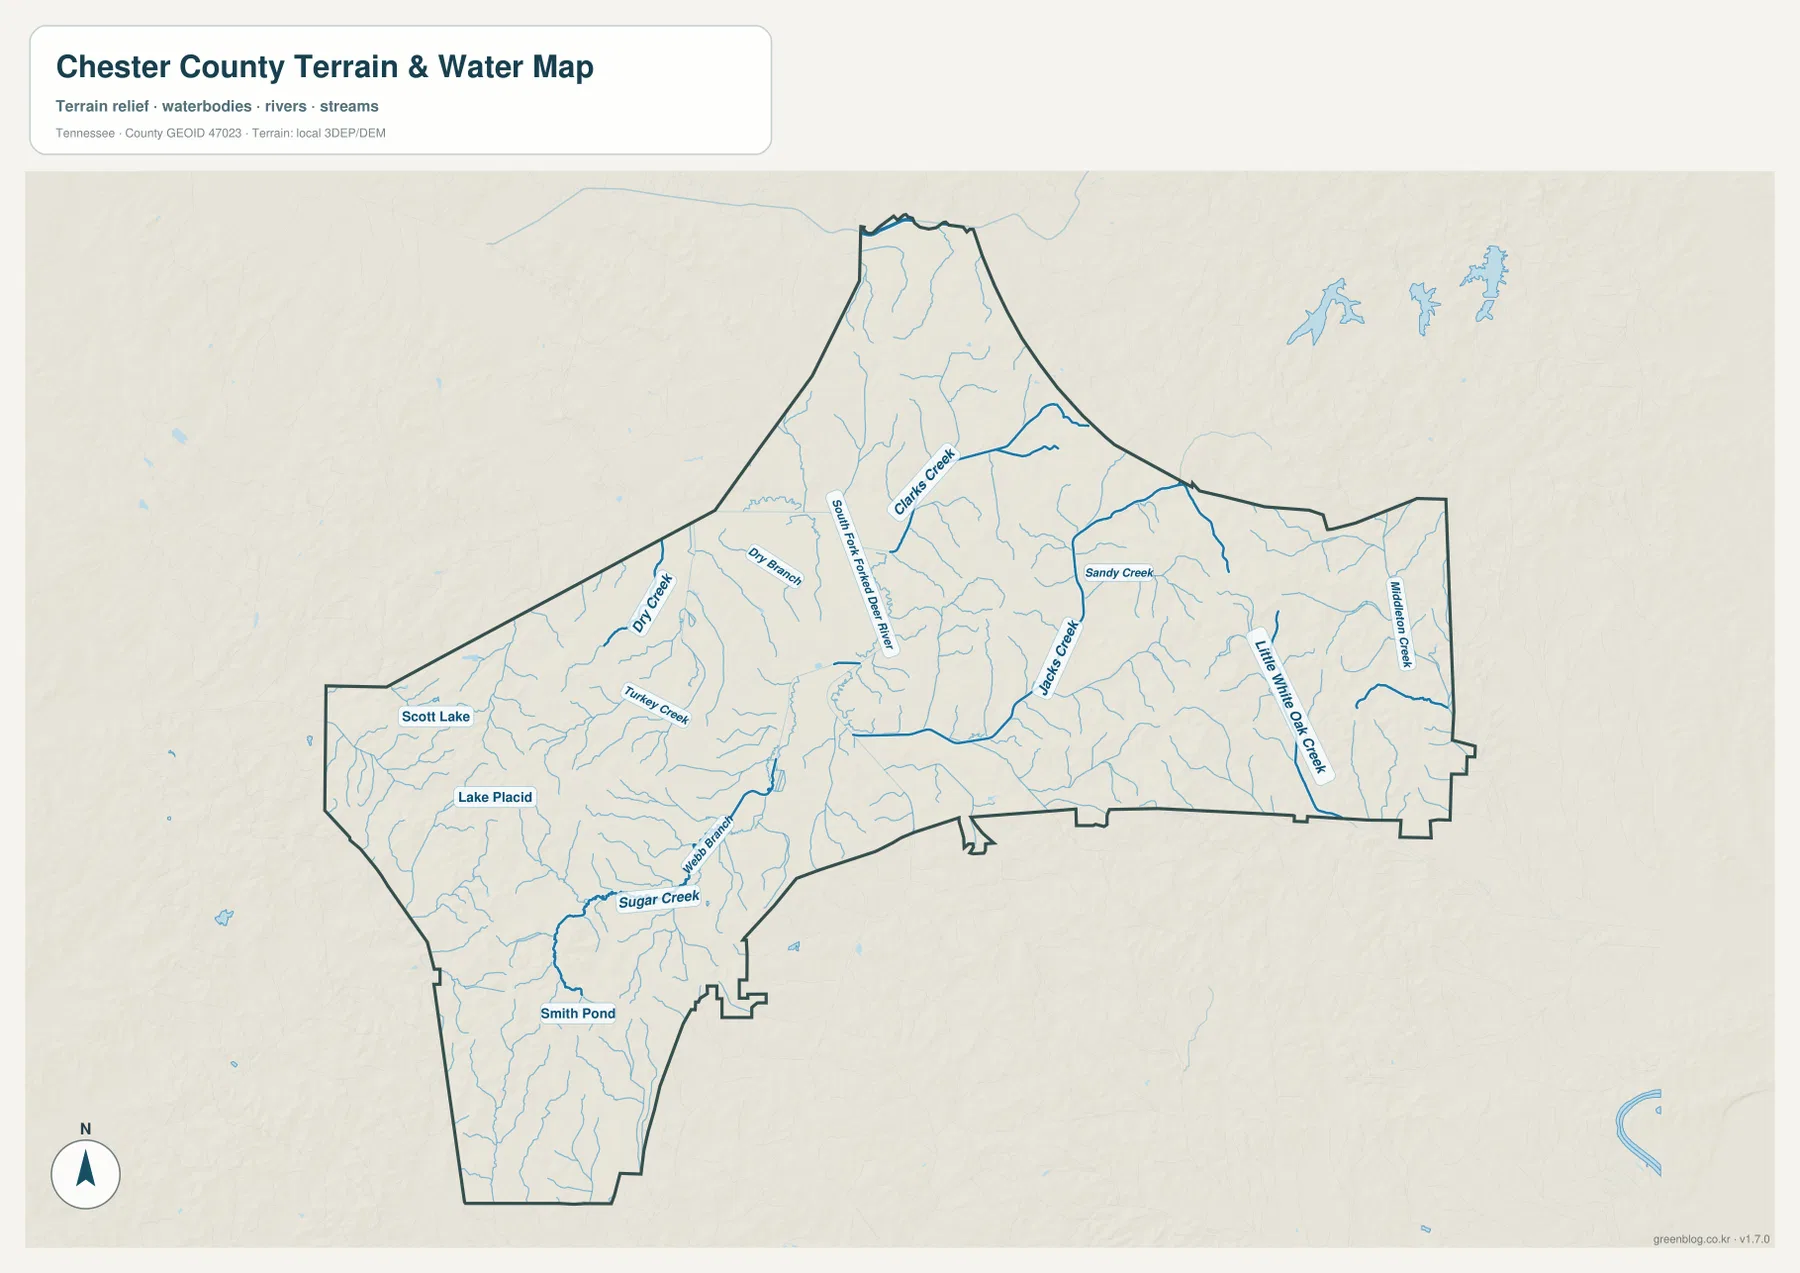
This is a county-scale water-reference map, not a flood-risk, navigation, or property-boundary product. It is best used to identify which named stream lies near a road or community and to compare the western and eastern drainage patterns. Current bridge conditions, water levels, access points, and flood information require separate up-to-date sources.
A 113–222 meter range separates broad low ground from short, repeated ridges
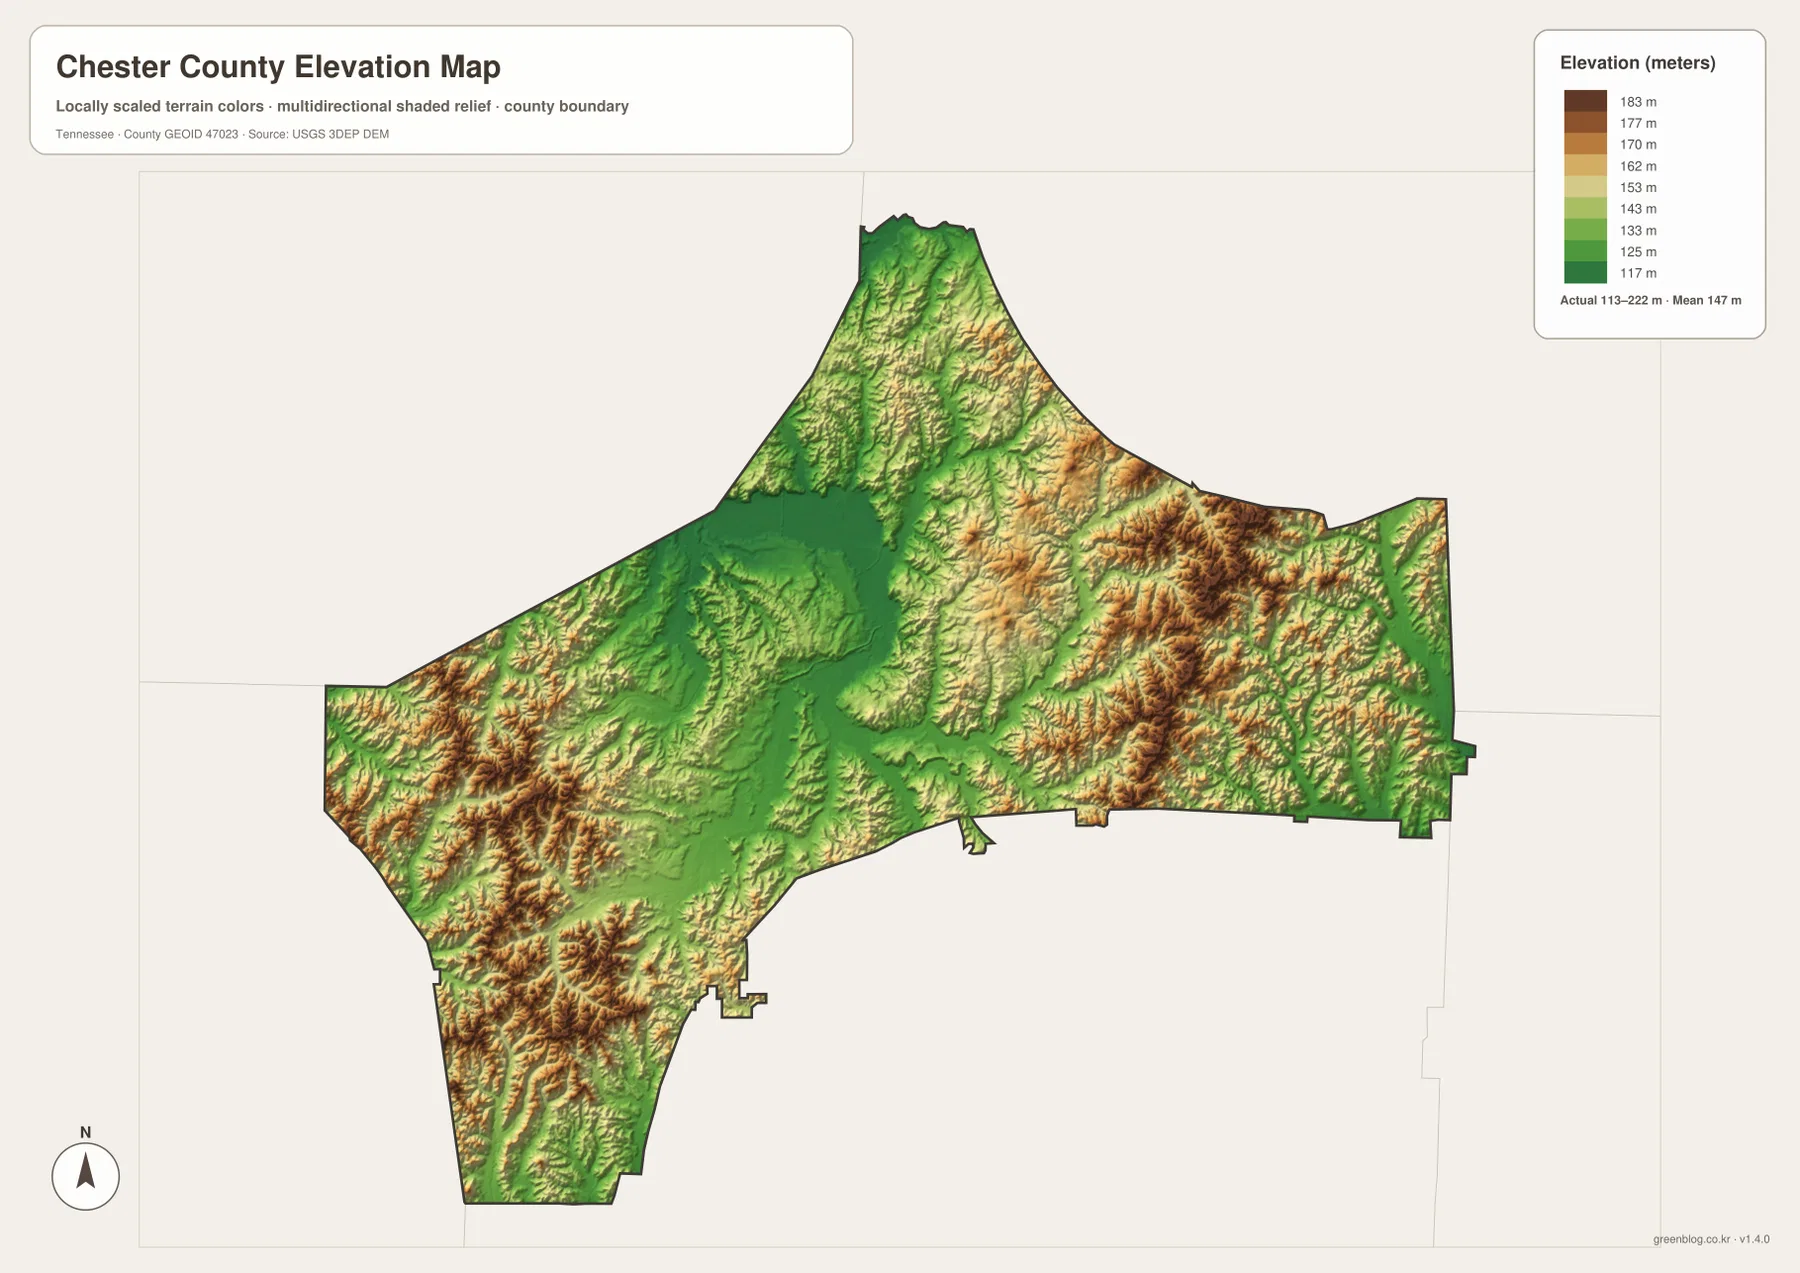
The elevation map reports an actual county range of roughly 113 to 222 meters and a mean of 147 meters. Green shades dominate a broad low area through the west-central interior around Henderson, while browner colors mark higher ground in the east-central section and across parts of the southwest. The northern extension also contains closely spaced ridges and hollows instead of a single flat upland.
That pattern becomes clearer when the elevation and water maps are viewed side by side. Streams occupy the lower folds between ridges, and several route corridors follow or cross those lower areas. Jacks Creek, Sandy Creek, and the South Fork Forked Deer system can therefore be understood as part of the terrain rather than as blue lines placed on an otherwise flat county. The elevation surface is generalized for county comparison, so it should not be used as survey-grade height data for a parcel or construction site.
Roads make more sense when the boundary and terrain are read first
Because Henderson is west of the county’s center, travel toward Enville and Milledgeville naturally crosses a long stretch of Chester County. The eastern routes pass through a landscape where the elevation map shows more frequent ridges and the water map shows Jacks Creek, Sandy Creek, Little White Oak Creek, and other tributaries. To the southwest, the county narrows and extends toward the Silerton side, where route numbers 125 and 225 provide useful reference points.
Chester County was established in 1879, and Henderson is the county seat. That administrative fact is helpful, but the current maps are most useful for seeing today’s physical arrangement: where Henderson sits inside the boundary, how Enville and Milledgeville pull the settlement pattern eastward, and how roads cross a heavily dissected network of creeks and low ridges. Readers comparing neighboring counties can use the labeled Henderson, Hardin, McNairy, Madison, and Hardeman county names to keep edge locations in the correct jurisdiction.
Choose the file by the question you need to answer
Use the county reference map when you need roads, communities, the county outline, and nearby places on one page. The city view is cleaner for comparing Henderson and Enville. The water map is the better choice for finding a named creek or seeing how tributaries spread across the county, and the elevation map is most useful when the difference between low valleys and higher ridges matters. For classroom or presentation work, the maps can also be used as separate layers of explanation rather than forcing all information onto one crowded image.
For annotation, a useful approach is to keep one clean copy and mark a second copy with route numbers, creek names, or neighboring-county directions. On the elevation sheet, use the legend rather than assuming that a darker patch represents a specific mountain or public-land boundary. On the water sheet, treat the blue network as a location reference and not as a statement about current depth or flood conditions.
Frequently Asked Questions
Why does Henderson dominate the city map while Enville still matters?
Henderson is the county seat and the city index places it far above Enville in the ranked view. Enville still matters because it marks the eastern half of the county and gives the reader a second urban reference well away from Henderson. Together they make the county’s long east-west layout much easier to recognize.
What does the water map add that the road map does not show as clearly?
It names the South Fork Forked Deer River and many smaller creeks, including Jacks Creek, Sandy Creek, Sugar Creek, and Clarks Creek. Those labels reveal how frequently roads and communities sit near narrow drainage valleys. The map is useful for orientation, but it does not replace current flood, bridge, or boating information.
How should I interpret the 113–222 meter elevation range?
Use it to compare broad parts of the county. The map shows lower terrain through much of the central-western area and higher ridges in the east-central and southwestern sections. The 147-meter mean is a countywide summary, not the elevation of Henderson or any individual property.
Map File Information
The ZIP contains the original high-resolution A3 JPG versions of the Chester County reference, city, water, and elevation maps. Use these files when you need a larger print or an editable base for notes and presentation work.
- Included Files: County map, city map, water map, elevation map
- File Type: ZIP containing 4 JPG files
Related Maps
Sources and References
County history and background can be checked through the Tennessee State Library and Archives Chester County fact sheet. Regional information about Chickasaw State Forest is available from the State of Tennessee.
Boundary and Census geography references come from U.S. Census Bureau TIGER/Line, with population and area context from U.S. Census Bureau QuickFacts and Gazetteer files. Water-feature references are based on USGS National Hydrography, and the elevation layer follows the general framework of the USGS 3D Elevation Program.
Green Map creates custom-edited map images using open geographic data sources such as geoBoundaries, Natural Earth, OpenStreetMap, and government open data. These maps are edited visual materials, not raw data files, and are provided for education, documents, presentations, and graphic reference.