This Cheatham County Map is built around a county with three distinct settlement areas: Ashland City near the middle, Pleasant View to the north, and Kingston Springs with Pegram near the southern end. The Cumberland River cuts across the center while the Harpeth River winds through the south, so roads, towns, and terrain make more sense when those two river systems are viewed together. High-resolution A3 JPG files for the county, city, water, and elevation maps are available in the ZIP download below.
Cheatham County is long from north to south rather than compact. Ashland City sits close to the Cumberland River and provides the clearest administrative reference, but it is not the only useful anchor. Pleasant View occupies a separate northern position, while Kingston Springs and Pegram sit close to the southern edge near the I-40 and US 70 corridor. That layout makes the county easier to understand as a chain of connected valleys and communities than as one continuous urban area.
Table of Contents
Ashland City is the central anchor, not the center of every trip
Ashland City is the county seat and appears beside the Cumberland River in the central part of the map. SR 12, SR 49, and SR 249 connect the area with different parts of the county, making the town the best starting point for orientation. The county outline broadens toward Pleasant View in the north, narrows through the middle, then extends south toward Kingston Springs. The unusual outline is important because straight-line directions can hide how much the river valleys and ridges shape actual travel.
The surrounding labels also help fix the county in Middle Tennessee. Robertson County is shown beyond the north, Davidson County on the east, Williamson County to the southwest, Dickson County to the west, and Montgomery County toward the northwest. Several roads and streams continue across those boundaries, so a feature near the edge should be read as part of a larger regional network rather than as something that stops at the county line.
The mapped communities form a northern, central, and southern pattern
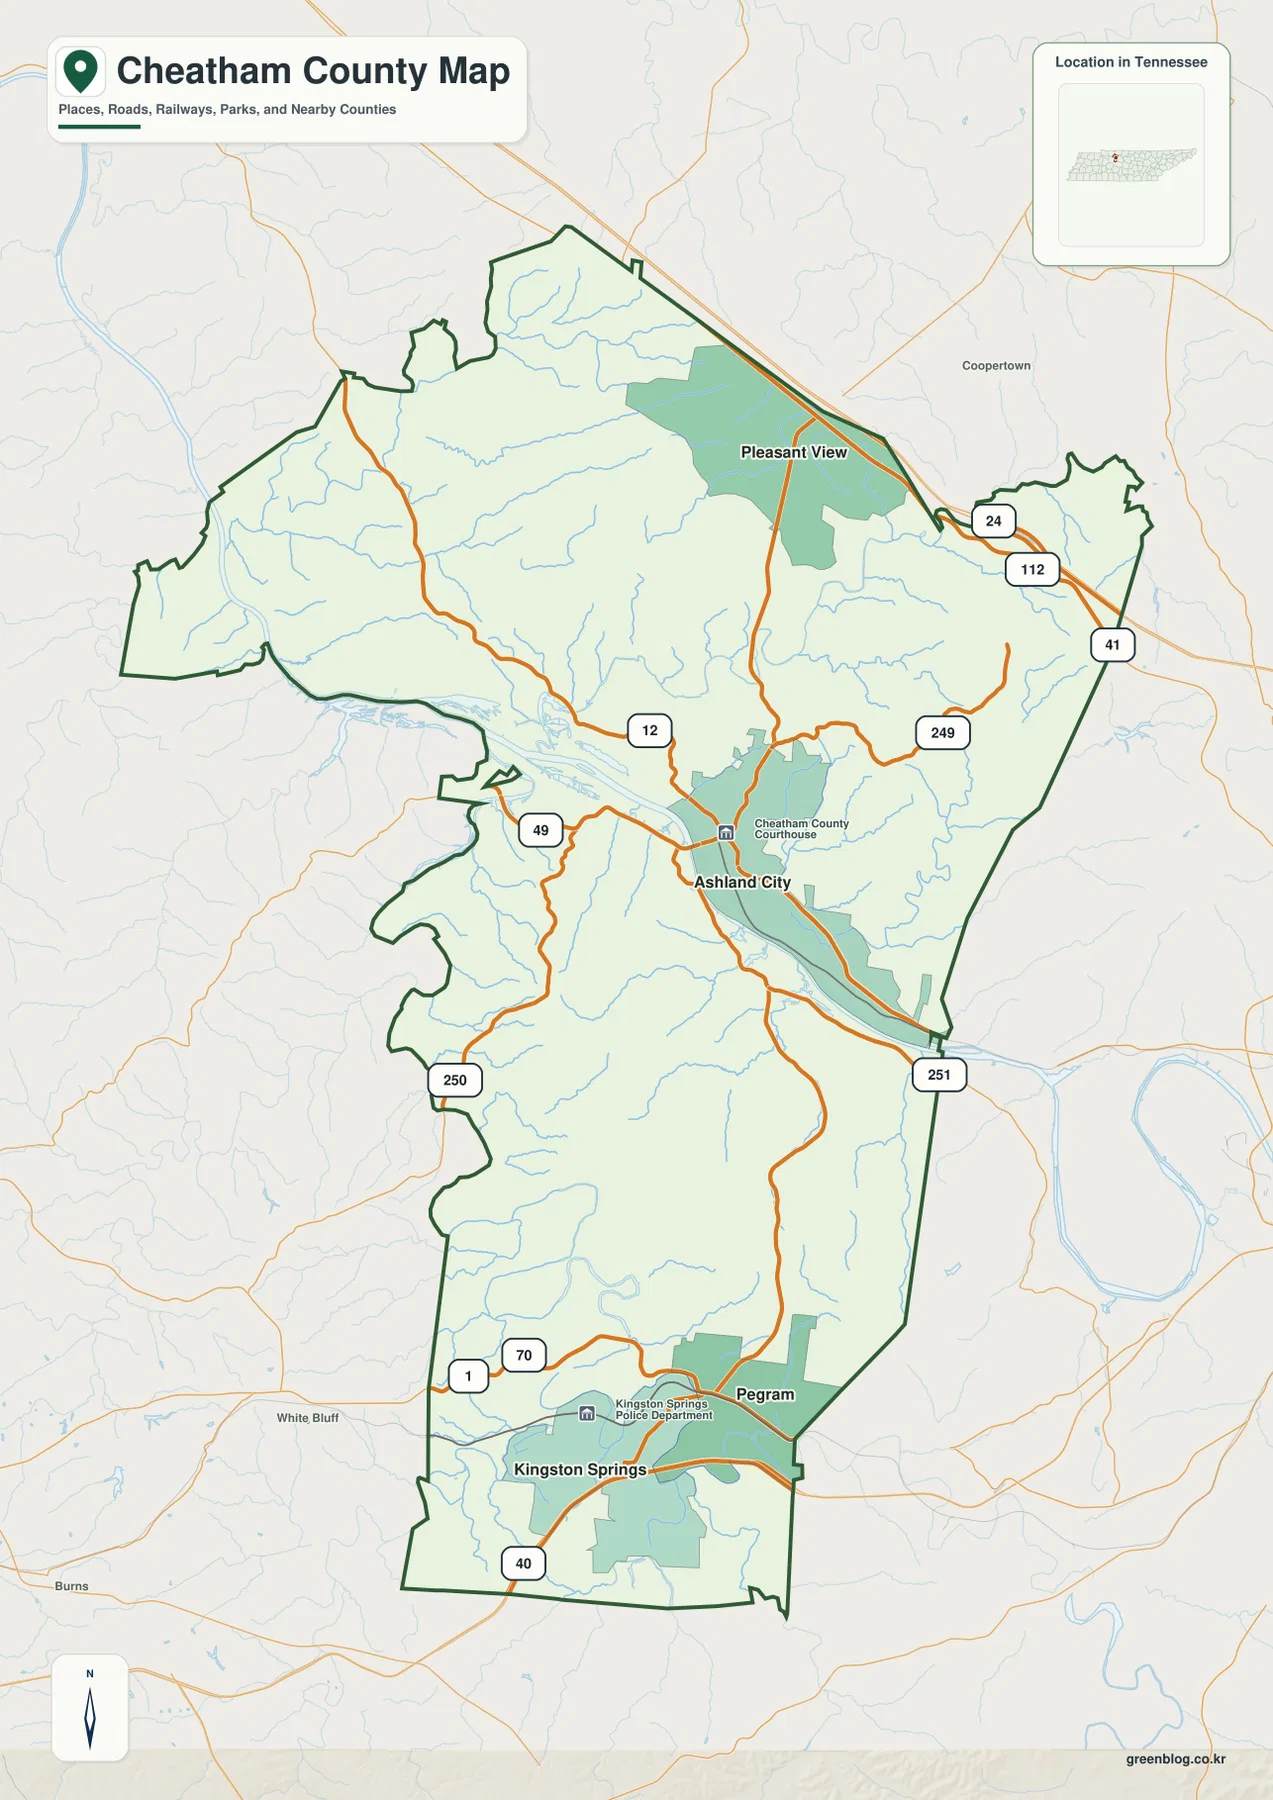
The city-connections map separates four named communities clearly. Ashland City is the hub in the central section. Pleasant View lies well to the north, while Kingston Springs and Pegram are grouped near the southern end. This spacing explains why a single town-centered view misses much of the county: residents and routes are distributed along several corridors, and the Cumberland River separates parts of the central landscape before the map reaches the southern Harpeth River area.
The map labels Ashland City with 5,424 people, Pleasant View with 5,276, Kingston Springs with 2,797, and Pegram with 2,099. Those figures are useful for comparing the mapped towns, but they are not a substitute for the county total. The package’s existing verified material lists 41,072 residents in the 2020 census and a July 2025 estimate of 42,778. Keeping the town labels and county totals separate avoids treating the four mapped communities as if they contained everyone in Cheatham County.
The Cumberland River creates the county’s broad central lowland
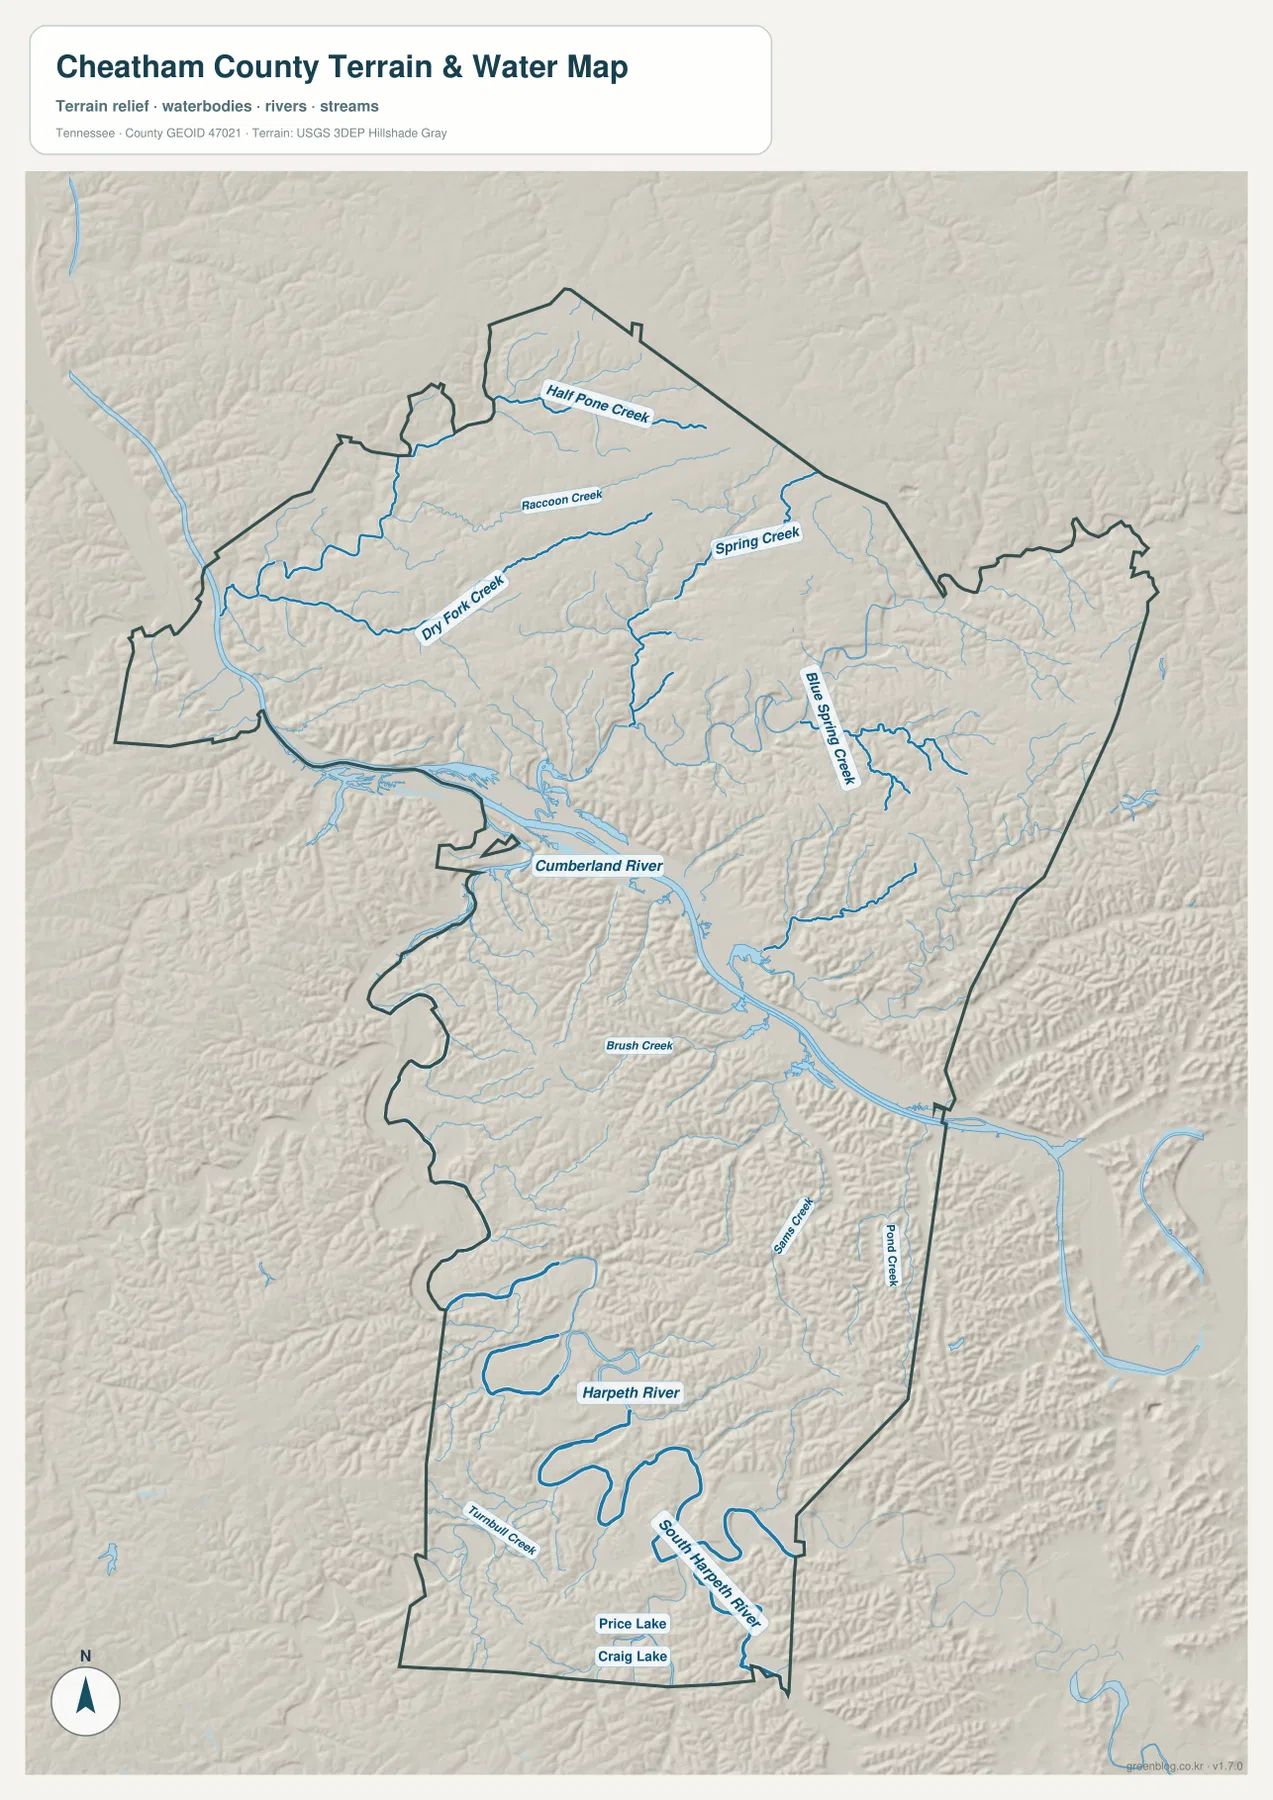
The water map makes the Cumberland River the dominant feature in central Cheatham County. It enters from the west, follows a broad course past the Ashland City area, and leaves toward the southeast. The river is much wider than the surrounding creeks, and several bends create long stretches of low ground that stand out even more clearly on the elevation map. Ashland City’s position next to this water corridor helps explain why the town is such a useful point for comparing roads, river crossings, and nearby terrain.
North of the Cumberland, a network of smaller streams drains the rolling uplands. Half Pone Creek, Raccoon Creek, Dry Fork Creek, Spring Creek, and Blue Spring Creek are all labeled. They do not form a single straight channel; instead they occupy separate valleys that ultimately feed the larger river system. Reading them as a branching network is more useful than treating the names as a checklist because the valleys help explain where lower ground cuts through the northern hills.
South of Ashland City, the Harpeth River changes the landscape again
The southern part of Cheatham County is organized around a different river system. The Harpeth River makes a series of large loops near Kingston Springs, and the South Harpeth River enters from the southeast. Turnbull Creek, Sam Creek, and Pond Creek are also labeled in this area, while Price Lake and Craig Lake appear close to the southern boundary. The concentration of bends and tributaries makes this part of the county look very different from the broad Cumberland corridor farther north.
Kingston Springs and Pegram sit near this more tightly folded river-and-ridge landscape. On a simple road map the two towns may appear close to Nashville and to one another, but the water map shows why travel directions can bend around valleys rather than following a straight line. The map is not intended for turn-by-turn navigation, yet it is valuable for explaining why local roads often follow drainage routes, cross streams at limited points, or curve around higher ground.
Elevation ranges from about 110 to 275 meters
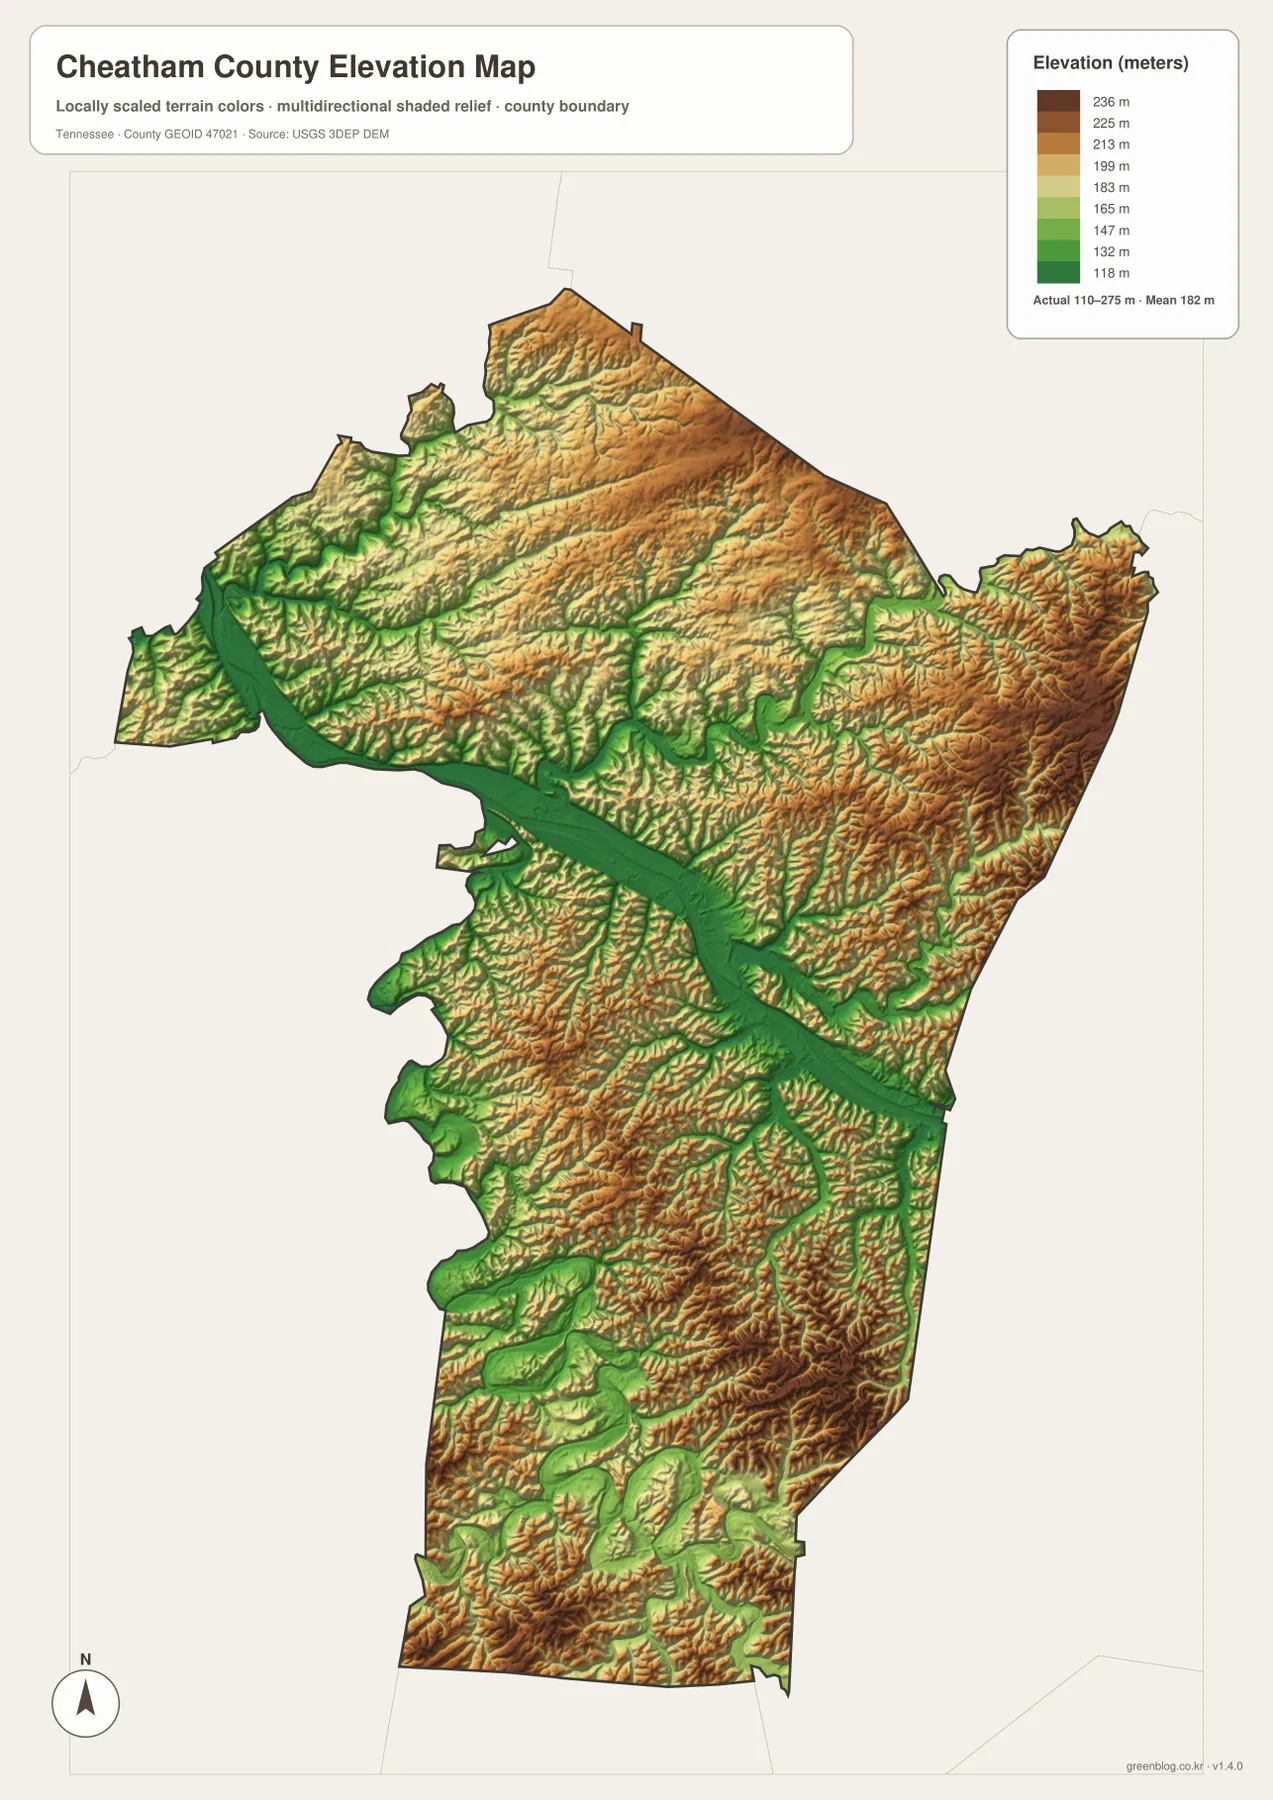
The elevation map shows an actual range of roughly 110 to 275 meters, with a mean elevation of 182 meters. The lowest green areas follow the Cumberland River and the Harpeth River, while yellow and brown ridges rise on both sides of the valleys. Cheatham County is therefore not defined by one isolated mountain. Its relief comes from many short, repeated changes between creek bottoms, river terraces, slopes, and ridge tops.
Higher ground is especially noticeable across the eastern and southern parts of the county, although deeply cut valleys also appear in the northwest. The Cumberland corridor forms the strongest low-elevation band through the middle. Comparing this image with the road map explains why some routes are direct across gentler areas while others bend repeatedly: the network has to cross a landscape of ridges and drainage valleys rather than a flat plain.
Roads connect the settlement clusters through the river-and-ridge terrain
Ashland City is served by SR 12 and SR 49, with SR 249 extending toward the east and northeast. Pleasant View is closer to the I-24 and US 41A side of the county, while Kingston Springs sits near US 70 and I-40 at the southern end. SR 250 and SR 251 provide additional connections along the outer parts of the county. These routes are easier to interpret when the river and elevation maps are kept nearby because the shape of the land often explains why a road does not take the shortest geometric path.
The central Cumberland corridor is the most obvious example. Roads approach Ashland City from several directions but have to work around a wide river and adjoining lowland. In the south, the Harpeth River and its tributary valleys produce another set of curves and crossing points. Pleasant View is separated from Ashland City by a broad upland area, so the northern route network has a different character from the southern I-40 corridor around Kingston Springs.
Which Cheatham County map should you use first?
For general orientation, start with the county map because it combines the boundary, Ashland City, the other major community labels, and the principal roads. Use the city map when you need to compare the location of Pleasant View with the southern Kingston Springs–Pegram pair. The water map is the best choice for tracing the Cumberland and Harpeth systems, and the elevation map is the clearest way to see the repeated ridges and low valleys that shape the road network.
The four A3 JPG files work well as a set because each removes some clutter and emphasizes a different question. For example, a classroom or planning comparison can begin with the county map, use the water image to mark the two main river systems, then add the elevation image to explain why roads and communities occupy certain corridors. Keeping the files separate also makes them easier to print, annotate, or place in a presentation without forcing every layer onto one page.
Frequently Asked Questions
Why is Ashland City the best place to start reading the map?
Ashland City is the county seat, sits close to the Cumberland River, and lies near several important state routes. That combination makes it a useful administrative and geographic anchor. From there, Pleasant View can be placed to the north and Kingston Springs with Pegram to the south, giving the county a clear internal frame before smaller roads and streams are added.
Do the Cumberland River and Harpeth River cross the same part of Cheatham County?
No. The Cumberland River is the large central waterway near Ashland City, while the Harpeth River forms broad loops in the southern part of the county around the Kingston Springs area. Comparing the two on the water map is one of the quickest ways to distinguish the central and southern landscapes.
What does the elevation map add that the road map does not show?
It shows why the road network bends. Elevation ranges from about 110 to 275 meters, and the lowest ground follows the major river valleys. Higher ridges rise repeatedly between those valleys, so a route that looks indirect on the county map often makes more sense when the terrain image is viewed beside it.
Sources and reference data
County boundaries and basic geographic reference data can be checked through the U.S. Census Bureau TIGER/Line program. Population information is available from U.S. Census Bureau QuickFacts and related county estimate tables.
For the southern river system, the Tennessee Department of Environment and Conservation Harpeth River page provides an official regional reference. Historical county information is available through the Tennessee State Library and Archives Cheatham County fact sheet, and the terrain layer is based on elevation data available through the USGS 3D Elevation Program.
Map File Information
This ZIP contains high-resolution A3 JPG files for the Cheatham County reference, city, water, and elevation maps. Use the larger originals when you need print-quality files or want to add your own labels and notes.
- Included Files: General county, city, water, and elevation maps
- File Type: Four high-resolution A3 JPG files bundled in one ZIP archive
- Intended Use: Printing, education, presentations, and map-based projects
Related Maps
- McNairy County Tennessee map | Selmer and Hatchie Headwaters
- Trousdale County Tennessee map | Hartsville and Cumberland Uplands
- Bedford County Tennessee Map
Green Map creates custom-edited map images using open geographic data sources such as geoBoundaries, Natural Earth, OpenStreetMap, and government open data. These maps are edited visual materials, not raw data files, and are provided for education, documents, presentations, and graphic reference.