You can download four high-resolution A3 JPG maps of Llano County, Texas, in one ZIP directly from this page. The set includes a general county map, a city-connections map, a terrain-and-water map, and an elevation map. Together they show Llano, Kingsland, Horseshoe Bay, Sunrise Beach Village, Buchanan Lake Village, roads 29, 16, and 71, the Llano River system, named creeks, and an actual elevation range of about 250 to 580 meters.
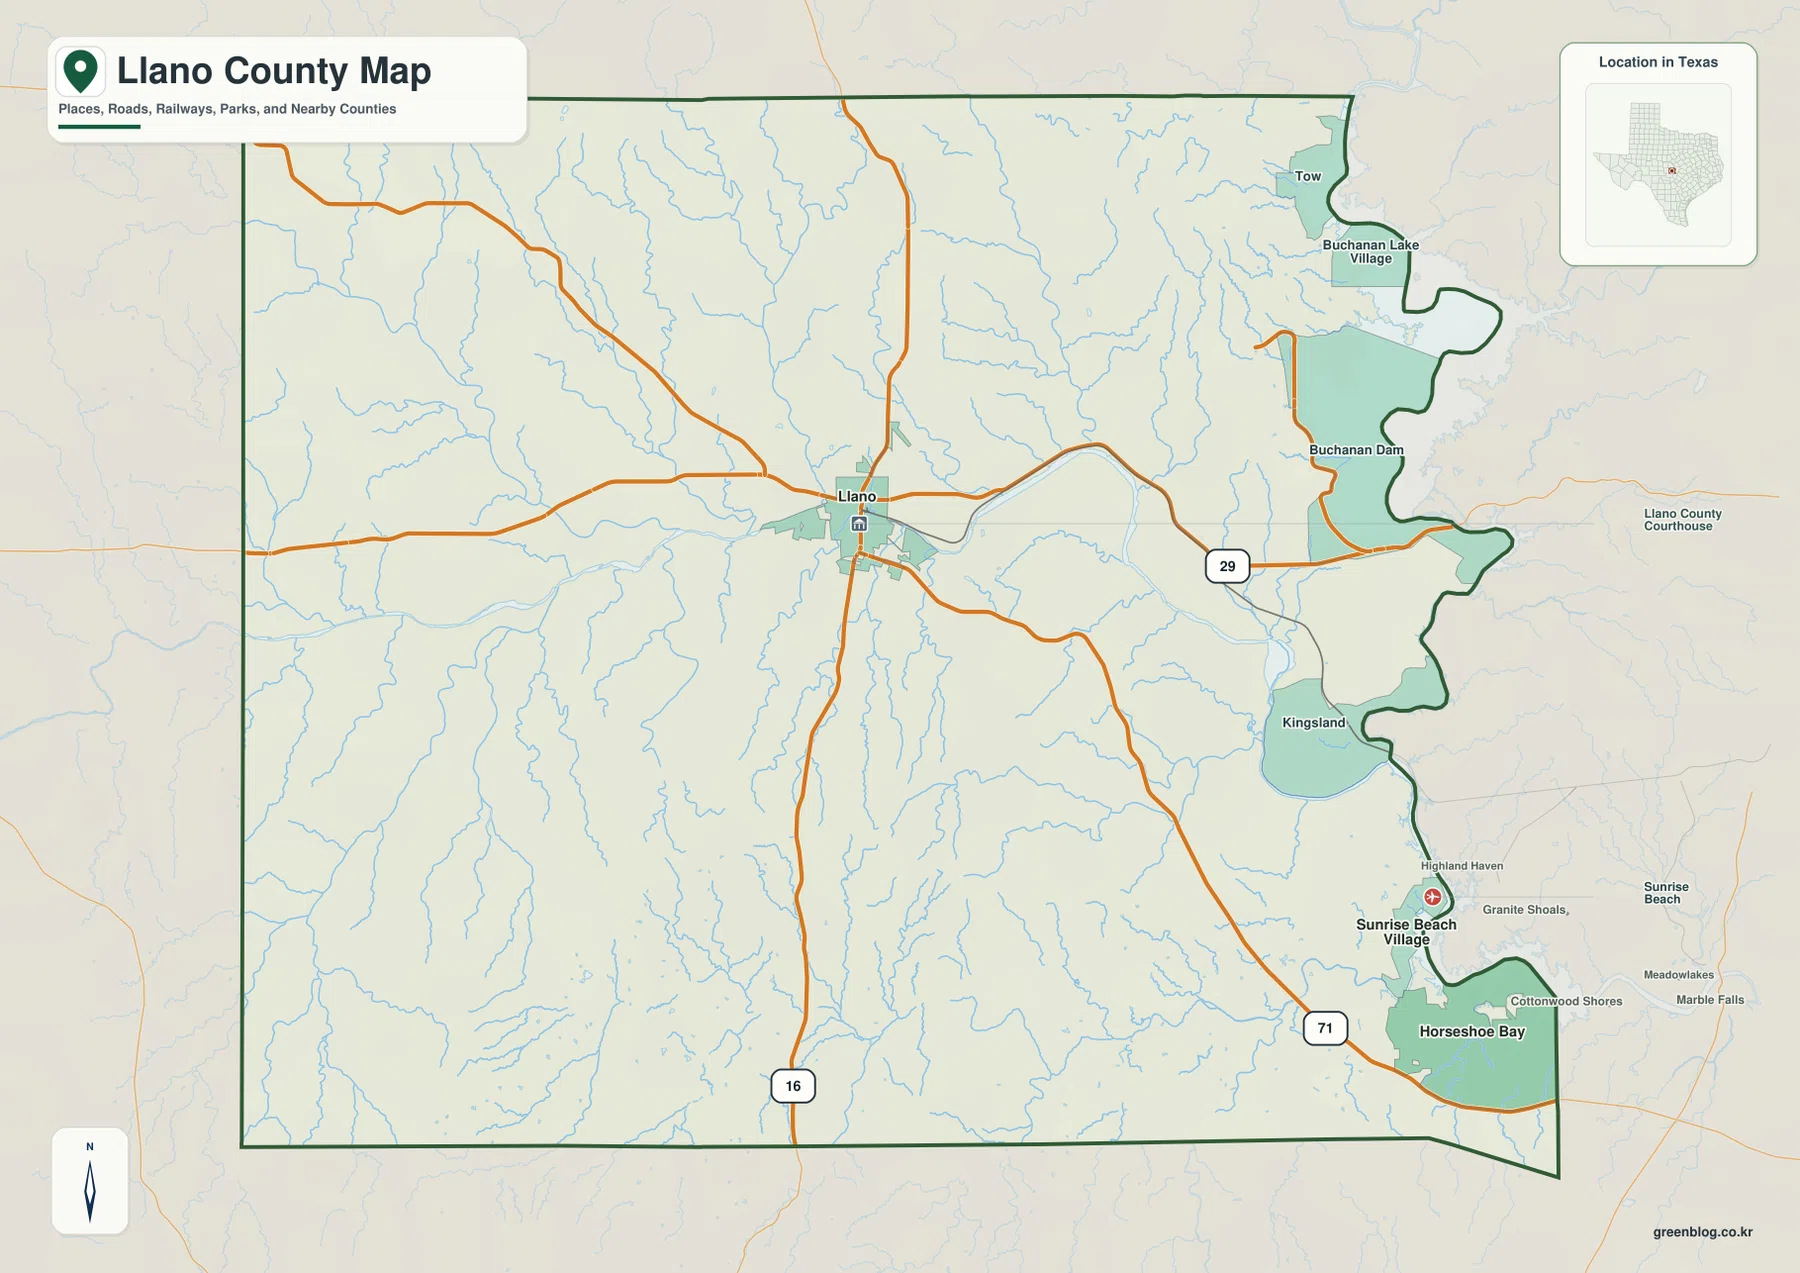
Llano is the easiest place to use as an anchor because it sits near the center of the county where Route 29 crosses the main north-south road marked 16. East of town, Route 29 continues toward Kingsland and the water-rich eastern side. Farther southeast, Route 71 passes the Horseshoe Bay area. The county therefore changes noticeably from a central road-and-town pattern around Llano to a more lake- and river-oriented settlement pattern near Kingsland, Sunrise Beach Village, and Horseshoe Bay.
Table of Contents
Llano and Route 29 provide the simplest way to orient the county
The general map places Llano near the center, with a courthouse symbol that makes the county-seat area easy to identify. Route 29 passes east-west through town, while Route 16 runs north-south and continues toward the southern boundary. The intersection of these two roads gives readers a reliable reference before they begin tracing smaller roads, streams, or communities.
Following Route 29 east leads toward Kingsland, one of the most prominent settlement areas on the eastern side. Buchanan Dam and Buchanan Lake Village are farther north, close to the large water body at the northeastern edge. That eastern boundary is much more irregular than the western side because it bends around water and river terrain rather than following one long straight line.
South of Kingsland, Sunrise Beach Village and Horseshoe Bay sit close to the eastern and southeastern edge. Cottonwood Shores and Highland Haven are also labeled nearby. Route 71 crosses this part of the map, giving the southeastern lakeside communities a road reference that is separate from Route 29 through central Llano.
Horseshoe Bay is the hub on the city-connections map
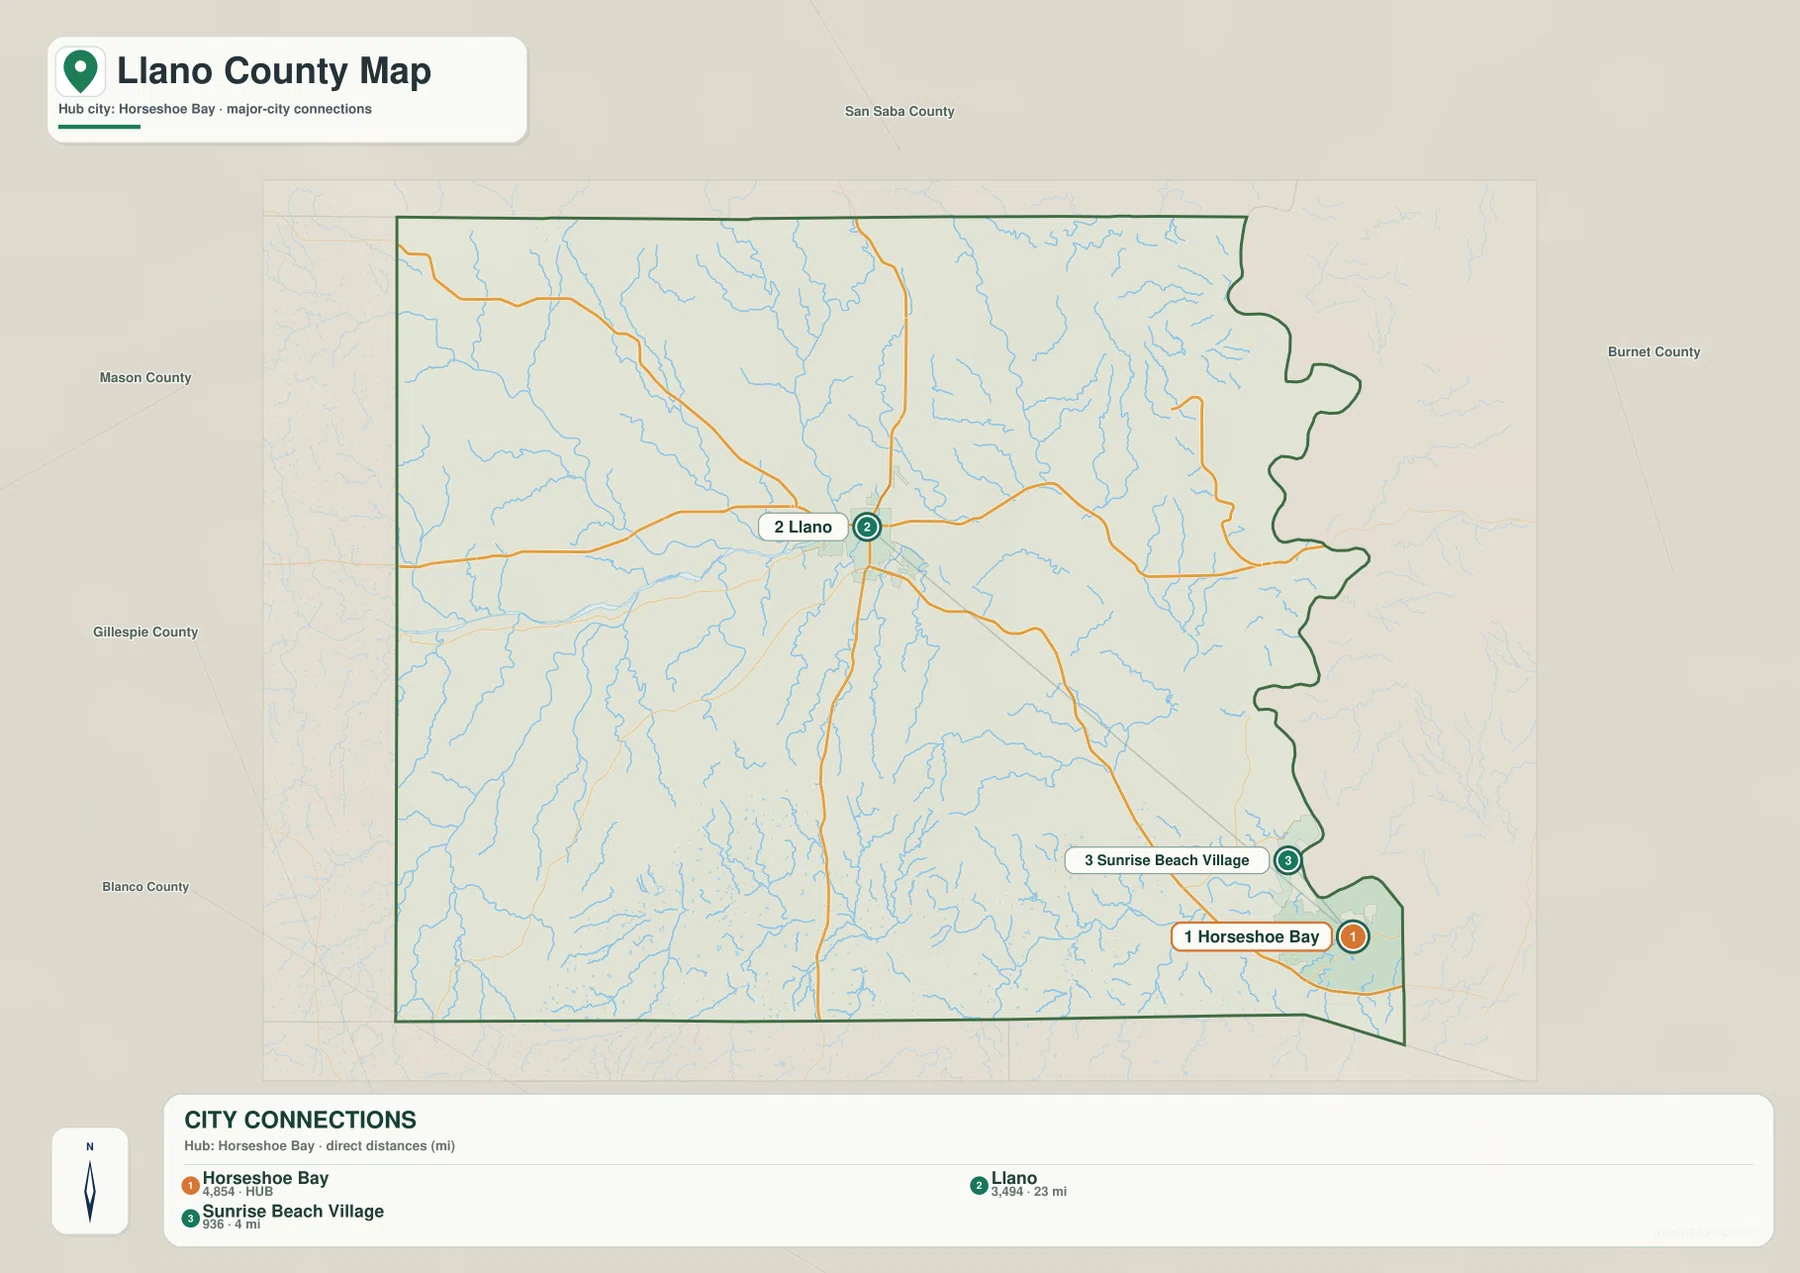
The city-connections map uses Horseshoe Bay as its hub. It shows Llano at about 23 miles in direct distance and Sunrise Beach Village at about 4 miles. These are straight-line distances between the mapped city points rather than driving distances along the road network, so they should not be used as route mileage.
The geometry of the three points is useful even without road detail. Horseshoe Bay and Sunrise Beach Village are very close together in the southeast, while Llano is far to the northwest near the county center. The general map explains why a straight line is not the same as a driving path: Route 71 and Route 29 follow different corridors through hilly and water-cut terrain.
San Saba County appears north of Llano County, Mason and Gillespie counties to the west, Blanco County to the southwest, and Burnet County to the east on the simplified connection view. These labels provide regional orientation, while the main value of the city map is the contrast between the central county seat and the southeastern lakeside communities.
Llano River and Little Llano River organize the water map
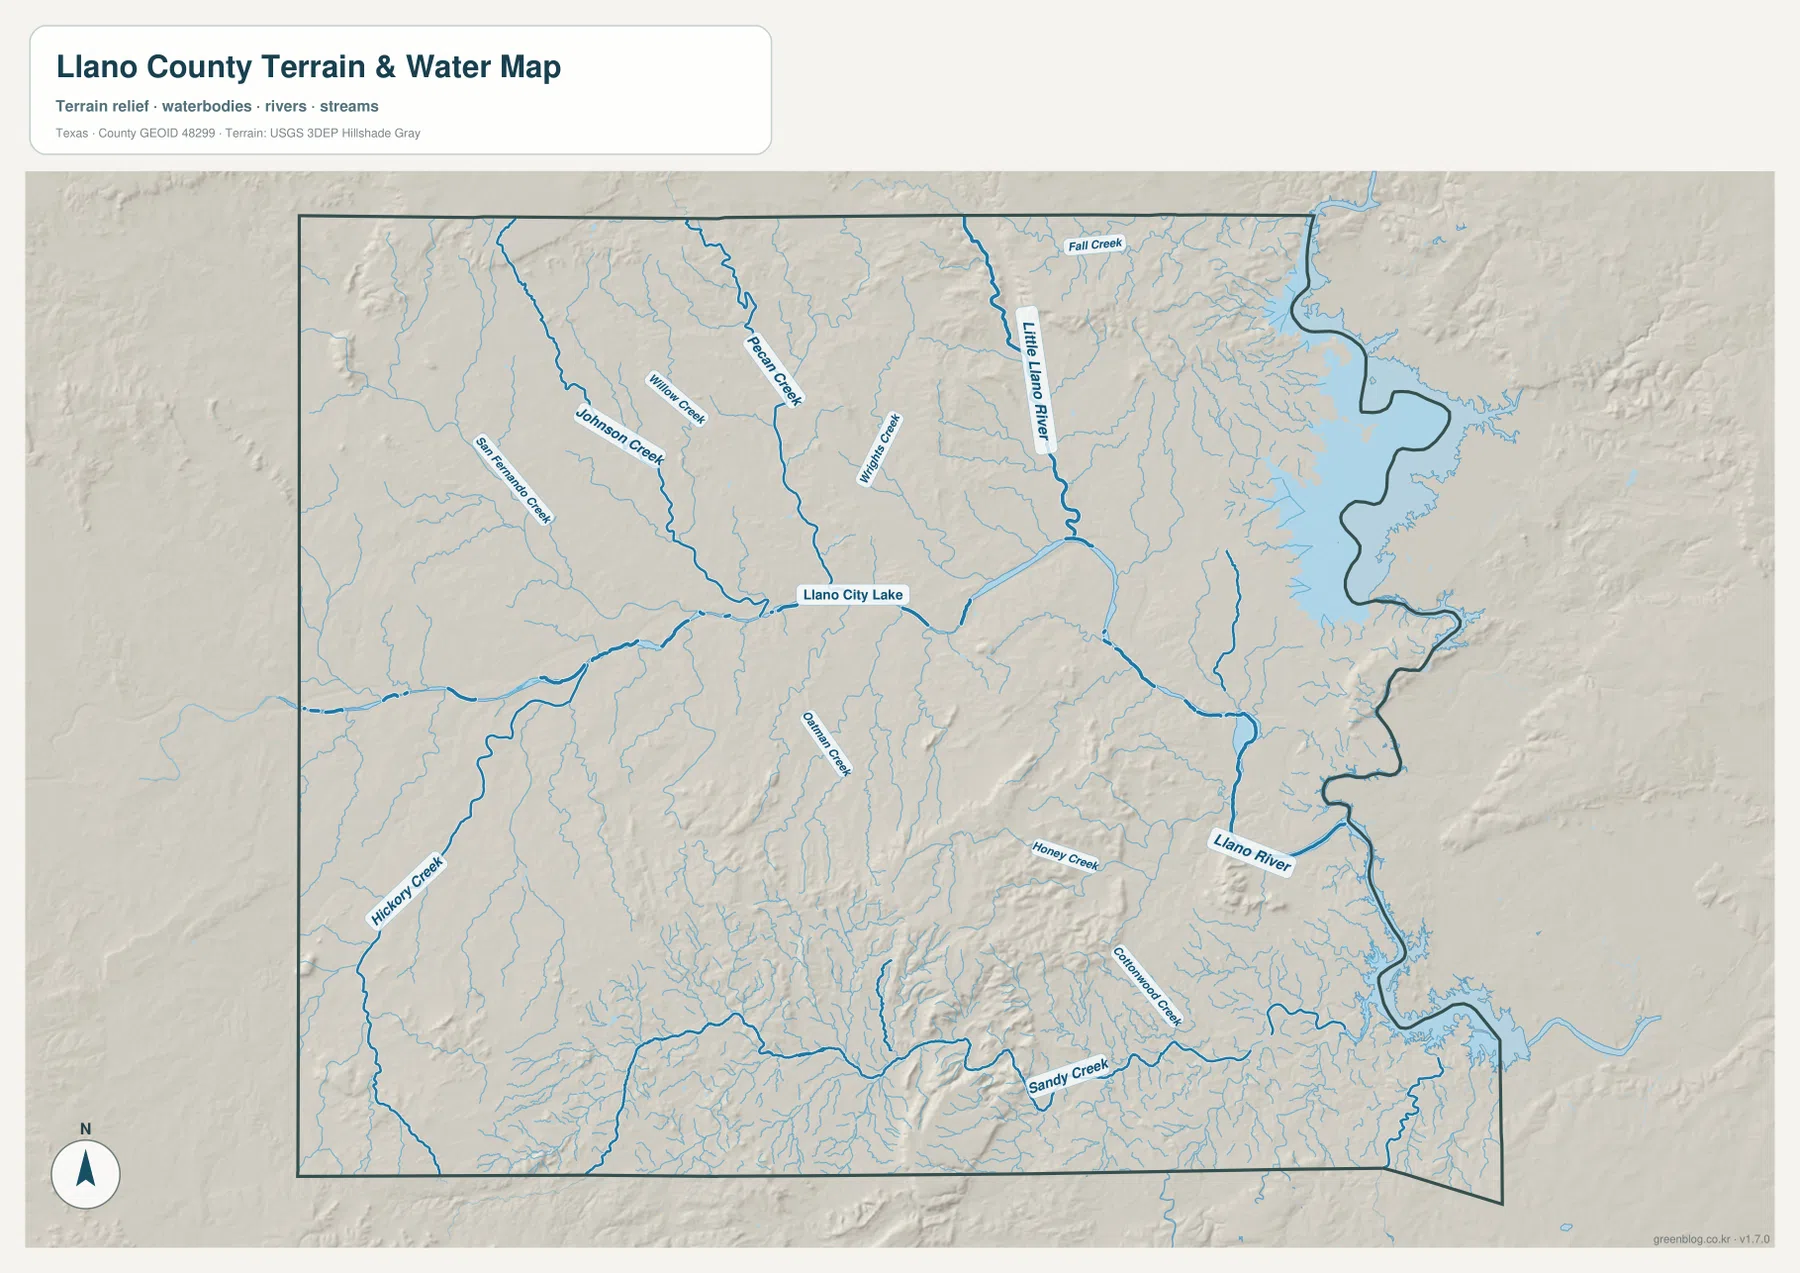
The terrain-and-water map gives the Llano River the strongest visual emphasis. It crosses the central part of the county and bends east and southeast toward the irregular eastern boundary. Llano City Lake is labeled directly along the central river corridor, making it a useful reference for matching the water layer back to the city of Llano on the general map.
Little Llano River descends through the northeastern part of the county and approaches the large reservoir-and-river landscape along the eastern side. In the northwest, Pecan Creek and Johnson Creek are clearly labeled, with Willow Creek between them. Fall Creek appears farther north. These names show that the northern half is divided by several separate drainage valleys rather than one single river channel.
The southern half contains another set of named streams. Oatman Creek runs through the central-southern interior, while Honey Creek and Cottonwood Creek are farther east. Sandy Creek follows a long southern course, and Hickory Creek is prominent in the southwest. The pattern is especially useful when compared with the elevation map because many of these creeks occupy lower corridors between ridges.
The water layer is meant for geographic reference. It is useful for locating rivers, creeks, and lake features shown in the supplied image, but it is not a flood-hazard map, a legal water-boundary map, a parcel map, or a navigation chart. For a town or highway reference, switch back to the general map after identifying the water feature.
High ridges in the northwest and south surround lower river valleys
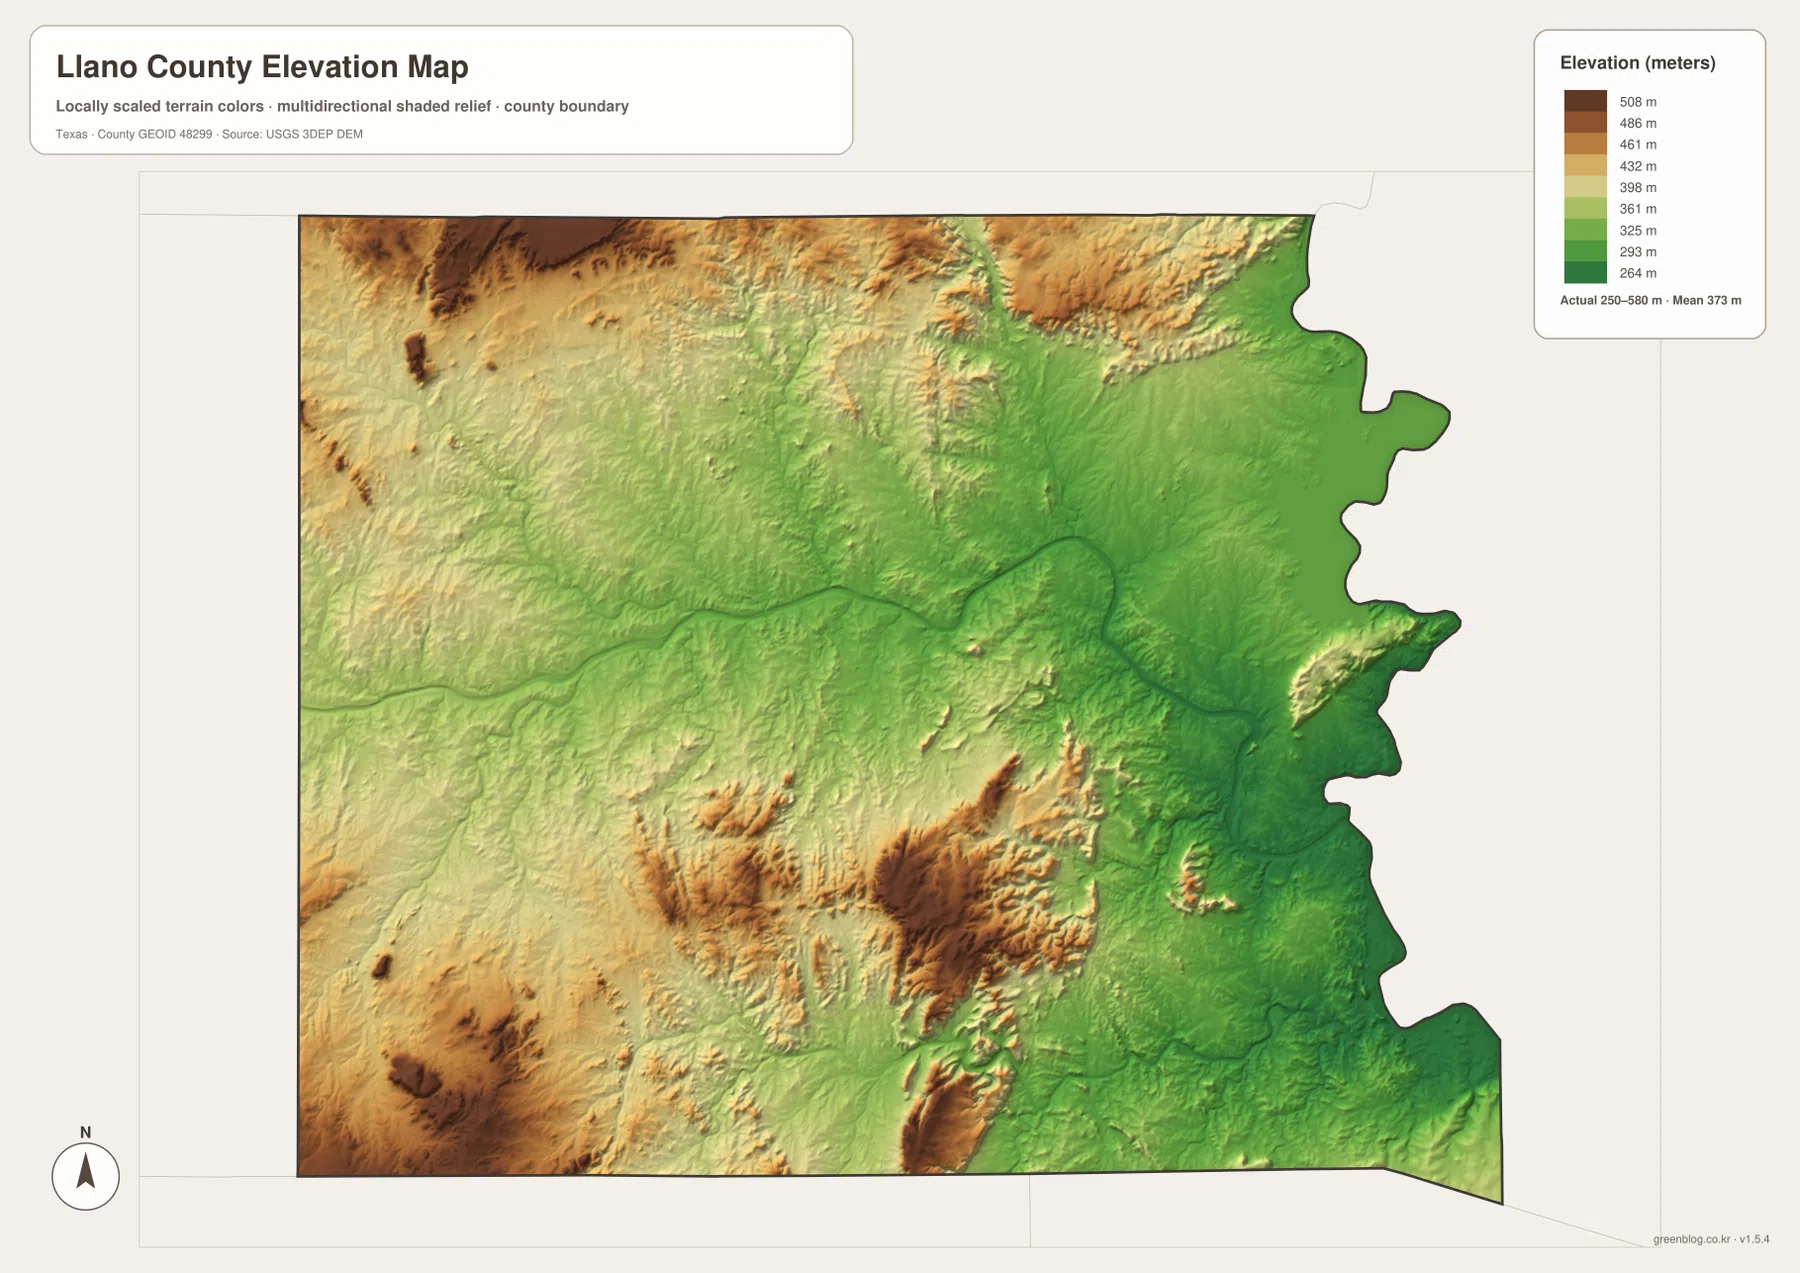
The elevation map reports an actual range of about 250 to 580 meters and a mean elevation of about 373 meters. The highest browns and dark tans are concentrated in the northwest and in several southern hill groups. Greens dominate much of the central and eastern drainage network, where the Llano River and its tributaries occupy lower ground.
The relationship between water and relief is especially clear around the Llano River. A broad lower corridor crosses the county from the west-central area toward the east, while tributary valleys branch away from it. In the northwest, Pecan Creek and Johnson Creek cut through higher terrain. In the south, Sandy Creek and Cottonwood Creek occupy lower routes between prominent ridges and knobs.
The difference between the displayed minimum and maximum elevation is about 330 meters. That amount of relief makes the county much more rugged on the shaded map than the road map alone suggests. The terrain is not a single high plateau or a uniform plain; it is a repeated mix of ridges, isolated high areas, and creek valleys. The elevation layer is best used for relative terrain comparison rather than survey-grade or engineering-grade measurement.
Matching roads with river valleys makes the eastern side easier to understand
Start at Llano on the general map and follow Route 29 east toward Kingsland. The water map shows the Llano River running through the same broad corridor, while the elevation map reveals lower green terrain around the river between higher ridges. The three views explain why the county’s central east-west connection follows a landscape shaped strongly by drainage and relief.
The southeastern communities provide a second comparison. Horseshoe Bay and Sunrise Beach Village sit close together near Route 71 on the road map. The water map shows the large eastern water body and the lower Llano River system nearby, while the elevation layer remains generally lower than many of the western and southern uplands. This makes the lakeside setting of the southeastern settlement cluster easy to understand without adding information that is not visible on the supplied maps.
Use the city-connections map when direct distance and relative direction are the main questions, the general map when roads and place names matter, the terrain-and-water map for rivers and creeks, and the elevation map for ridge-and-valley relief. Smaller labels are often easier to inspect in the downloadable high-resolution JPG files than in the web previews.
Frequently Asked Questions
What distances are shown from Horseshoe Bay to Llano and Sunrise Beach Village?
The city-connections map shows about 23 miles from Horseshoe Bay to Llano and about 4 miles from Horseshoe Bay to Sunrise Beach Village. Those values are straight-line distances between the mapped points, not road-driving distances.
Which water features are easiest to identify?
Llano River is the main central reference, with Llano City Lake nearby. Little Llano River is prominent in the northeast, while Pecan Creek, Johnson Creek, Honey Creek, Sandy Creek, and other named tributaries are also visible on the supplied water map.
What elevation range is shown for Llano County?
The supplied elevation map reports an actual range of about 250 to 580 meters and a mean of about 373 meters. Higher terrain is concentrated in the northwest and parts of the south, while the Llano River and eastern drainage corridors are lower.
Sources and Reference Data
- U.S. Census Bureau TIGER/Line Shapefiles — official county-boundary and road geometry for geographic reference.
- USGS National Hydrography — official resources for rivers, creeks, lakes, and other water features.
- USGS 3D Elevation Program — official elevation resources used for terrain information.
- USGS The National Map Viewer — an official viewer for comparing multiple geographic layers.
Map File Information
Download four high-resolution A3 JPG maps of Llano County, Texas, in one ZIP file.
- Included Files: county map, city-connections map, terrain and water map, elevation map
- File Type: JPG
Related Maps
- San Saba County Texas map
- Travis County Texas map
- Williamson County Texas map
- Bandera County Texas map
- Real County Texas map
Green Map creates custom-edited map images using open geographic data sources such as geoBoundaries, Natural Earth, OpenStreetMap, and government open data.
These maps are edited visual materials, not raw data files, and are provided for education, documents, presentations, and graphic reference.