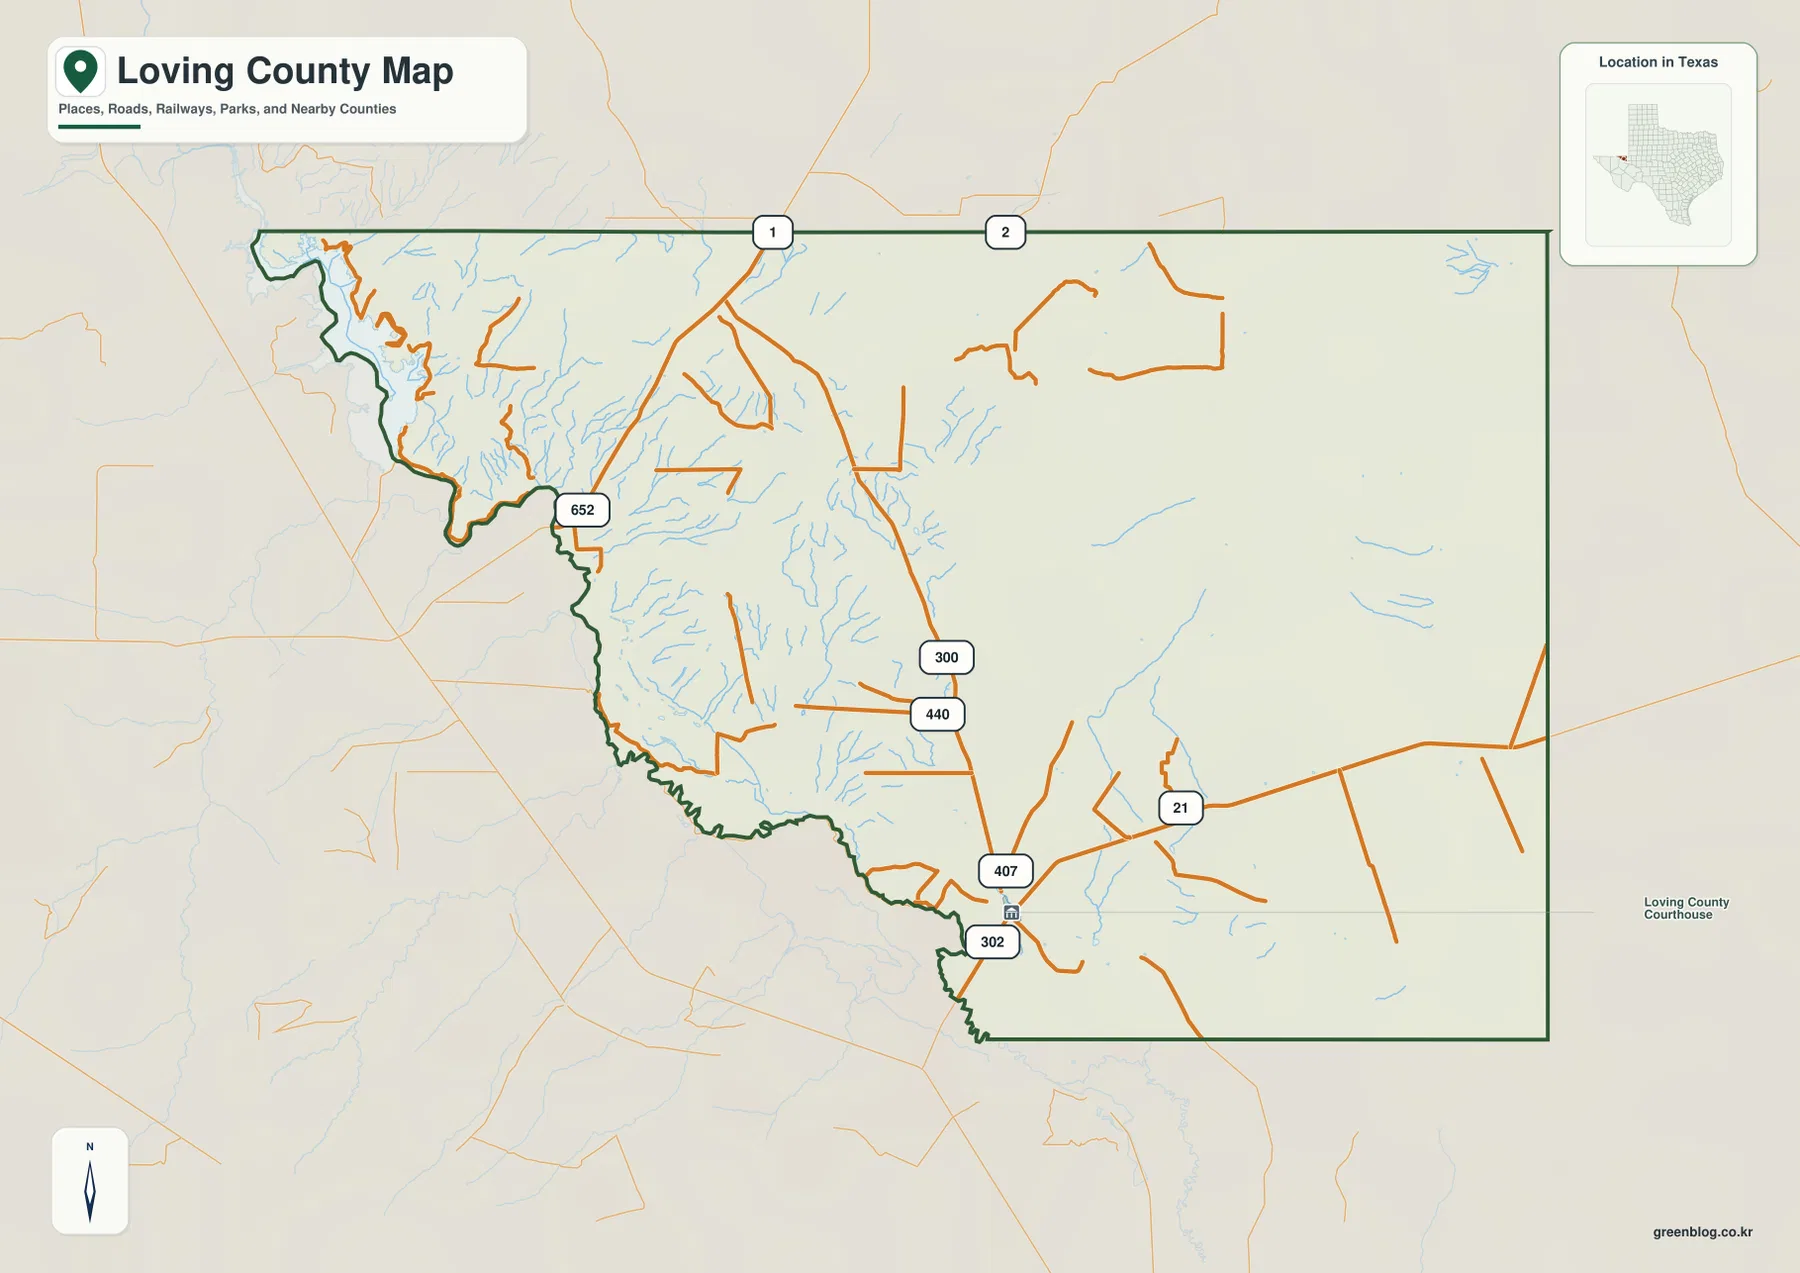
You can download three high-resolution A3 JPG maps of Loving County, Texas, in one ZIP directly from this page. The package contains a general county map, a terrain-and-water map, and an elevation map; there is no city map in this set. The mapped material shows the Pecos River along the irregular western and southwestern boundary, roads numbered 1, 2, 652, 300, 440, 21, 407, and 302, and terrain ranging from about 805 to 1,029 meters. Mentone is identified by the package information as the county-seat reference for the article.
The easiest way to orient Loving County is to begin with the Pecos River rather than a dense group of towns. The river bends deeply into the northwestern side and then follows much of the western and southwestern boundary. In contrast, the northern and eastern county lines are much straighter. Roads spread across the interior at wide intervals, with a more noticeable concentration in the south-central area around the Mentone reference. Once the river bend and those roads are familiar, the water and elevation views line up much more easily.
Table of Contents
The Pecos River explains the unusual western county boundary
The most distinctive shape on the general map is the western edge. Instead of following one straight administrative line, the boundary bends repeatedly with the Pecos River. The northwestern corner contains a deep indentation where the river turns, and the irregular line continues southward along the western side before reaching the lower county boundary. This is the easiest feature to remember when switching among the three maps.
Roads 1 and 2 are labeled along the northern boundary, while 652 appears farther west in the interior. Route 300 runs through the central part of the county, with 440 nearby. Farther south, roads 407 and 302 form part of the south-central network, and 21 extends east from that area. Because the map contains few large settlement labels, these road numbers and the Pecos River provide more useful reference points than a conventional town-to-town route description.
The package material identifies Mentone as the county seat. On the supplied general map, the south-central road concentration and courthouse-related label provide the best visual reference for that area. From there, Route 300 extends northward through the interior, while the Pecos River lies to the west. Reading Mentone as part of this road-and-river setting is more useful than treating it as an isolated point.
Wide road spacing makes the south-central network especially useful for orientation
The road pattern is sparse compared with maps of more densely settled counties. Roads 1 and 2 provide a simple east-west reference at the top, while Route 300 gives the center a strong north-south line. The nearby Route 440 and the southern 407 and 302 labels create a more complicated network in the lower middle of the county. This is the part of the map where several routes are easiest to compare at once.
Route 652 is useful for identifying the western side because it lies closer to the Pecos River than most of the eastern roads. Route 21, by contrast, runs east from the south-central network and helps establish the direction away from the river. Instead of memorizing every number as a separate fact, it is easier to group the roads by their position relative to the river, the northern boundary, and the Mentone area.
The general map does not attempt to make every small drainage line prominent. Many blue channels are visible, especially in the west, but the road network remains the main visual layer. The terrain-and-water map reverses that emphasis, and the elevation map adds a third view by showing which of those river and creek corridors occupy lower ground. Comparing the same location across the three images gives more information than trying to force all details into one map.
The water map is dominated by the Pecos River and western tributaries
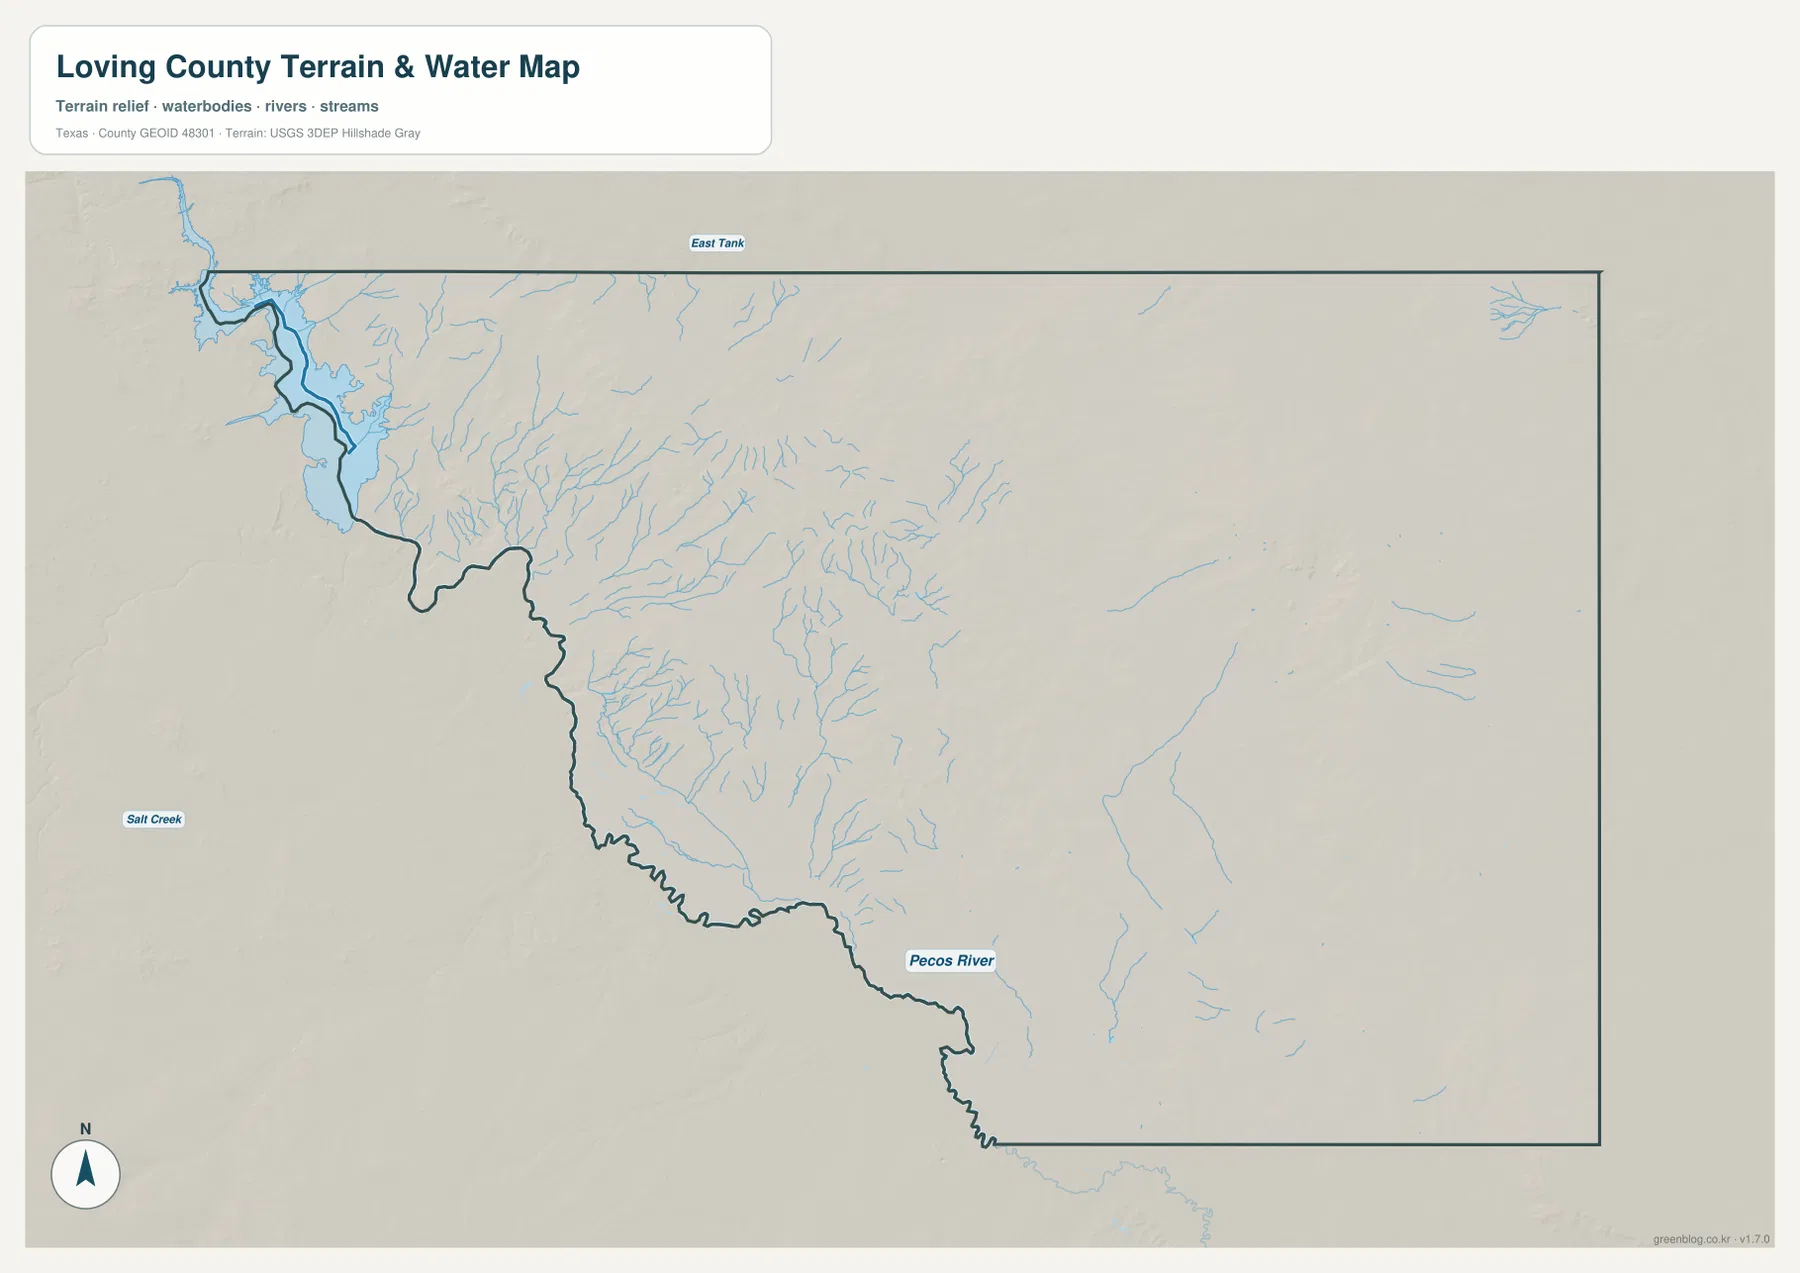
The Pecos River is the strongest labeled feature on the terrain-and-water map. It enters the northwestern side and follows the irregular western boundary toward the southwest. A dense collection of short tributaries descends toward the river from the county interior. The western half therefore contains many more visible drainage lines than much of the eastern half.
Salt Creek is labeled to the west of the county, and East Tank appears near the northern portion of the map. These are much smaller references than the Pecos River, but they are among the names that can be read directly from the supplied water image. Farther east, several isolated drainage lines are visible, yet they are less dense than the branching network close to the river.
The water pattern helps explain why the western county boundary looks so different from the straight northern and eastern sides. The river is not simply a blue line placed inside the county; it is closely tied to the boundary itself. Small channels also show that the land west of the main road corridors is divided by numerous shallow valleys rather than being an empty, featureless surface.
This map is intended for geographic reference. It can be used to locate the Pecos River, Salt Creek, East Tank, and visible tributaries relative to the county boundary, but it is not a flood-hazard map, a legal water-boundary product, a parcel map, or a navigation chart. When a road number is needed, the general map provides the better companion view.
The northeast rises well above the Pecos River side
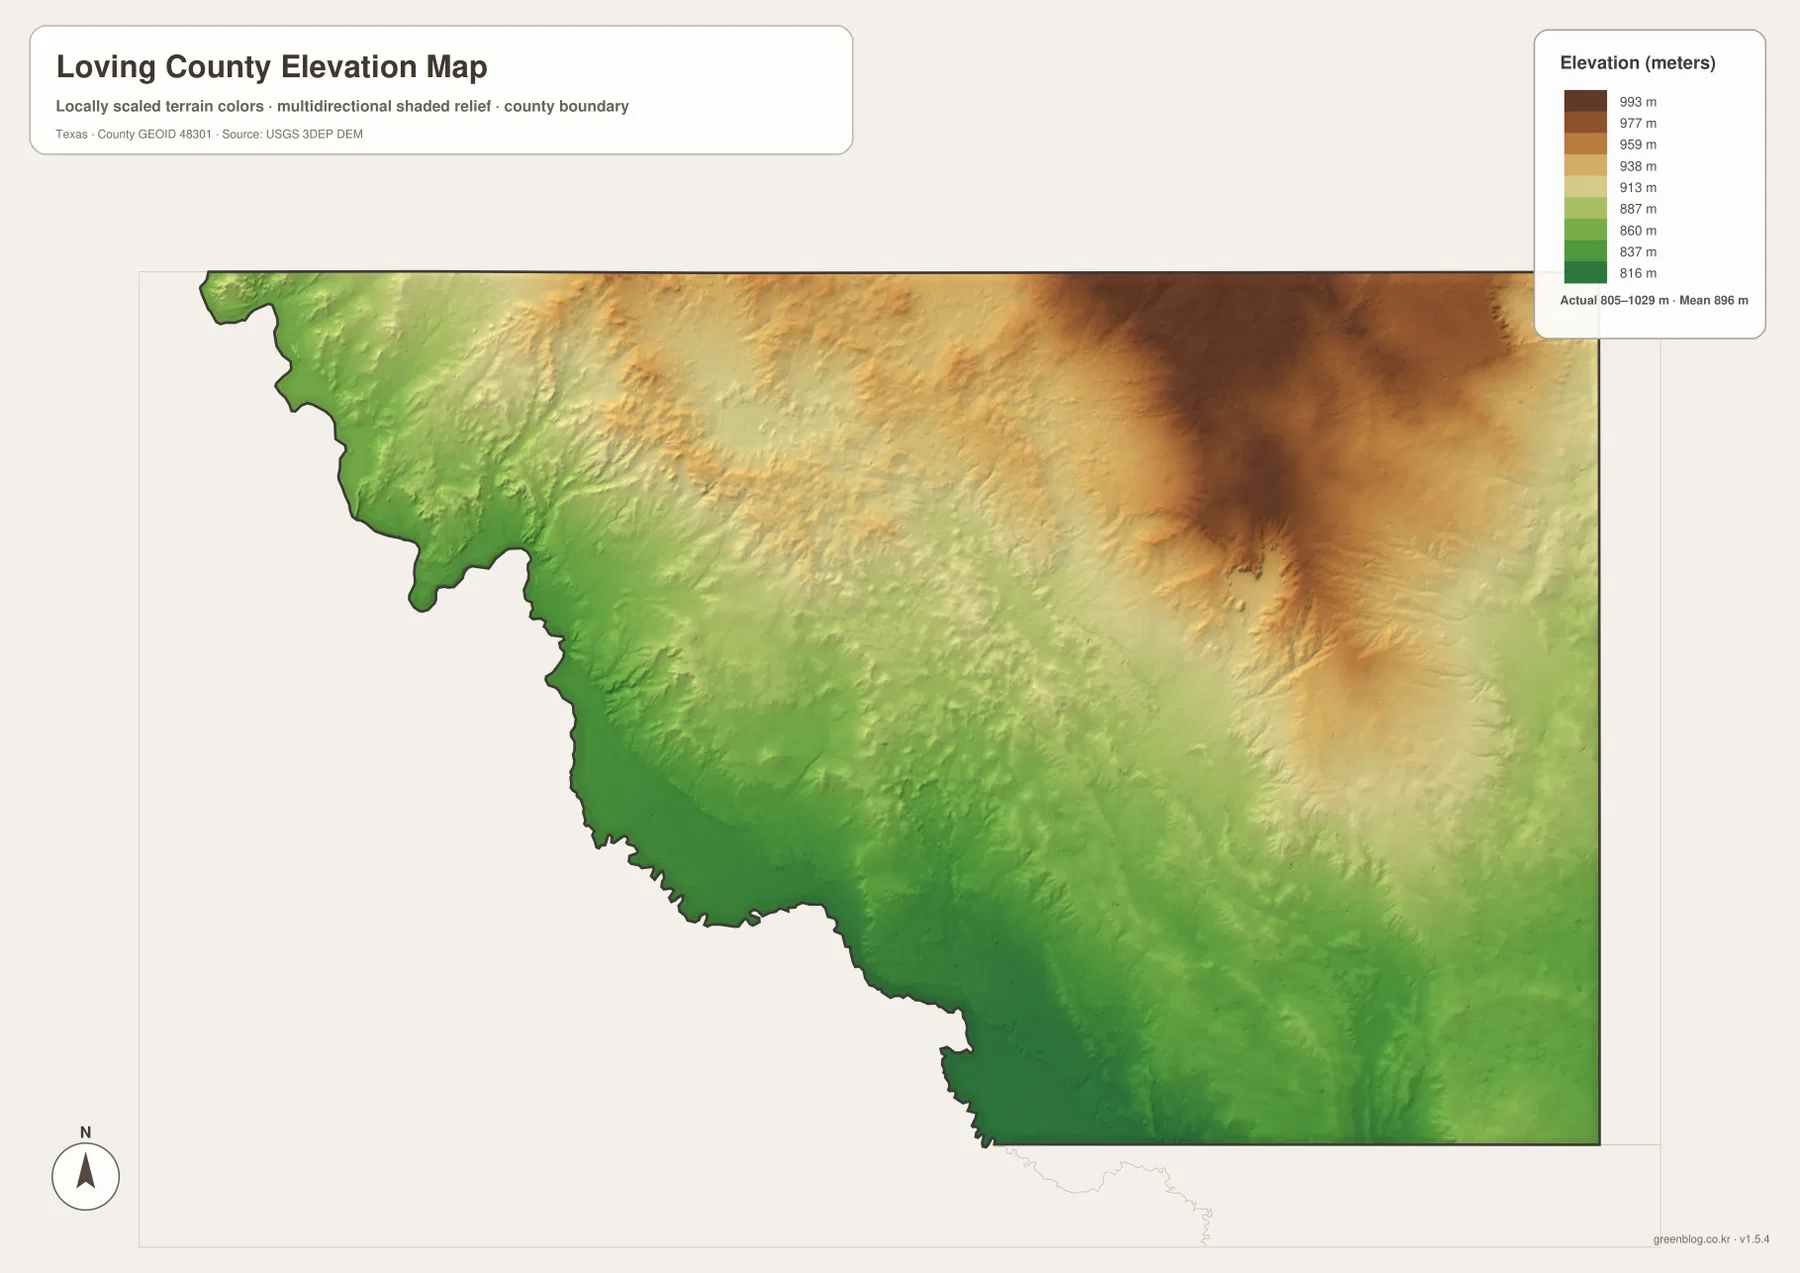
The elevation map reports an actual range of about 805 to 1,029 meters and a mean elevation of about 896 meters. The highest brown terrain is concentrated in the northeast, with additional high ground across the north-central portion. Colors become progressively greener toward the west and southwest, and the lowest terrain follows the Pecos River side.
The northeast is not a smooth, flat block of high land. Shaded relief shows small ridges and valleys cutting through the brown and tan surface. Moving west and south from that area, elongated lower corridors become more common. These shapes correspond well with the drainage pattern on the water map, where tributaries descend toward the Pecos River.
The displayed difference between the minimum and maximum elevation is about 224 meters. That is enough to create a strong contrast between the northeastern high ground and the river valley along the west. The central part of the county lies between those two extremes, so the change is not one simple uniform slope; ridges, shallow valleys, and local high areas interrupt the broader northeast-to-west decrease.
The elevation layer is best used for relative terrain comparison. It helps explain why the Pecos River and tributaries occupy lower corridors and why the northeast appears more elevated, but it should not be treated as survey-grade or engineering-grade elevation measurement. For location work, match the terrain colors back to the road and river references on the other two maps.
Comparing west and northeast across all three maps reveals the county’s strongest contrast
Start with the western side on the general map and locate Route 652 near the irregular Pecos River boundary. On the water map, the same area contains the main river and a dense collection of tributaries. On the elevation map, it becomes green lower terrain. The three views reinforce one another: the boundary bends with the river, drainage converges toward it, and elevation falls into the same corridor.
The northeast tells the opposite story. The general map has long road segments and few large place labels, while the water map shows fewer major channels than the western side. The elevation layer marks the area with the darkest brown colors in the county. That west-versus-northeast contrast is more distinctive than a simple list of road names and provides a useful way to remember Loving County’s physical layout.
The general map is the quickest choice for the county outline and numbered roads. The water map is better for the Pecos River and tributaries, and the elevation map makes the high northeast and low river corridor immediately visible. Small road labels and drainage lines may be difficult to read in a browser preview, so the high-resolution A3 JPG files in the ZIP are useful for enlargement or printing.
Frequently Asked Questions
How can I orient the Mentone area on the map?
The package identifies Mentone as the county-seat reference. On the general map, use the south-central road concentration around routes 300, 440, 407, and 302 together with the courthouse-related label. Roads 1 and 2 provide a northern reference, while the Pecos River defines the western side.
Why is the Pecos River so important on a Loving County map?
The river follows much of the western and southwestern boundary, creating the county’s most irregular edge. Tributaries converge toward it on the water map, and the elevation map shows lower terrain along the same corridor, so it links the boundary shape, drainage, and relief.
What elevation range is shown for Loving County?
The supplied elevation map reports an actual range of about 805 to 1,029 meters and a mean of about 896 meters. The northeast is the highest broad area, while the Pecos River side in the west and southwest is lower.
Sources and Reference Data
- U.S. Census Bureau TIGER/Line Shapefiles — official county-boundary and road geometry for geographic reference.
- USGS National Hydrography — official resources for the Pecos River and related water features.
- USGS 3D Elevation Program — official elevation resources used for terrain information.
- USGS The National Map Viewer — an official viewer for comparing multiple geographic layers.
Map File Information
Download three high-resolution A3 JPG maps of Loving County in one ZIP file.
- Included Files: county map, terrain and water map, elevation map
- File Type: JPG
Related Maps
- Reeves County Texas map
- Ward County Texas map
- Winkler County Texas map
- Pecos County Texas map
- Presidio County Texas map
Green Map creates custom-edited map images using open geographic data sources such as geoBoundaries, Natural Earth, OpenStreetMap, and government open data.
These maps are edited visual materials, not raw data files, and are provided for education, documents, presentations, and graphic reference.