Download four 2572×3638px high-resolution JPG maps of Bexar County in one ZIP while using this page to compare the county boundary, major-city distribution, waterways, and elevation. San Antonio dominates the center of the county, but the maps also show a tight northeastern group of Converse, Universal City, Live Oak, and Selma, a western reference at Leon Valley, and a broad shift from higher ground in the northwest to lower terrain toward the southeast.
The four maps are designed for different questions rather than as repeated versions of the same image. The county map is the best starting point for roads, boundaries, and named communities. The ranked city map reduces the view to six major cities, making the northeastern cluster easy to compare with San Antonio and Leon Valley. The terrain-and-water map brings the San Antonio and Medina rivers, major creeks, and lakes forward. The elevation map then strips away most urban detail so the county’s large northwest-to-southeast height contrast becomes unmistakable.
Table of Contents
San Antonio’s large footprint inside Bexar County
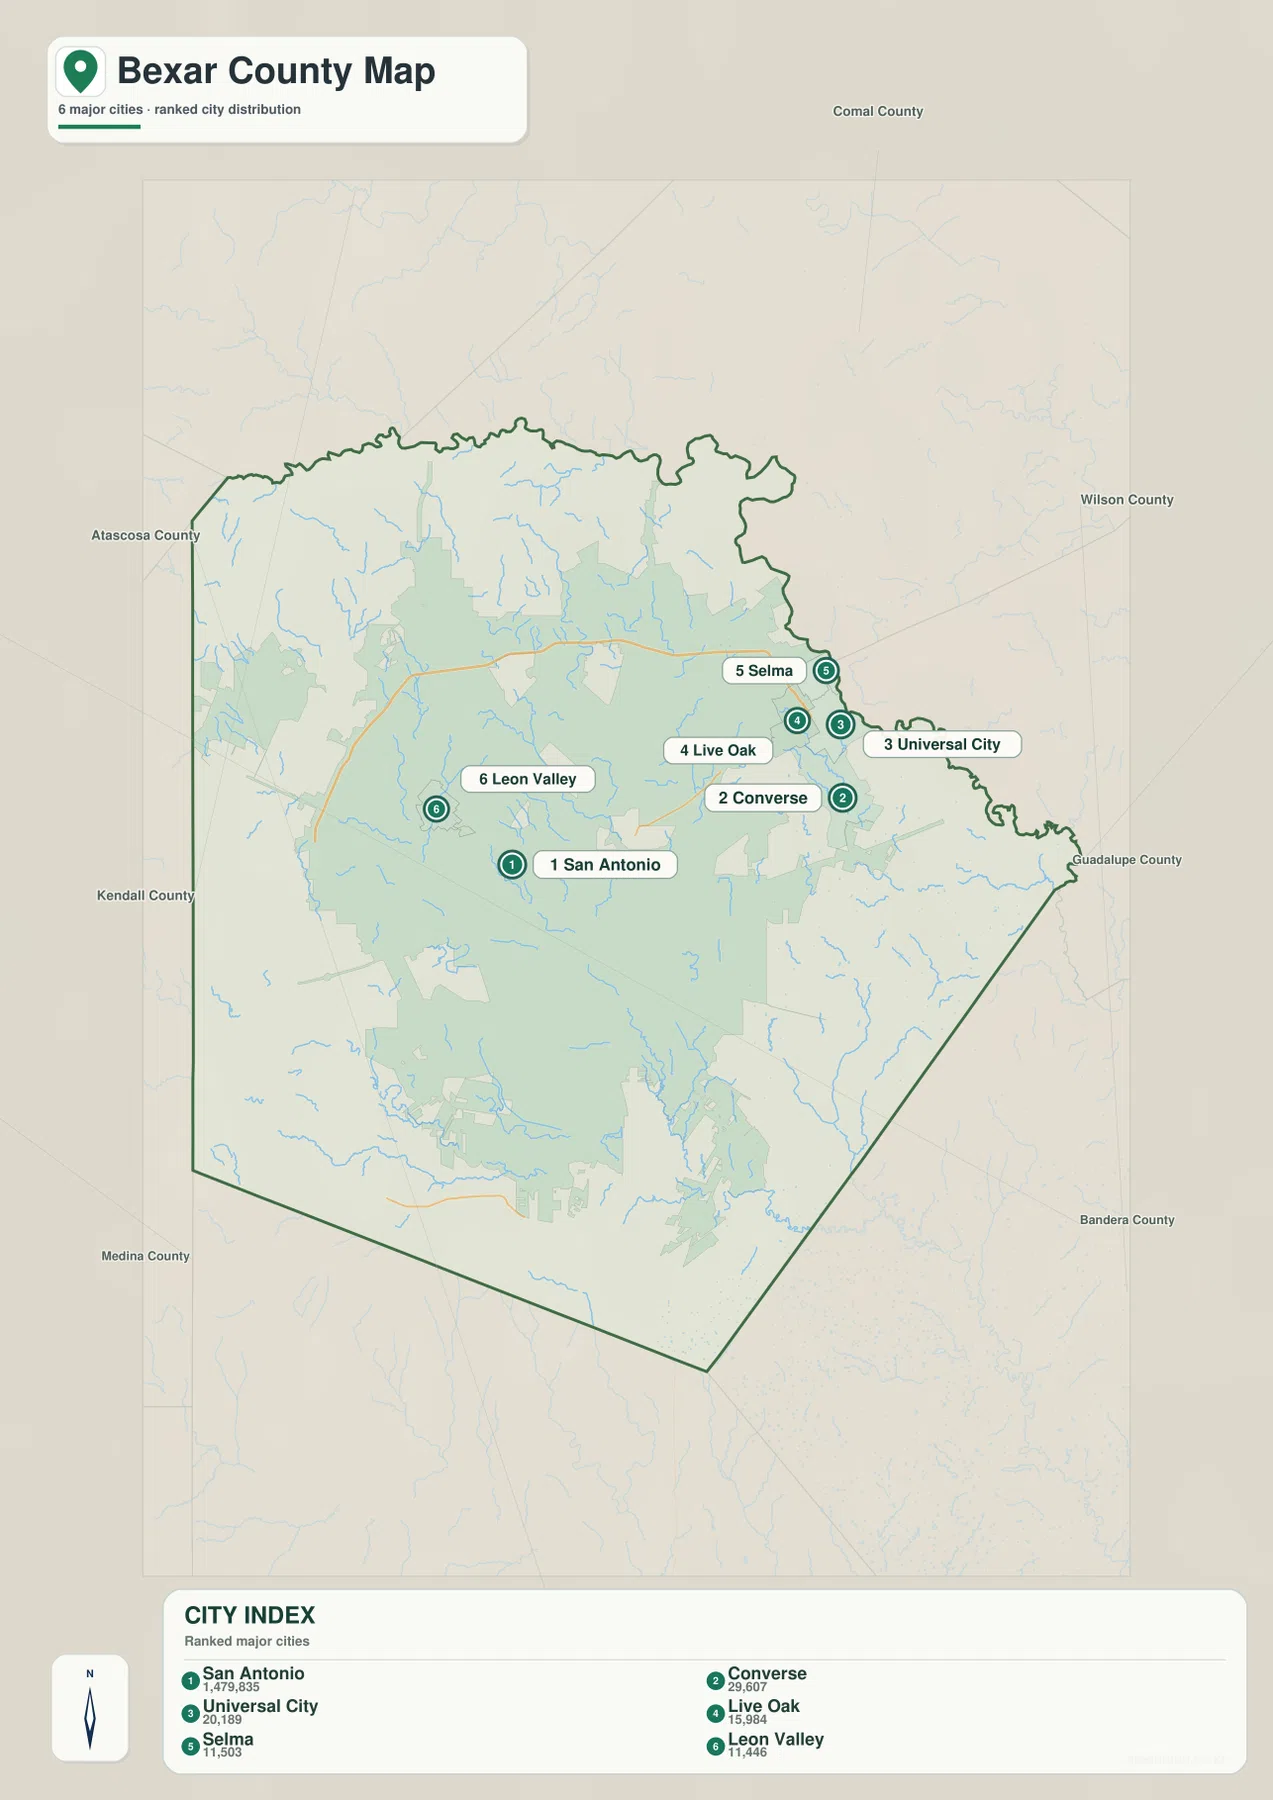
Bexar County does not have the settlement pattern of a lightly populated rural county with one small seat and a few distant towns. San Antonio occupies a large central area, and major roads radiate through and around it. The Bexar County Courthouse is marked near the urban core, providing an immediate administrative reference. West of the center, Leon Valley and Helotes are easy to locate; to the north, Shavano Park and Castle Hills sit close to San Antonio; farther northeast, Selma, Universal City, and Converse form part of a much tighter chain of named communities.
The county map also shows how quickly the urban pattern changes toward the edges. Fair Oaks Ranch appears near the northwestern boundary, while Schertz touches the eastern side. St. Hedwig, China Grove, and Elmendorf are spaced more widely across the southeastern and southern portions of the county. Those differences matter because they prevent the entire county from looking like one uniformly dense city. The central and northeastern areas carry a heavier concentration of roads and place names, while the southern and southwestern areas have larger gaps between labeled communities.
A compact northeastern city group and a separate western reference
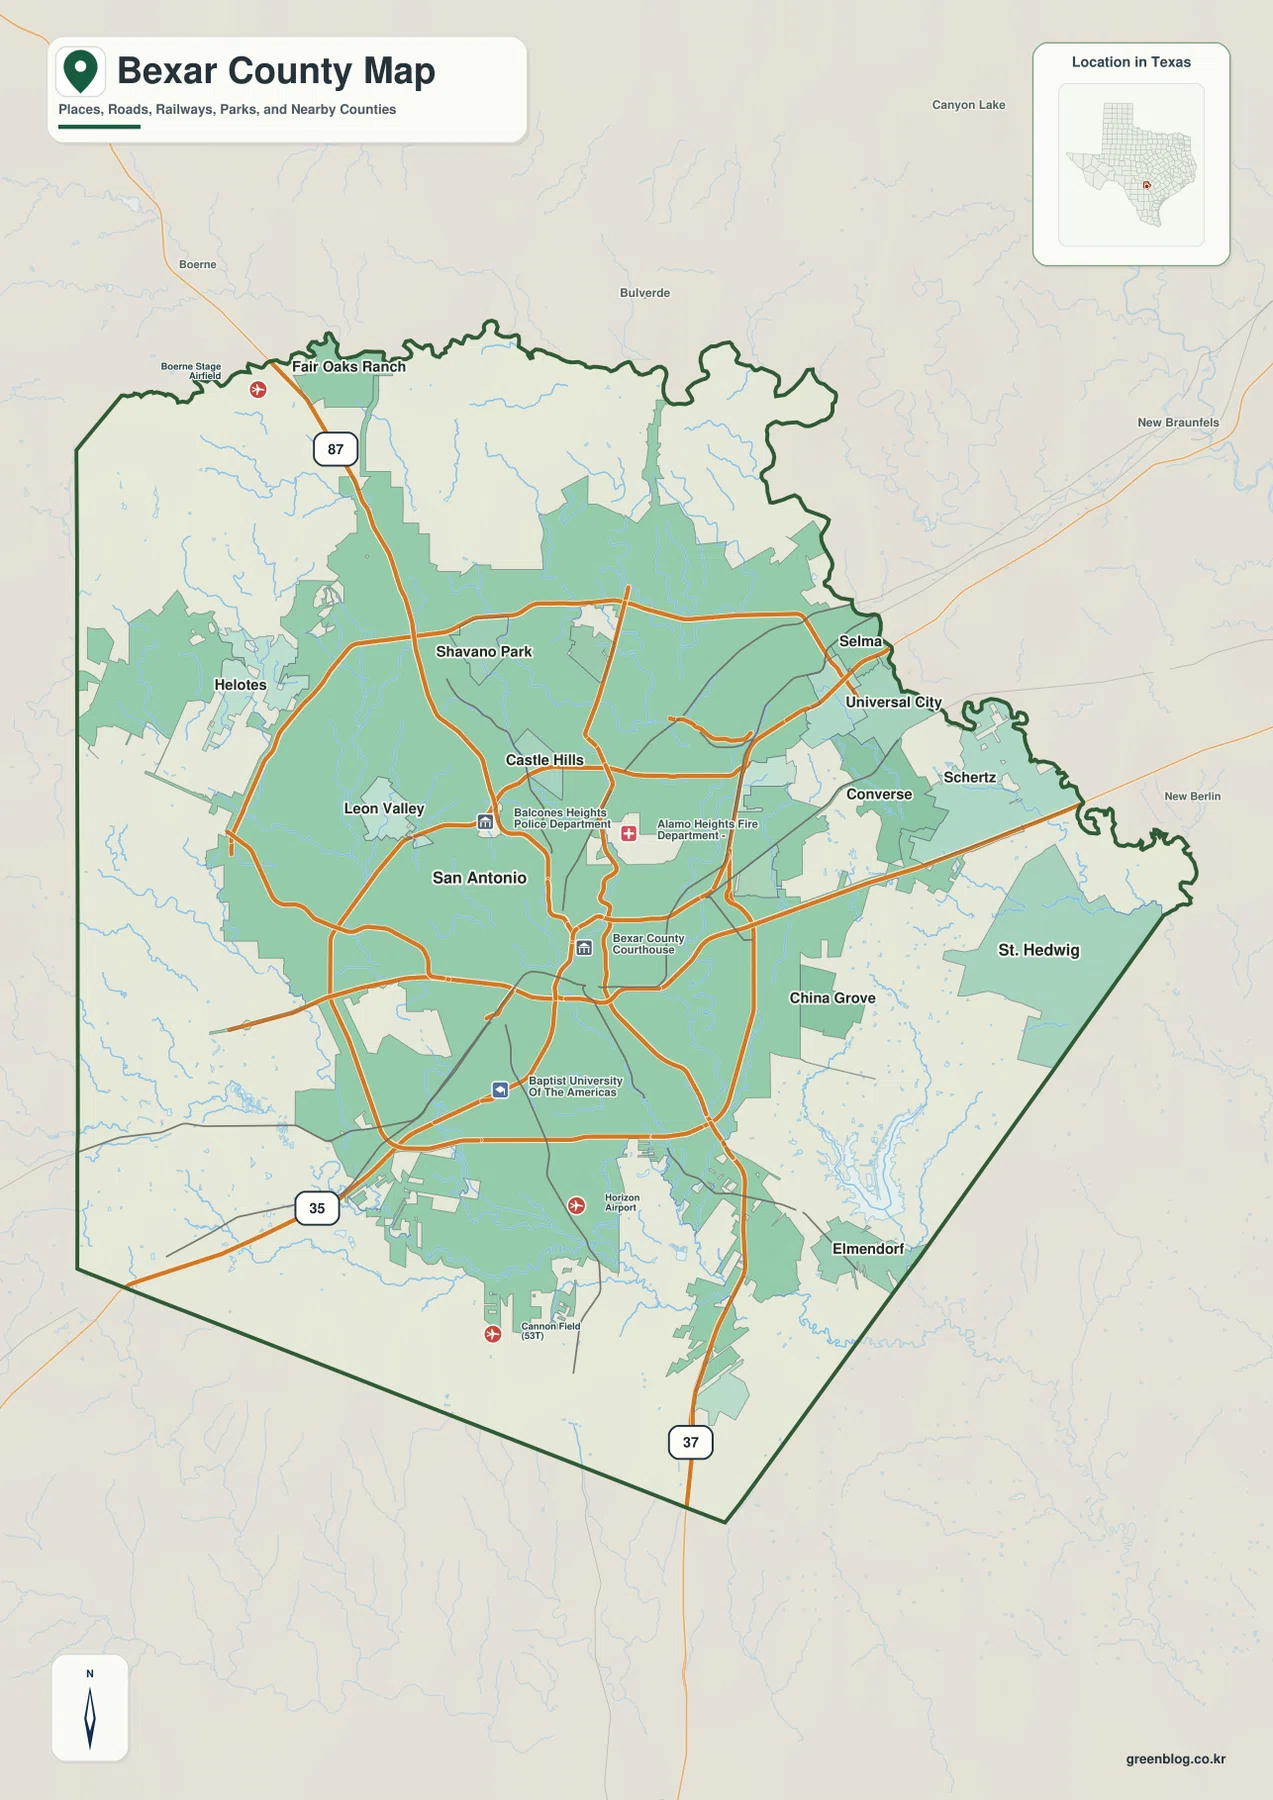
The city-distribution map deliberately simplifies the county to six ranked major cities. San Antonio is the central reference. Converse, Universal City, Live Oak, and Selma are packed into the northeastern side of the county, while Leon Valley sits apart on the west side of San Antonio. That arrangement is more informative than a simple city list because it shows where the selected major places are close together and where the map has large areas without a ranked-city marker.
The southern half of the map contains no comparable cluster of ranked major cities. This does not mean that no communities exist there; it means the city map is a selected major-city index rather than a complete municipal inventory. For detailed labels such as Helotes, Castle Hills, St. Hedwig, China Grove, or Elmendorf, the county map is the better reference. Used together, the two maps separate a broad question—where the main population centers are—from a detailed one—what smaller named places surround them.
Road corridors converge on the San Antonio core
The road pattern reinforces San Antonio’s central role. The supplied article data identifies Interstates 10, 35, and 37 together with Loops 410 and 1604 as major corridors, and the county map clearly shows large routes converging on and crossing the urban area. I-35, I-37, and US 87 are especially easy visual anchors on the map. Once those major lines are located, smaller communities become easier to place in relation to downtown San Antonio and the county boundary.
Outside the boundary, Boerne and Bulverde help orient the north and northwest, while New Braunfels and New Berlin provide eastern references. Bexar County borders Kendall, Comal, Guadalupe, Wilson, Atascosa, Medina, and Bandera counties, so the road network naturally continues beyond the dark county outline. The boundary map should therefore be used to understand county extent and relative location, not as a parcel, survey, or legal property-boundary document.
Rivers and creeks become the main structure south of the city
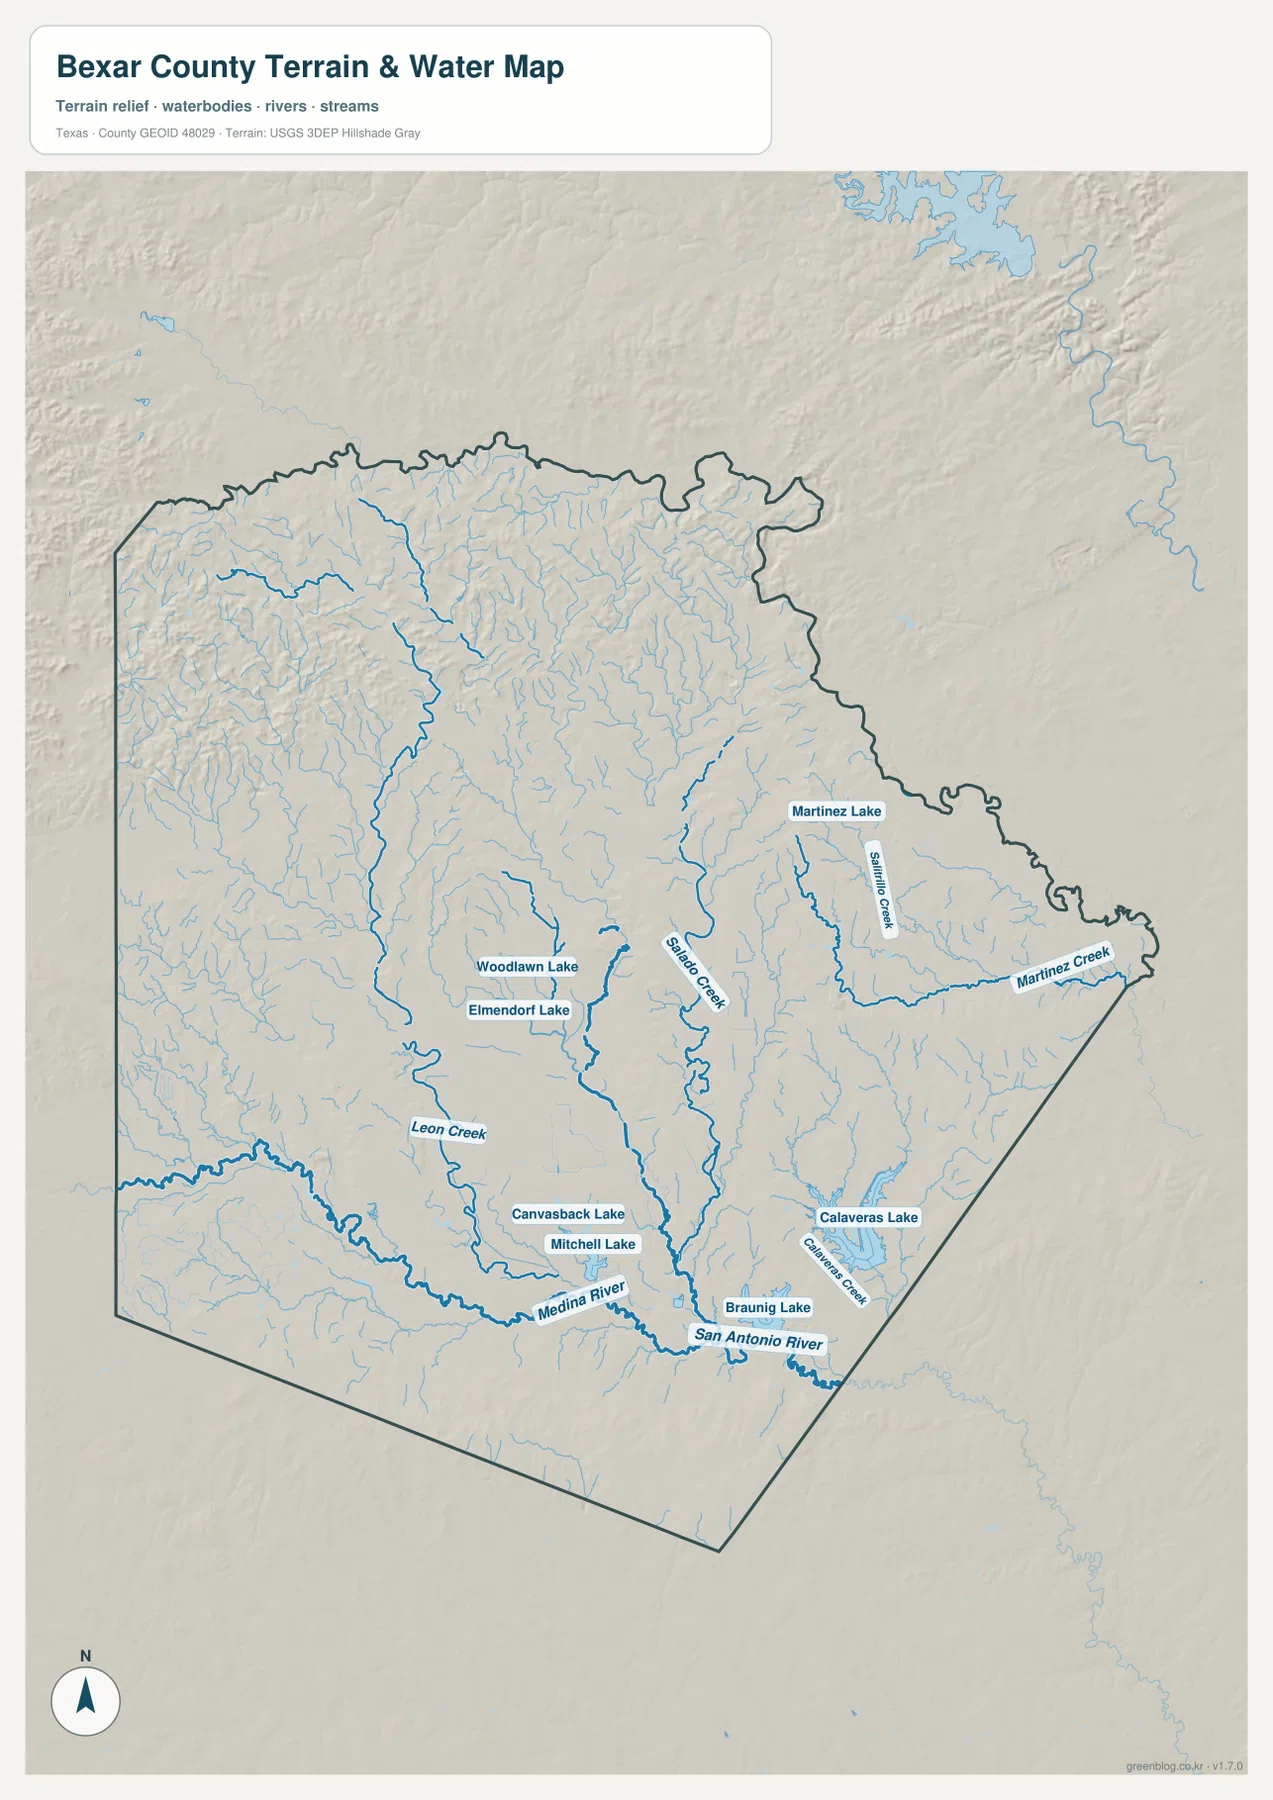
When the road layer is replaced by the terrain-and-water view, the southern part of Bexar County looks very different. The San Antonio River is labeled across the south-central portion, while the Medina River enters from the southwest and joins the broader southern drainage pattern. Leon Creek descends through the western side. Salado Creek, Calaveras Creek, Martinez Creek, and other tributaries create a dense network through the central and eastern parts of the county.
The labeled lakes are distributed across several parts of the county rather than concentrated in one reservoir district. Woodlawn Lake and Elmendorf Lake are near the urban area. Canvasback Lake and Mitchell Lake sit farther south, while Braunig Lake and Calaveras Lake stand out in the southeast. Martinez Lake appears farther east. Comparing these locations with the city map is useful because the strongest northeastern city cluster and the larger southeastern water bodies occupy different parts of the county.
This map is a geographic reference for waterways and terrain. It does not show flood probability, channel depth, boating conditions, navigable limits, or legal waterfront boundaries. A creek drawn on the map should be read as a mapped hydrographic feature, not as evidence that a specific property is safe from flooding or has direct water access.
Elevation rises sharply toward the northwest
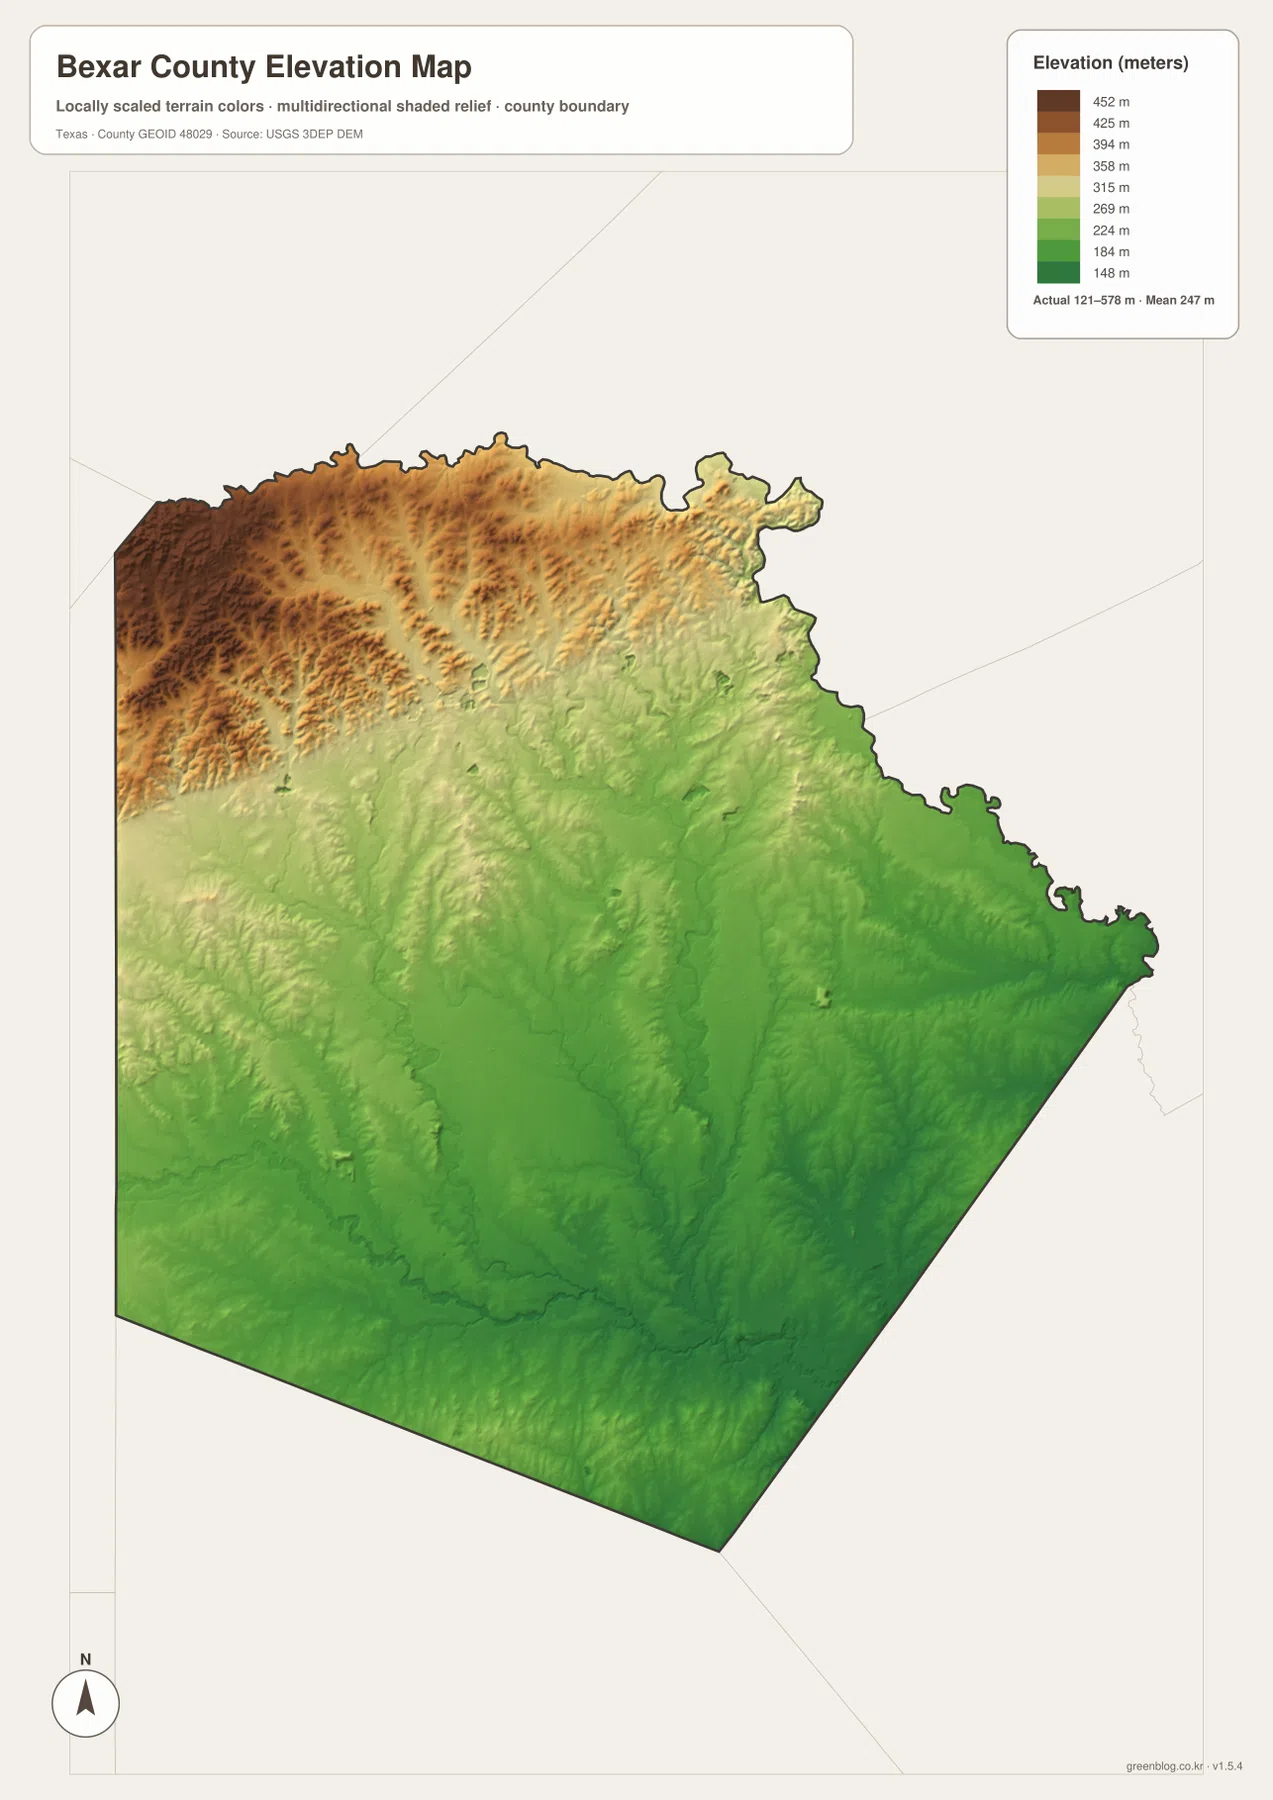
The elevation map shows the county’s strongest physical contrast. Its stated actual range is about 121 to 578 meters, with a mean elevation of 247 meters. Brown and tan terrain dominates the northwest, where ridges and valleys are more pronounced. Colors shift through yellow and light green toward the center, then broader green areas cover much of the south and southeast. The county therefore cannot be described as a single flat surface: the northwestern corner is substantially higher and more dissected than the lower southeastern side.
Placing the city map beside the elevation map adds useful context. San Antonio’s broad footprint occupies much of the central, lower-to-middle portion of the elevation range. Leon Valley lies toward the western side where terrain begins to rise, while the Converse–Universal City–Live Oak–Selma group is east and northeast of the highest northwestern ground. These comparisons are appropriate for understanding broad terrain direction, but the generalized elevation surface is not survey-grade measurement for an individual lot, structure, or engineering project.
What changes when the same place is checked on all four maps
San Antonio is the simplest common reference for moving from one map to another. Start on the county map to establish the boundary, main roads, and named communities. Switch to the city map to see how the selected major cities concentrate in the northeast while Leon Valley remains the western outlier. Next, use the water map to place the San Antonio River, Medina River, Leon Creek, and the southeastern lakes in relation to that urban pattern. Finally, use the elevation map to see why the northwest has a noticeably different physical form from the lower south and southeast.
Each map is better for a different task. For a quick location check or a printed overview, the county map carries the most labels. For comparing only the selected major cities, the city map removes unnecessary detail. The water map is the clearest choice when a creek, river, or lake is the main subject, and the elevation map is the best visual summary of high and low ground. Keeping the task narrow makes the page easier to use than trying to extract every kind of information from a single image.
Frequently Asked Questions
Which map is best for comparing San Antonio with the northeastern Bexar County cities?
Use the ranked city map when the goal is to compare only the selected major cities. It makes the Converse, Universal City, Live Oak, and Selma cluster easy to see, while Leon Valley appears separately on the west side. Use the county map when you also need smaller communities and major roads.
What waterways should I look for besides the San Antonio River?
The Medina River and Leon Creek are useful western and southern references. Salado Creek, Calaveras Creek, and Martinez Creek help organize the central and eastern drainage pattern, while Calaveras Lake and Braunig Lake are prominent labeled water bodies in the southeast.
Where is the largest elevation contrast within Bexar County?
The strongest contrast is between the high, rugged northwest and the lower south and southeast. The elevation map reports an actual county range of about 121–578 meters and a mean of 247 meters. Those values are suitable for county-scale comparison, not precise site surveying.
Sources and map limitations
The following official resources can be used to check county boundaries, hydrography, and elevation data. The maps on this page are general geographic references and should not replace parcel records, legal surveys, flood determinations, navigation products, or engineering measurements.
- U.S. Census Bureau TIGER/Line Shapefiles — boundary, road, and place datasets
- USGS National Hydrography — river, creek, and water-feature information
- USGS 3D Elevation Program — elevation and 3DEP information
- USGS The National Map Viewer — interactive comparison of official geographic layers
Map File Information
The download contains four original high-resolution JPG maps of Bexar County in one ZIP: county, city, water, and elevation.
- Printable Size: 2572×3638px each
- File Type: ZIP containing four JPG files
Related Maps
- Atascosa County Texas map
- Bandera County Texas map
- Wilson County Texas map
- Uvalde County Texas map
- Zavala County Texas map
Green Map creates custom-edited map images using open geographic data sources such as geoBoundaries, Natural Earth, OpenStreetMap, and government open data.
These maps are edited visual materials, not raw data files, and are provided for education, documents, presentations, and graphic reference.