Boone County in northern Arkansas has a land-cover pattern in which forest and agriculture are almost evenly matched. The 2025 summary reports 44.99% forest and 43.22% agriculture, while developed cover accounts for 7.60% and water for 2.16%. Across the county, green forest and agricultural colors interlock over broad areas, but the developed cluster around Harrison and the water in the northeast stand out from that rural background.
This page compares four views of the same county: current land cover, forest and farmland, impervious surface, and mapped class differences from 1985 to 2025. WebP previews are provided in the article, and the four original JPG maps are available together in one ZIP. The set works well for classroom use, county-scale environmental reference, presentations, or a first look at how forest, agriculture, development, and water are distributed.
Table of Contents
Hard surfaces make Harrison stand out from the rural county
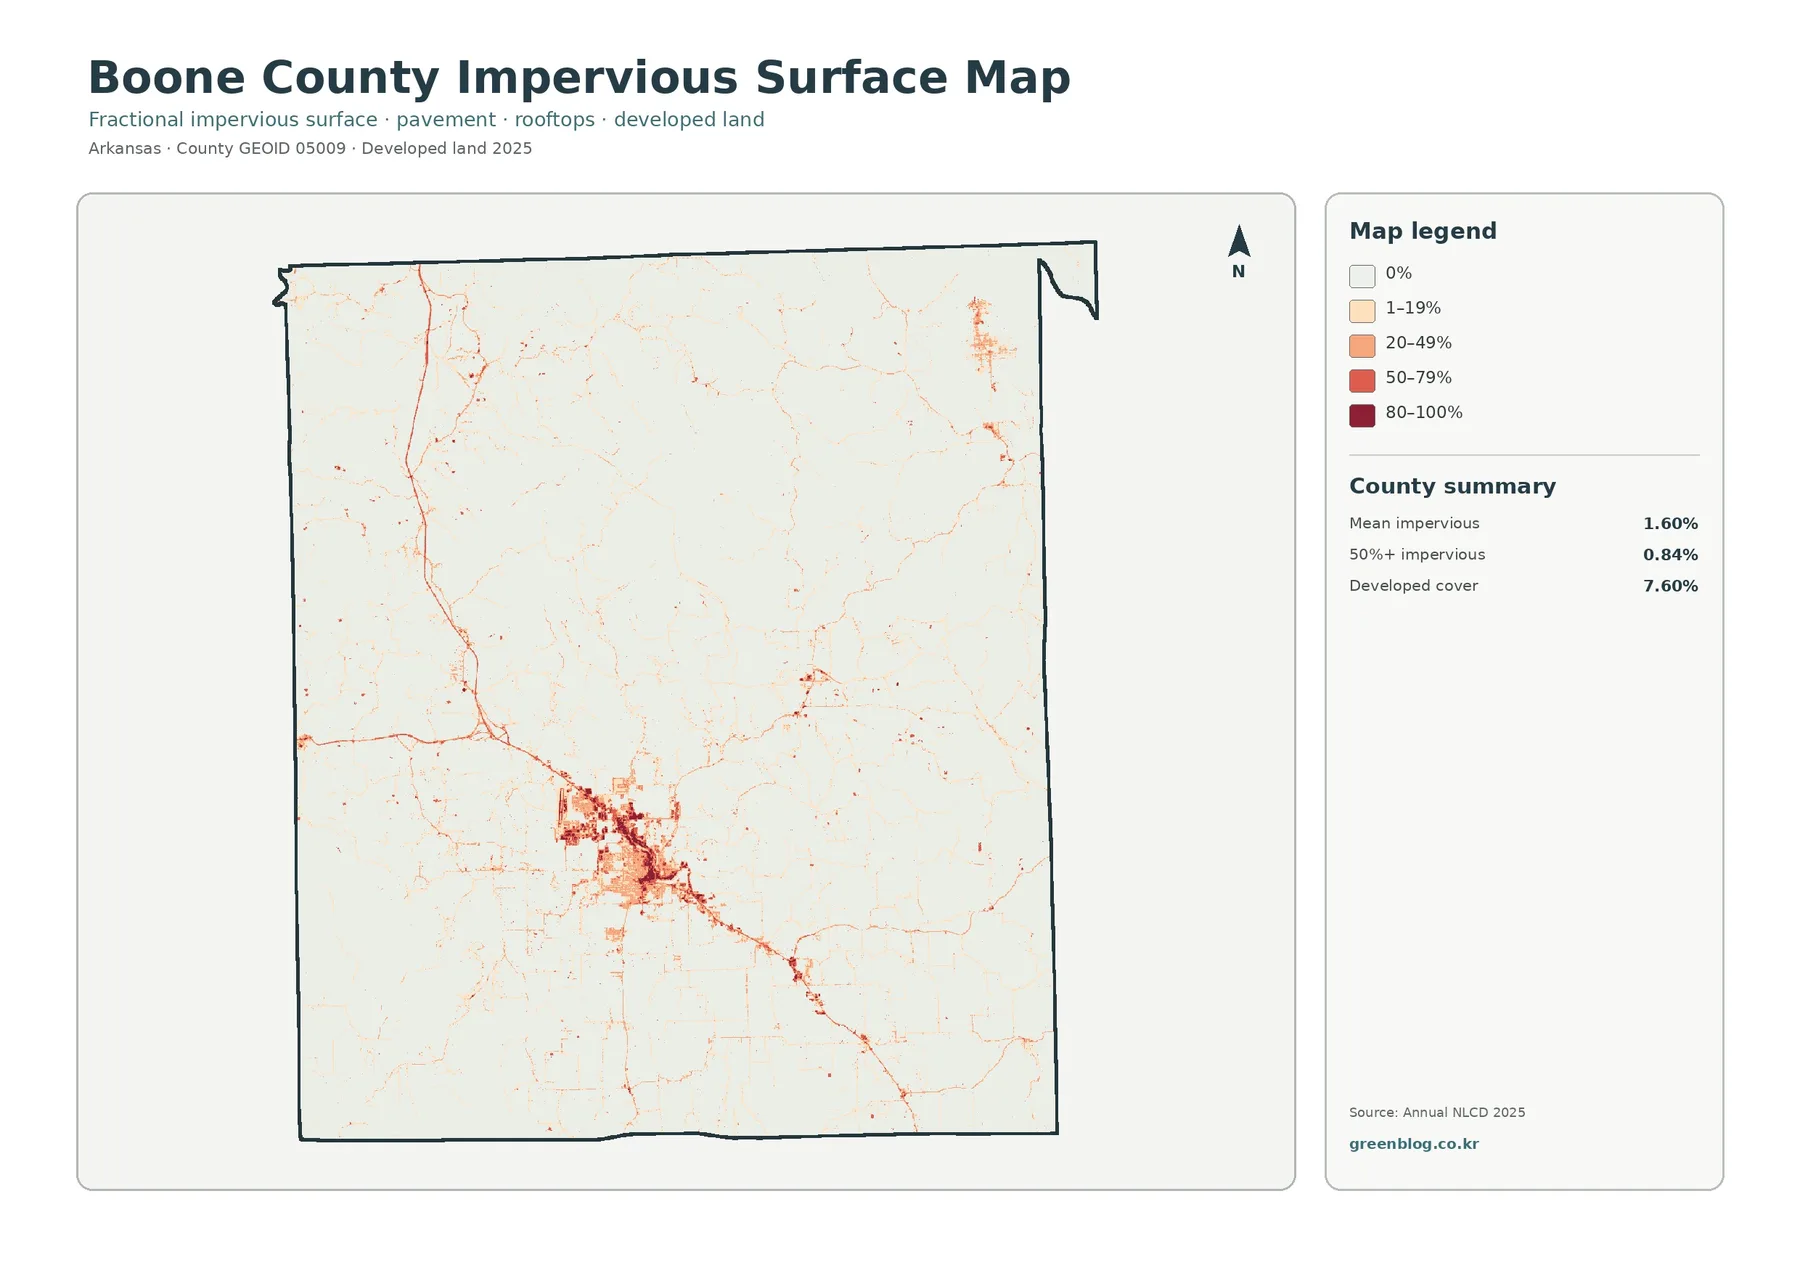
The impervious map is a useful starting point because Boone County is not broadly urbanized. Mean imperviousness is only 1.60% across the county, and 0.84% of the area is mapped at 50% or greater imperviousness. Most of the map is therefore very light. A much darker concentration appears around Harrison, where buildings, parking areas, streets, and other hard surfaces occupy a larger fraction of each 30-meter grid cell.
Developed land and impervious surface should not be treated as the same measurement. Developed cover is 7.60%, substantially larger than the 1.60% mean impervious value. A low-density developed cell can still contain lawns, trees, exposed soil, and other surfaces that absorb water. Imperviousness measures the hard fraction inside the cell, so the darkest values are much more concentrated than the broader developed class.
Forest and agriculture divide most of the 2025 landscape
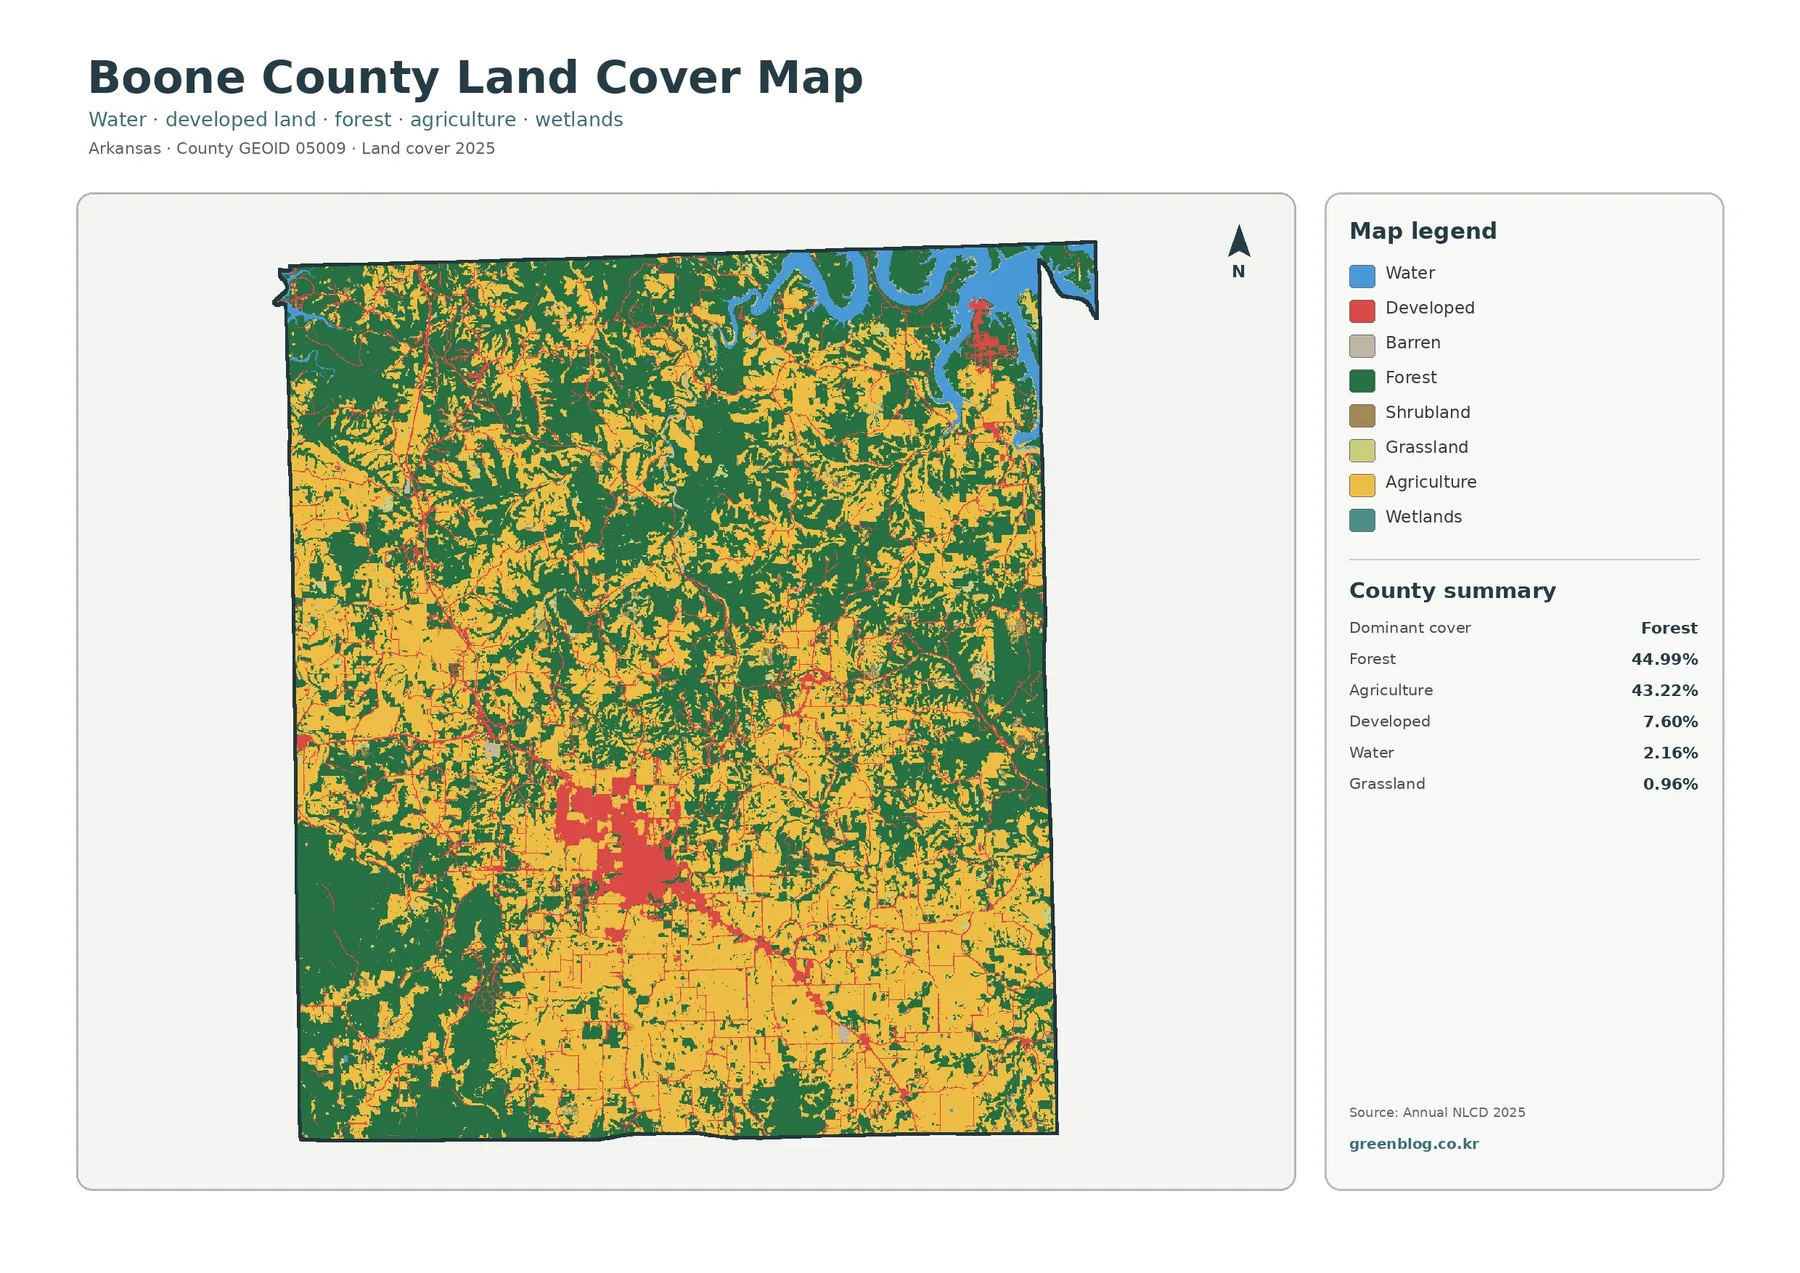
The general land-cover map brings the county’s main contrasts into one view. Forest is the largest class at 44.99%, but agriculture follows closely at 43.22%. Rather than forming two simple halves, those categories weave through one another. Broad agricultural areas are especially visible in the southern part of the county and in several western and central areas, while larger forest blocks remain prominent in the southwest, east, and many northern sections.
Land cover is not the same as zoning, ownership, or legal land use. A cell classified as agriculture describes the surface observed by the land-cover product, not the owner, farm boundary, crop type, or permitted use of the parcel. Forest is likewise a vegetation class rather than the boundary of a park or timber property. Anyone needing legal or parcel-level information should use county records, surveys, or a dedicated cadastral map instead.
The forest-and-farmland view clarifies a patchwork of working land and woodland
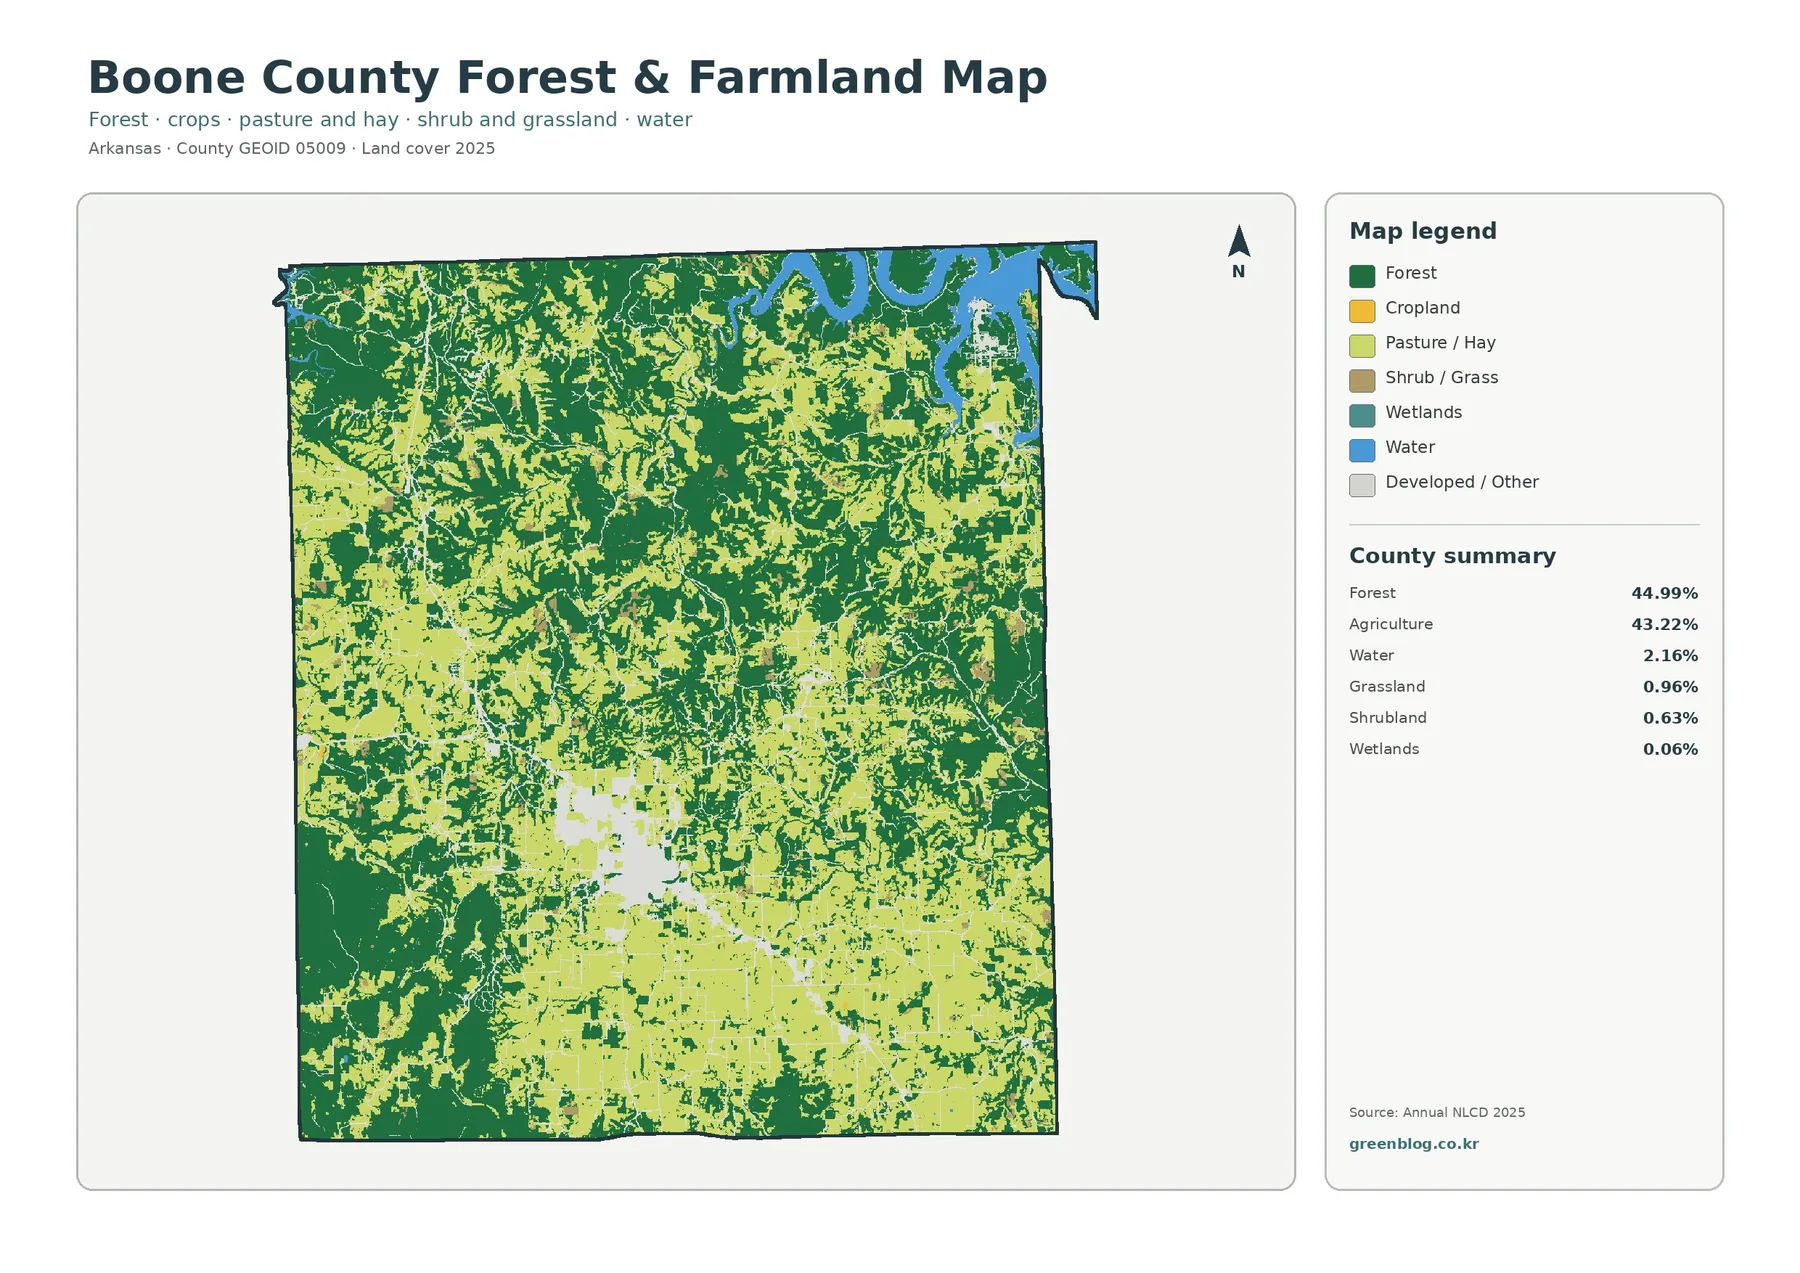
Removing much of the visual competition from the general map makes the forest-agriculture relationship easier to follow. Forest remains the single largest summary class, but agriculture is close enough that both colors occupy large continuous and semi-continuous areas. Agricultural cover is particularly broad in the south, while forest forms larger blocks in the southwest and east. Across the north and center, the two covers repeatedly alternate rather than forming one uninterrupted zone.
Northeastern water connects the county map with Bull Shoals Lake
Water occupies only 2.16% of Boone County in the 2025 summary, but the northeast corner has a distinctive branched shoreline that makes water easy to notice. U.S. Army Corps of Engineers information for Bull Shoals Lake identifies Lead Hill Park on the lake, and Boone County government lists Lead Hill, South Lead Hill, and Diamond City among local municipalities. Those official references provide geographic context for the water visible near the county’s northeastern edge.
The 1985–2025 map records 11.94% endpoint class difference
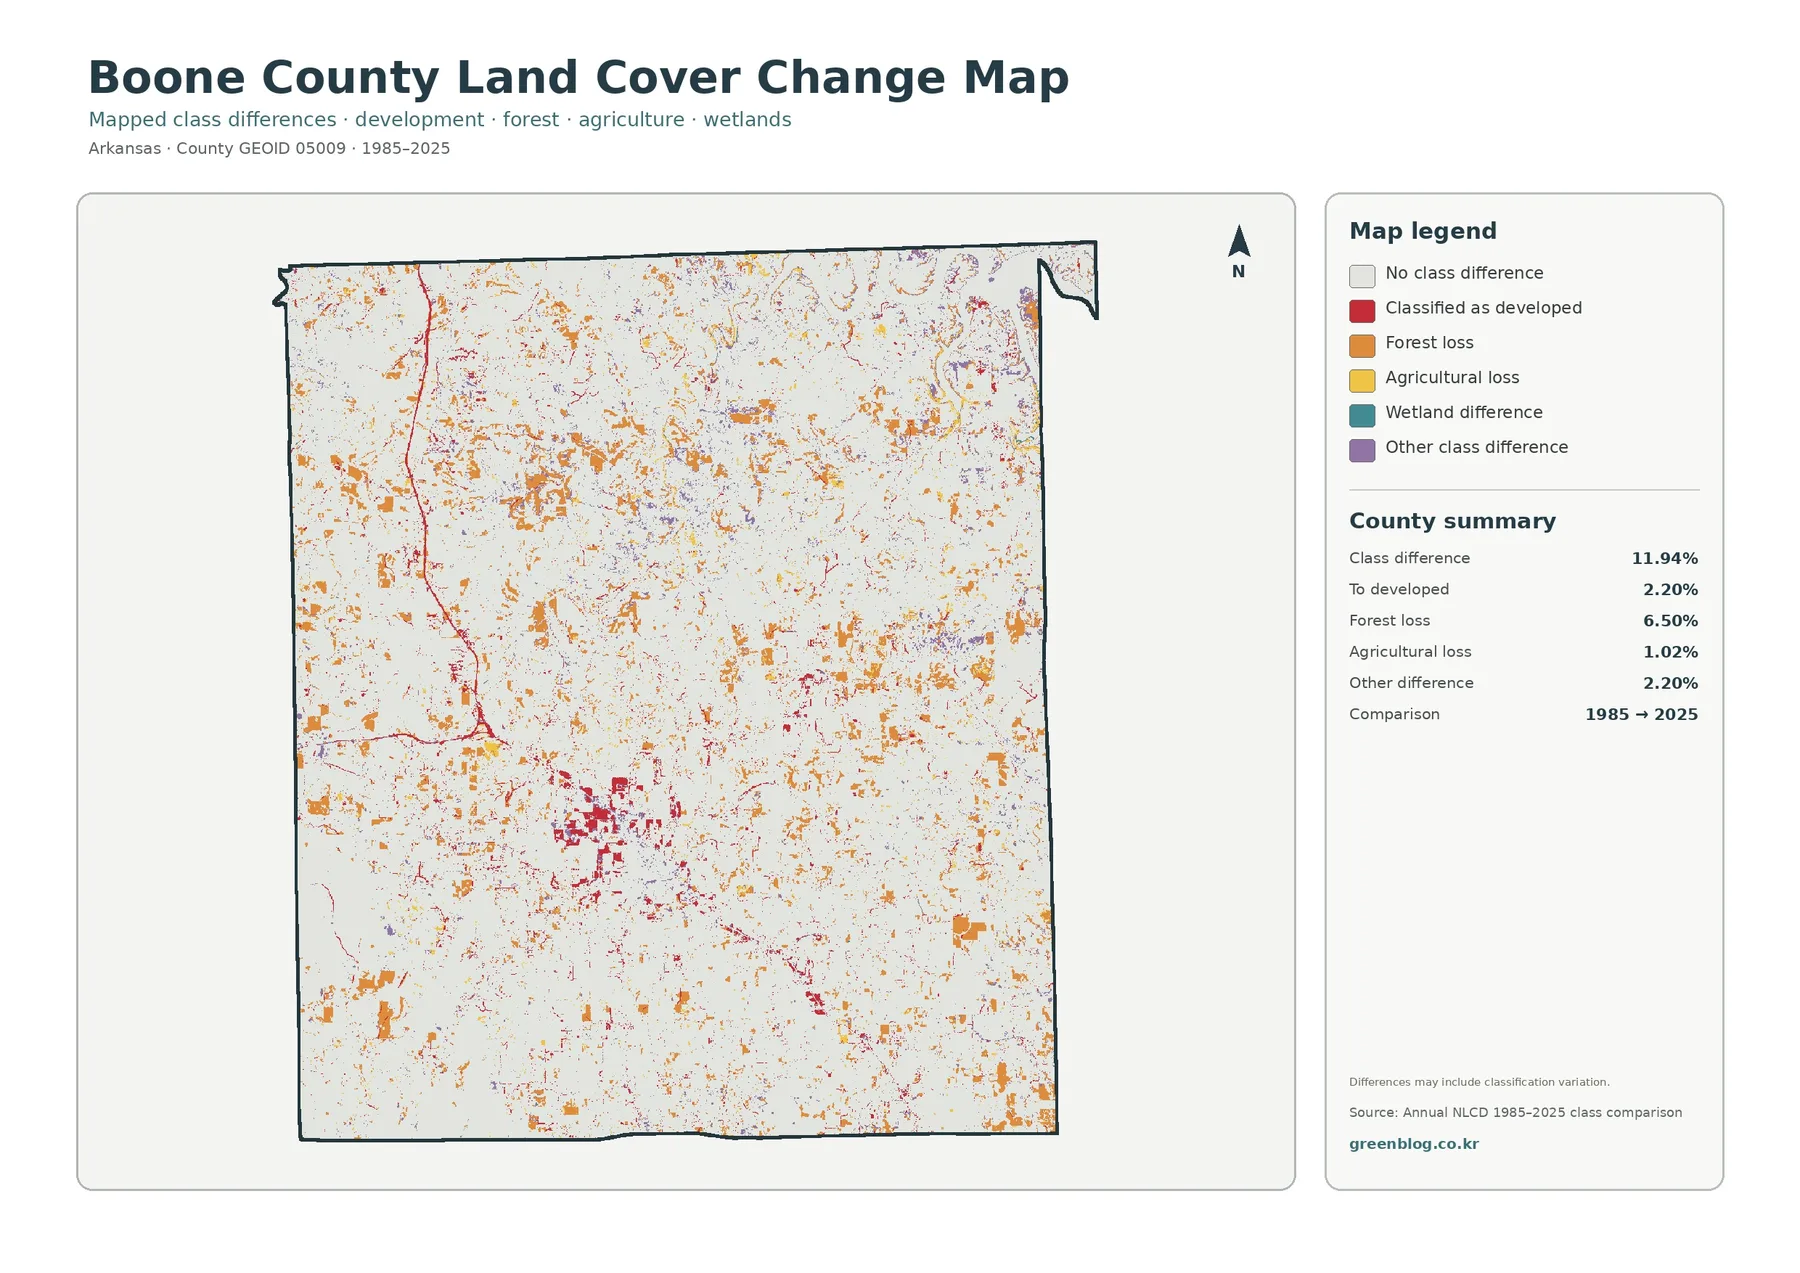
The change map does not show a continuous year-by-year history. Instead, it compares the representative land-cover class at two endpoints, 1985 and 2025. The supplied summary reports a total class difference of 11.94%. Forest loss is the largest named component at 6.50%, change to developed is 2.20%, agricultural loss is 1.02%, and other difference is 2.20%. Wetland difference is present in the legend without a separate percentage in the summary.
The 6.50% forest-loss category should not be read as a direct measurement of permanent deforestation. A difference between endpoint classes can reflect actual conversion, timber harvest and regrowth, vegetation changes, mixed-pixel effects, classification boundaries, or differences in imagery. The same caution applies to agricultural loss. The map identifies where classification changed; it does not by itself establish the cause, exact date, or permanence of that change.
How to read 30-meter raster cells without treating them as parcels
Annual NLCD is a Landsat-based raster product. A raster divides the landscape into a grid and stores a class or value for each cell. The maps used here are designed for county-scale comparison at roughly 30-meter resolution, which is detailed enough to show broad settlement, forest, farm, and water patterns but too coarse to reproduce every narrow road, fence line, small pond, or individual building exactly.
The map year is another limitation. Current land-cover and impervious products in this package are labeled 2025, and the change layer compares 1985 with 2025. Construction, clearing, regrowth, or agricultural changes after that observation period are not represented. Small classification differences can also be affected by imagery and processing. For a current site decision, recent aerial photography and local records are necessary.
Choosing a Boone County map for teaching, reports, and comparisons
For a general county introduction, use the 2025 land-cover map. It places forest, agriculture, developed land, water, and smaller classes in one legend and makes the county’s main contrasts visible on a single page. If the subject is working land or woodland, the forest-and-farmland map removes some of that complexity and makes the 44.99% forest and 43.22% agriculture relationship easier to explain.
Download the four Boone County JPG maps
The download ZIP contains four original JPG files: the 2025 land-cover map, the forest and farmland map, the impervious surface and developed-land map, and the 1985–2025 land-cover change map. Each original JPG is 2480×1754 pixels. The article previews are 1800×1273 WebP images, so the JPG files are the better choice when a larger saved image is useful for a document, slide, or local reference folder.
Frequently Asked Questions
What is the dominant land cover in Boone County?
Forest is the largest 2025 class at 44.99%, but agriculture is very close at 43.22%. The county is therefore better described as a mixed forest-and-agriculture landscape than as a place dominated by only one of those covers. Developed land is 7.60%, and water is 2.16%.
Why is developed cover 7.60% while mean imperviousness is only 1.60%?
They measure different things. Developed cover is a land-cover category and can include low-density areas with lawns, trees, and other permeable surfaces. Imperviousness measures the fraction of pavement, rooftops, and similar hard surfaces inside each cell. This is why the county can have 7.60% developed cover while the average impervious value remains 1.60%.
Does the 11.94% class difference mean that 11.94% of Boone County was permanently converted?
No. The figure describes cells whose representative endpoint class differs between 1985 and 2025. The summary lists 6.50% forest loss, 2.20% change to developed, 1.02% agricultural loss, and 2.20% other difference, with a wetland-difference category also mapped. Determining the cause and permanence of a change requires intermediate imagery or local records.
Can these maps be used to locate exact farm or property boundaries?
No. The land-cover products use generalized raster cells rather than surveyed parcel lines. Forest, agriculture, water, and developed colors describe the surface at county scale and can simplify narrow features. Exact ownership, acreage, zoning, or legal boundaries should be checked with county cadastral records, surveys, or other authoritative parcel data.
Map File Information
Boone County Land Cover Maps — 4 JPG Files
- Included Files: Use only the versions confirmed in the article and supplied images
- File Type: Use the confirmed download contents
- Intended Use: Printing, education, presentations, and map-based projects
Related Maps
- Arkansas County Arkansas Land Cover Map
- Ashley County Arkansas Land Cover Map
- Baxter County Arkansas Land Cover Map
Sources and references
Annual land-cover products are available from MRLC Annual NLCD Data, and class definitions are documented by the USGS Annual NLCD Land Cover Classification. Official county boundary files are available through U.S. Census Bureau TIGER/Line Shapefiles.
Local municipality context comes from Boone County AR Government — Cities & Towns. Agricultural background and local extension programs are described by the University of Arkansas Boone County Extension Service.
For lake-specific information in the northeast, see the U.S. Army Corps of Engineers Bull Shoals Lake project. Its recreation and project resources are more appropriate for shoreline facilities, lake management, and navigation than a generalized land-cover raster.
Green Map creates custom-edited map images using open geographic data sources such as geoBoundaries, Natural Earth, OpenStreetMap, and government open data.
These maps are edited visual materials, not raw data files, and are provided for education, documents, presentations, and graphic reference.