Bradley County has a land-cover pattern shaped far more by forest and wetlands than by broad urban or agricultural areas. In the 2025 summary, forest accounts for 48.32% of the county and wetlands another 32.07%. Development occupies 5.56%, with its clearest concentration around Warren, while grassland, agriculture, shrubland, and open water appear in smaller pieces across the county.
This page compares four views of that landscape: current land cover, forest and farmland, impervious surface and developed land, and mapped class differences from 1985 to 2025. Each view is shown as a WebP preview in the article, and the four original JPG maps are available together in one download for reference, teaching, presentations, and county-scale comparison.
Table of Contents
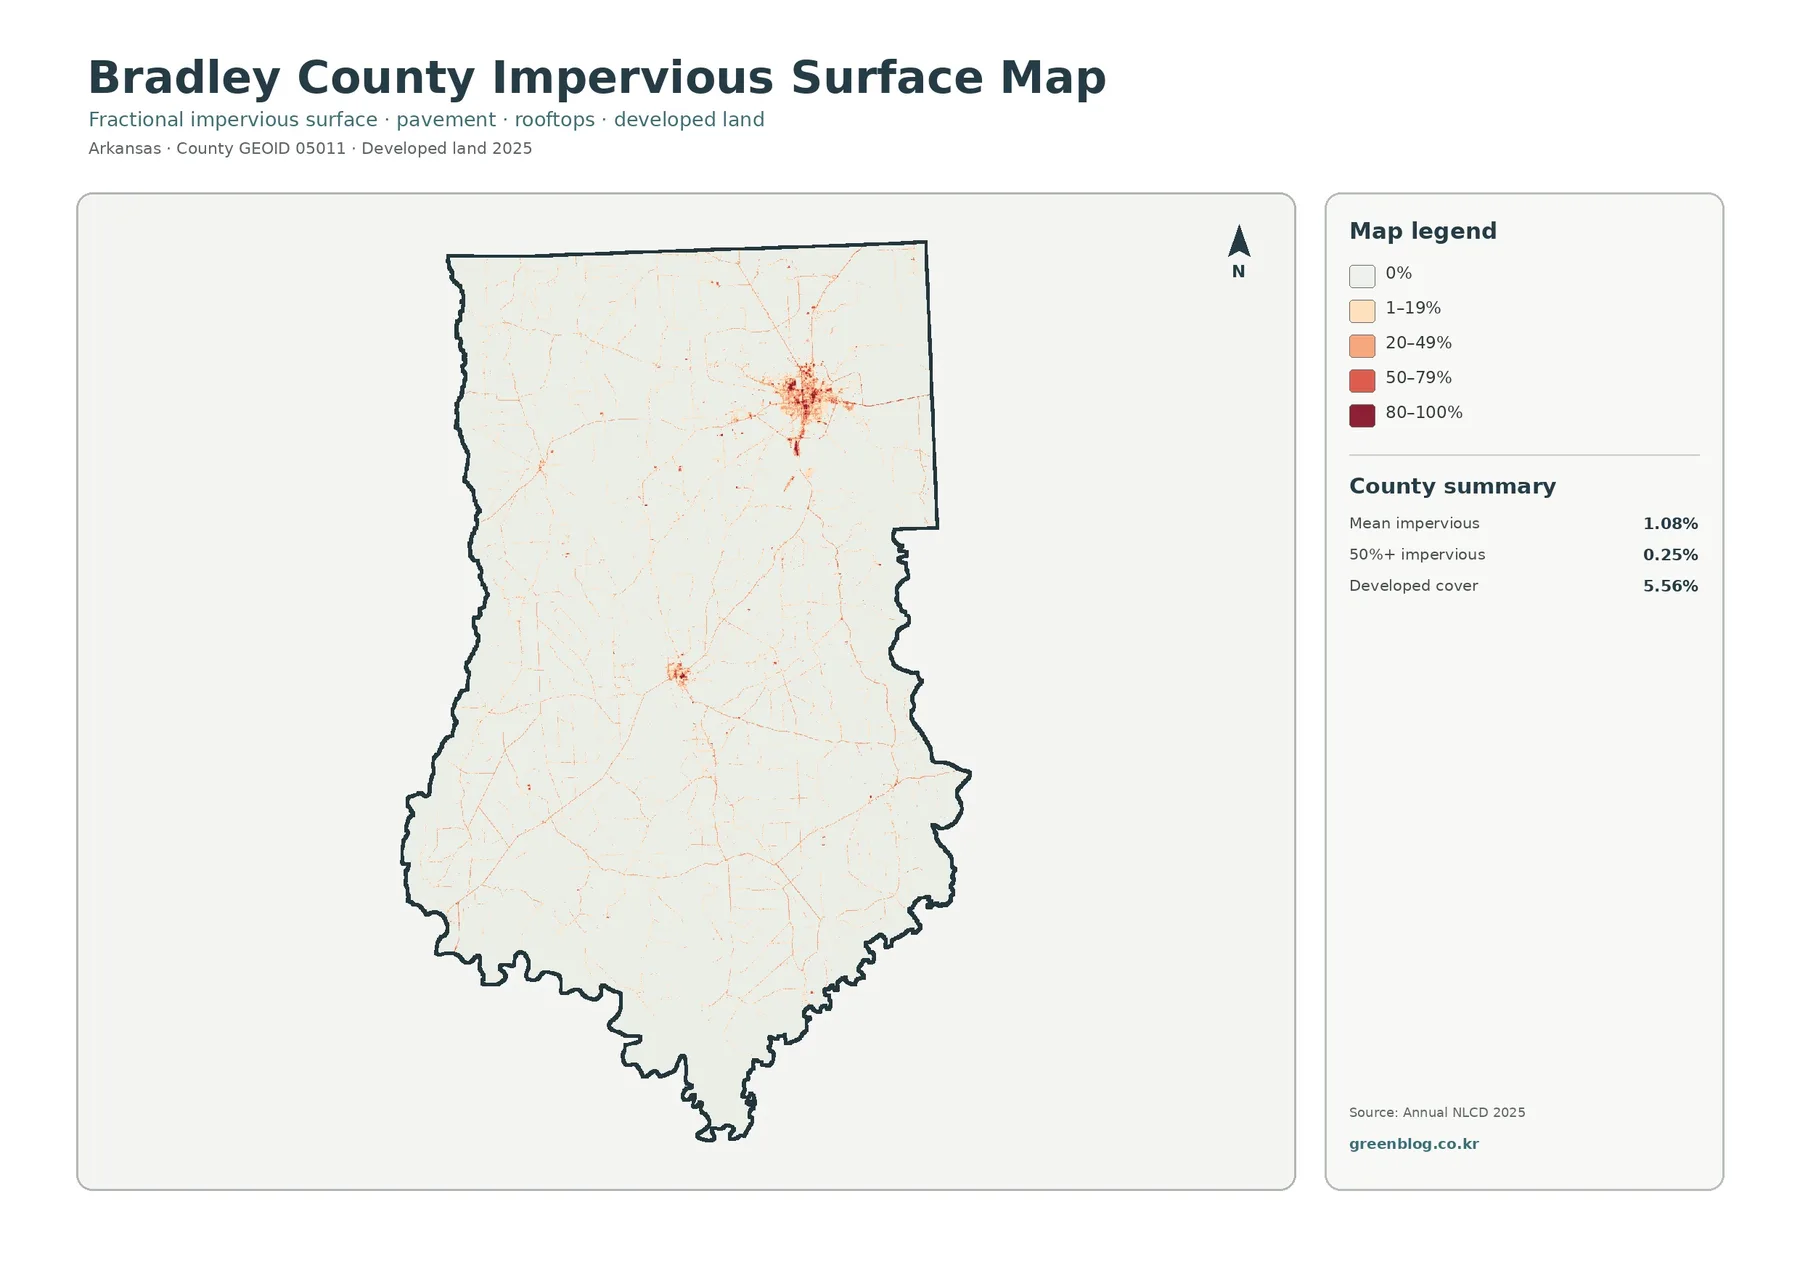
Warren stands out in an otherwise lightly impervious county
The developed-land share of 5.56% does not mean that buildings and pavement cover that same percentage of every place in Bradley County. The impervious map measures hard surfaces more directly. Countywide mean imperviousness is only 1.08%, and areas at 50% or greater impervious cover account for 0.25%. Those numbers fit the visible pattern: most of the county is pale on the impervious map, while a compact cluster of stronger values appears in the north-central area around Warren.
The 2025 map is dominated by forest and wetlands
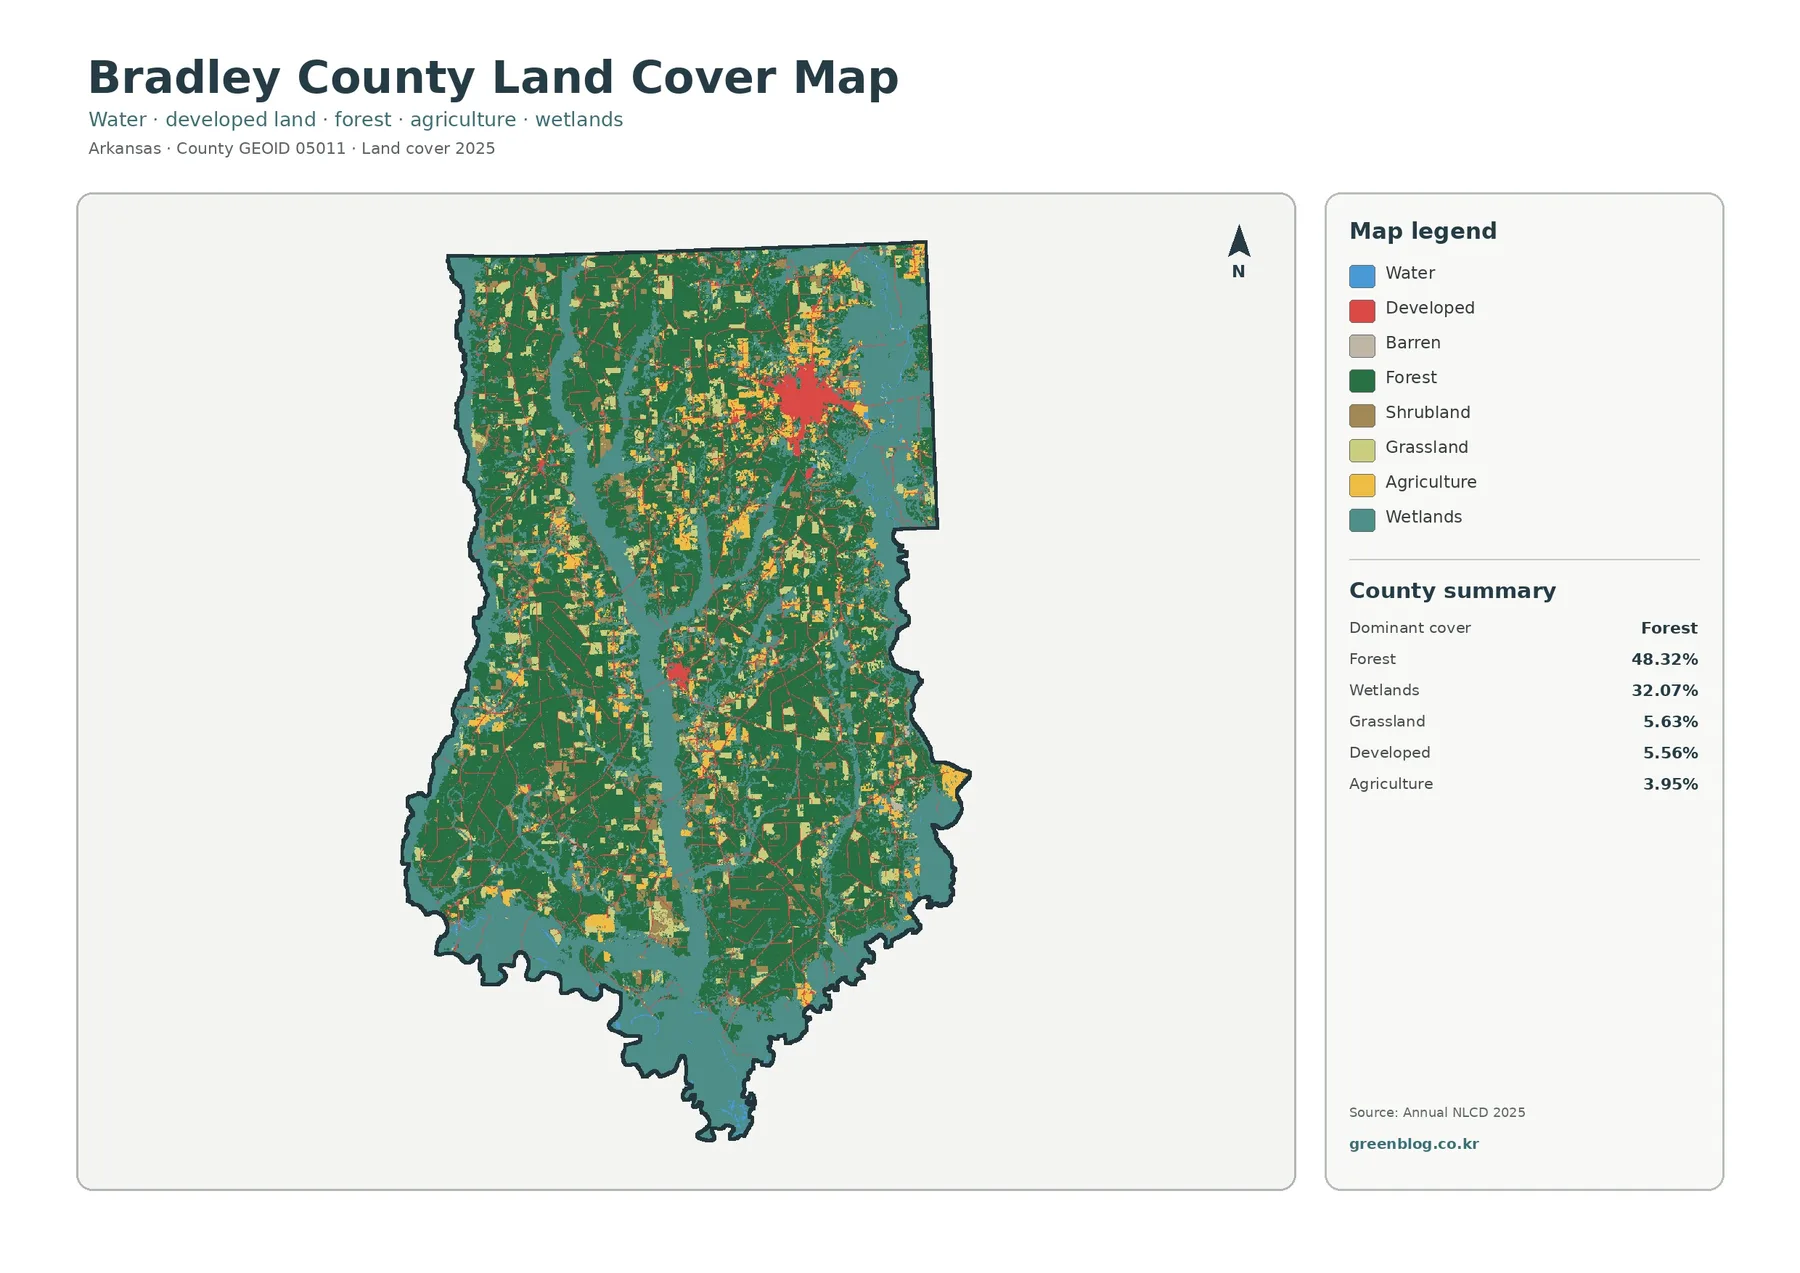
The general land-cover map brings the full mix together. Forest is the largest class at 48.32%, followed by wetlands at 32.07%. Grassland accounts for 5.63%, developed land 5.56%, agriculture 3.95%, shrubland 3.62%, and water 0.70%. Forest and wetlands therefore make up more than four-fifths of the mapped county, which is why dark green and blue-green tones occupy most of the image.
Those two dominant classes are interwoven rather than divided by one clean line. Larger forest blocks are especially noticeable through the southern and western portions, while wetland colors form broad, irregular belts through many parts of the county. Smaller agricultural and grassland patches break up the forest in the north, center, and south. The result is a mosaic of wooded and wet ground with limited open agriculture rather than a county split into one forest half and one farming half.
Forest and farmland are easier to compare when the legend is simplified
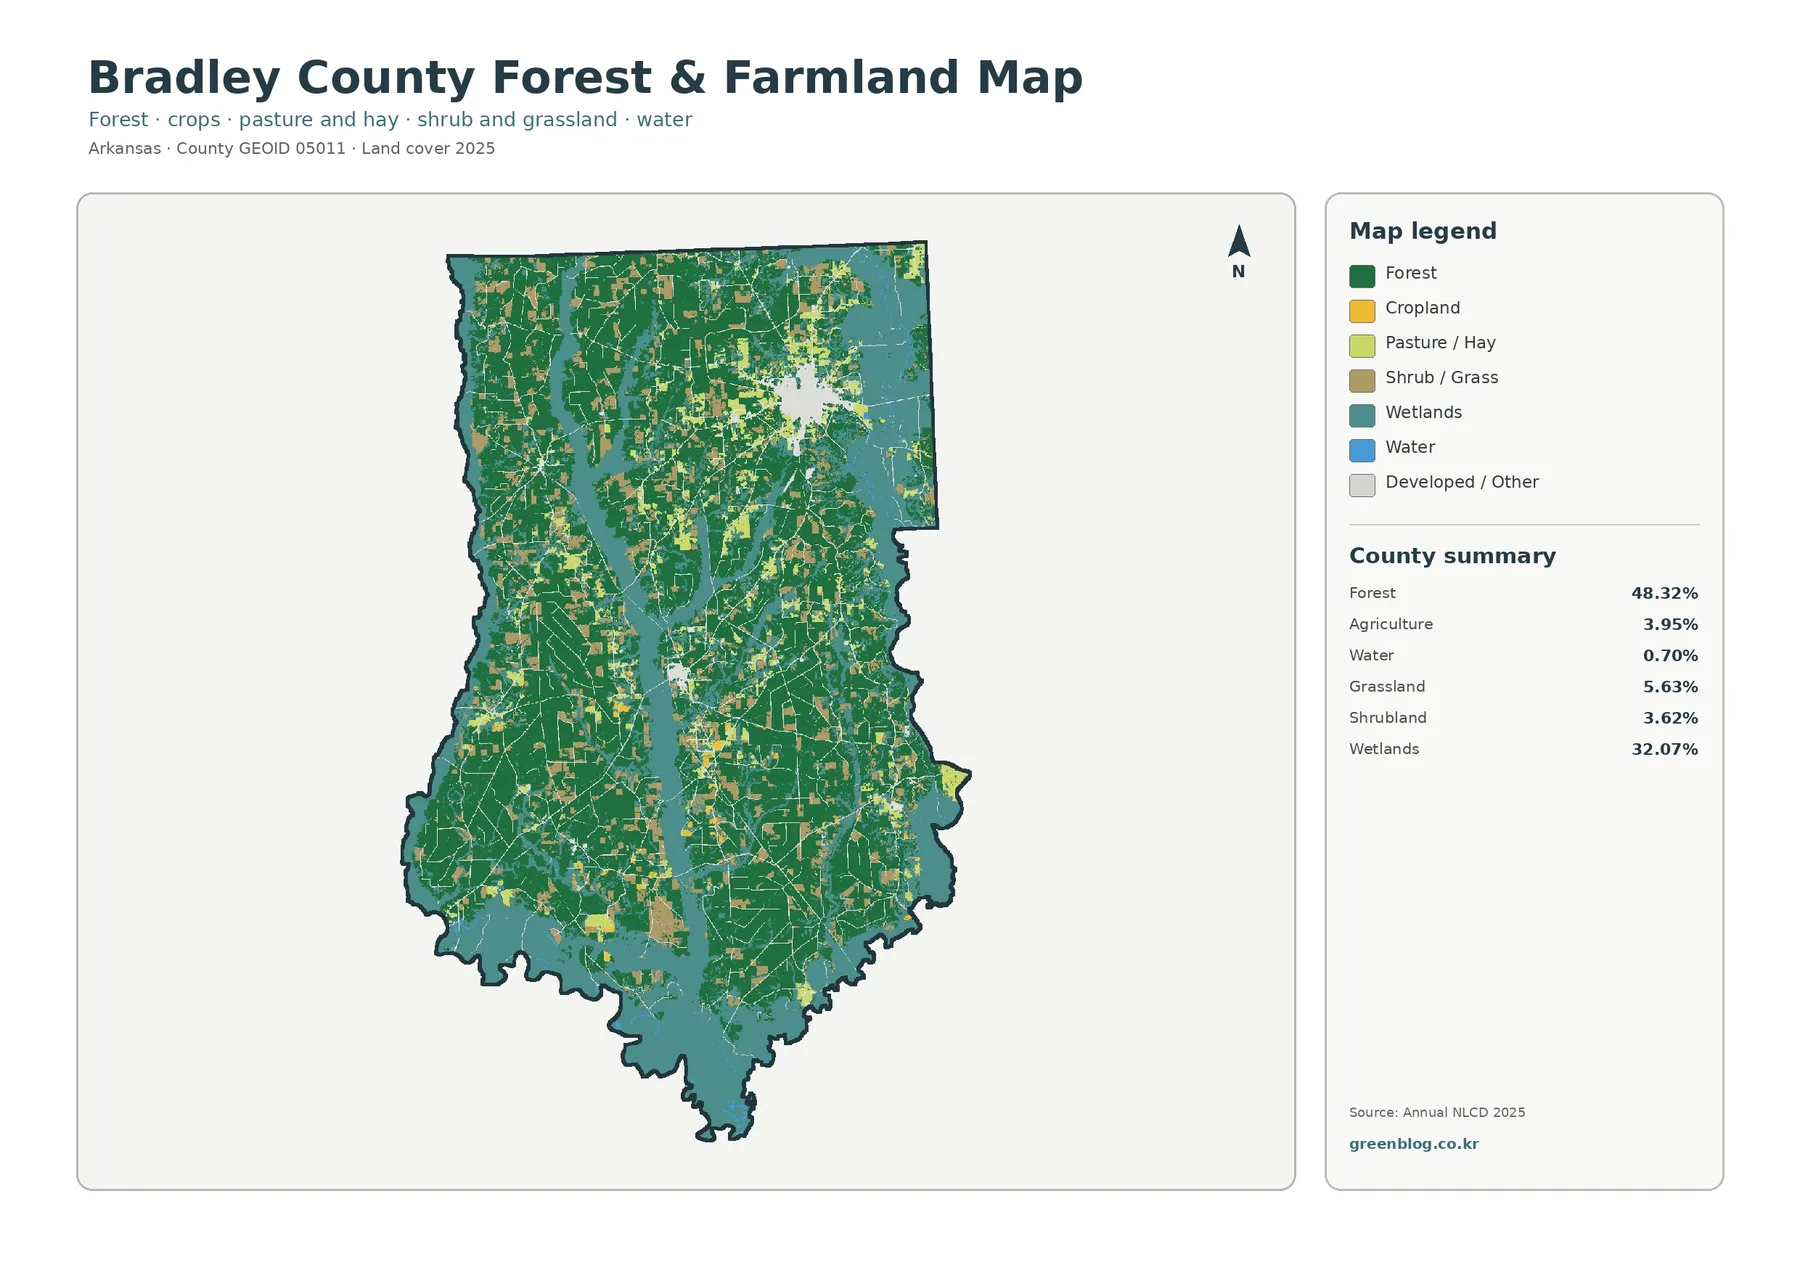
With urban detail reduced, the forest-and-farmland map makes the county’s wooded character easier to see. Forest covers 48.32%, creating large dark-green blocks and many smaller connections between them. Agriculture is only 3.95%, so cropland does not form one sweeping belt. Instead, the agricultural colors appear in scattered rectangular and irregular openings, especially through the northern and central parts of the county and in smaller patches farther south.
Not every light-colored opening is cropland. The legend separates cropland, pasture or hay, shrub or grassland, wetlands, water, and developed or other land. Grassland alone accounts for 5.63%, and shrubland for 3.62%, both of which are separate from the 3.95% agriculture figure. That distinction matters when someone is using the map to discuss farming. A field-like shape can represent pasture, hay, grass, or another open cover rather than a planted crop.
The wetland share is large, but open water remains a separate class
One of the most important reading points for Bradley County is the distinction between wetlands and water. Wetlands account for 32.07%, while open water is 0.70%. A wetland cell can contain saturated soil and wetland vegetation without appearing as an open river, lake, or pond. Treating all blue-green wetland areas as open water would therefore greatly overstate the amount of standing or flowing water shown by the dataset.
Mapped class differences reach 21.02% between 1985 and 2025
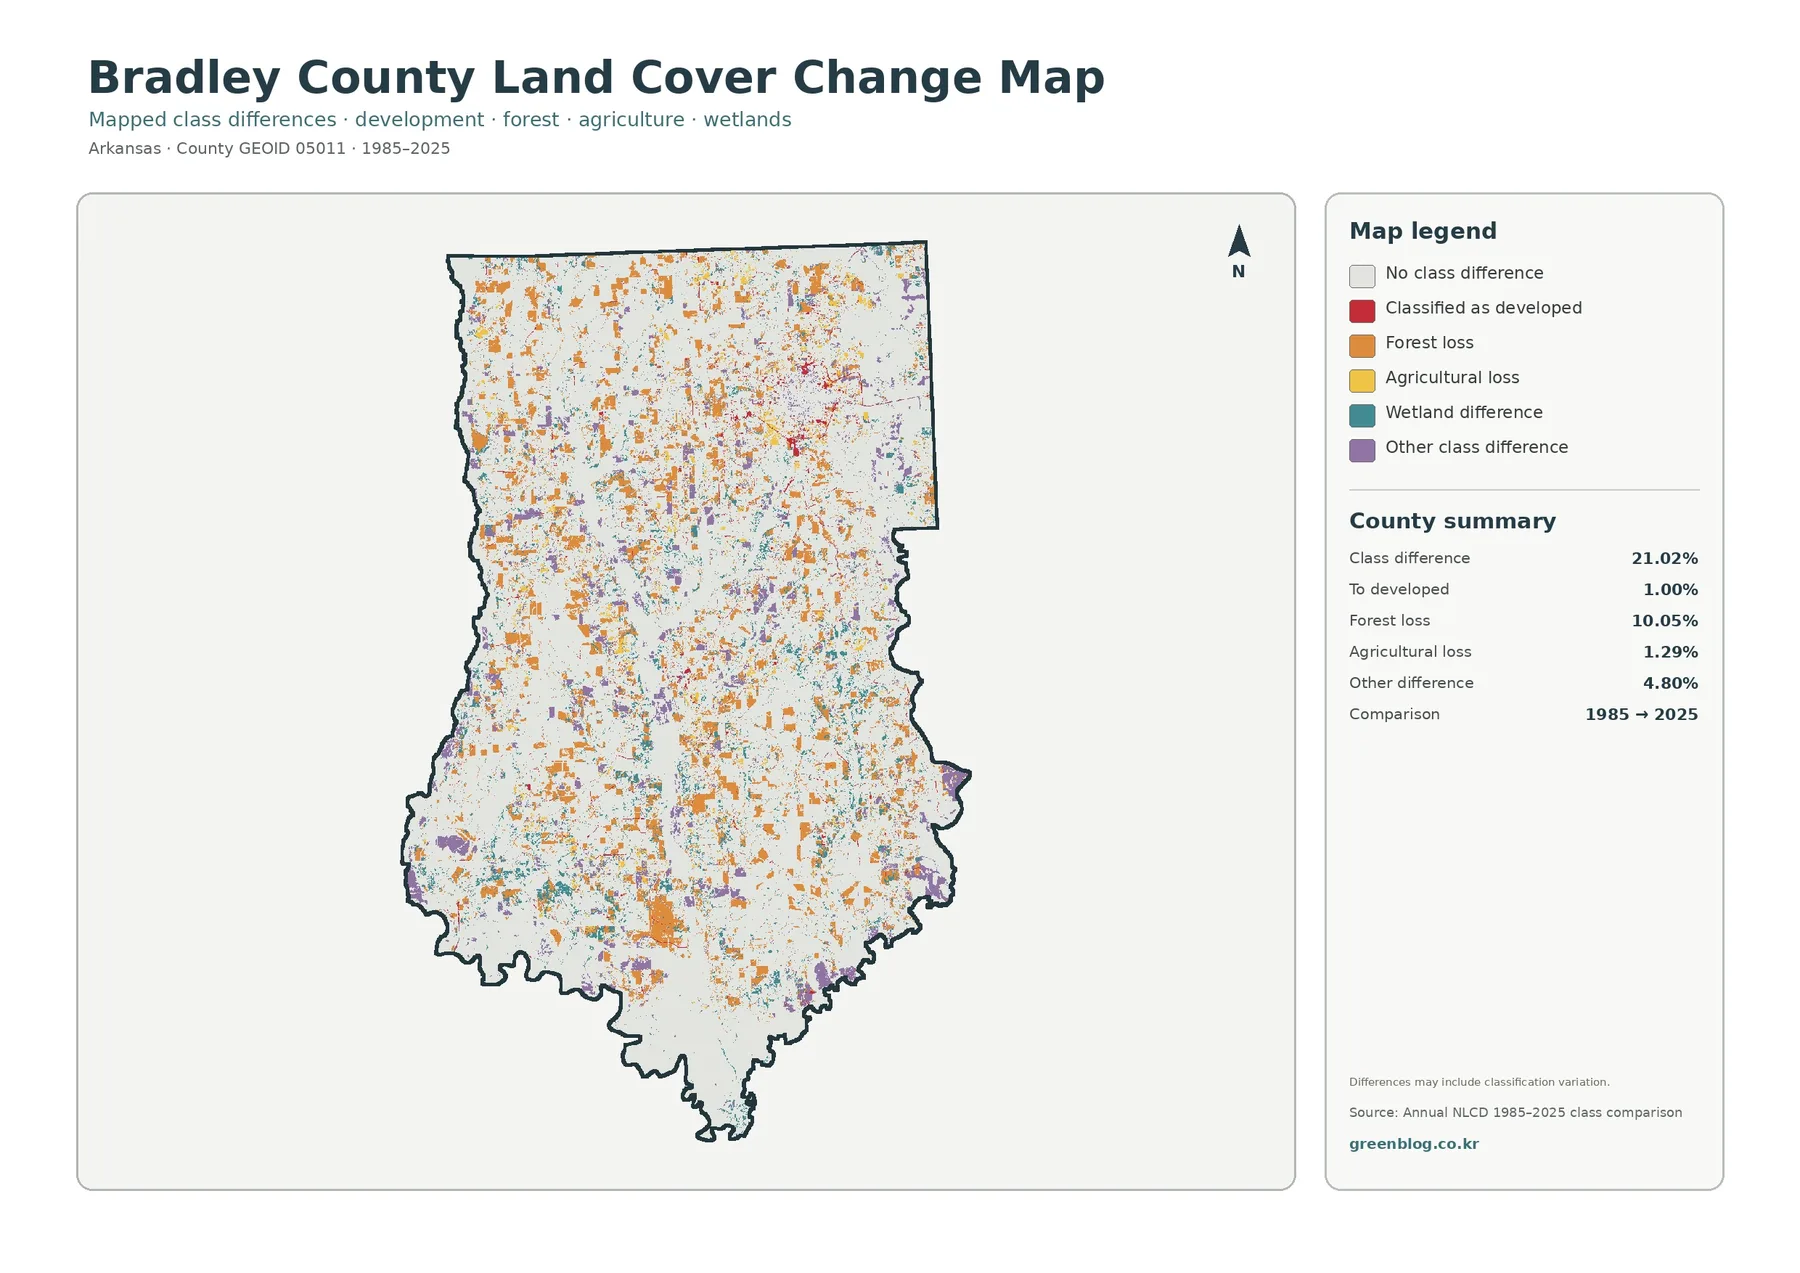
The change map compares representative land-cover classes for 1985 and 2025. The county summary reports class differences across 21.02% of the mapped area. Of the categories that are given separate percentages, forest loss is largest at 10.05%. Cells classified as developed account for 1.00%, agricultural loss for 1.29%, and other class difference for 4.80%. Wetland difference is shown in the legend but no separate percentage is printed, so it should not be back-calculated from the other values.
Orange forest-loss cells are scattered from north to south, often as small or medium patches rather than one single block. Red cells associated with a developed classification are more concentrated around Warren, with smaller occurrences elsewhere. Wetland-difference colors also appear in multiple lowland-looking areas. The map is best read as a record of where the two selected classifications disagree, not as a complete timeline of everything that happened during the forty-year interval.
A forest-loss label does not automatically mean permanent clearing. Timber harvest followed by regrowth, changes in vegetation condition, a shift between forest and another vegetated class, classification boundaries, imagery differences, or actual conversion can all contribute to mapped differences. The same caution applies to agricultural loss. These categories are useful for locating places that deserve a closer look, but identifying a cause requires intermediate-year imagery, forestry or agricultural records, and sometimes site inspection.
Frequently Asked Questions
What is the largest land-cover class in Bradley County?
Forest is the largest 2025 class at 48.32%. Wetlands are second at 32.07%, so the two categories together dominate the county map. Grassland is 5.63%, developed land 5.56%, agriculture 3.95%, shrubland 3.62%, and open water 0.70%.
Does the 21.02% class difference mean 21.02% of the county was developed?
No. The 21.02% figure is the total share of cells whose representative class differs between the 1985 and 2025 comparison. The map separately reports 1.00% as classified to developed, 10.05% as forest loss, 1.29% as agricultural loss, and 4.80% as other difference. Those categories still require additional evidence before assigning a cause.
Can this map be used to identify legal wetlands or parcel boundaries?
No. The maps are county-scale raster classifications, not parcel surveys or regulatory wetland delineations. They are useful for broad patterns and comparison, but ownership, zoning, legal boundaries, permits, and site-specific wetland status require the appropriate county or agency records.
Scale, raster cells, and other limits to keep in mind
Annual NLCD is raster data, which means the landscape is divided into grid cells and each cell receives a representative value. At the commonly used 30-meter scale, narrow roads, small buildings, tiny ponds, field edges, and short drainage features can be simplified. A cell can also contain more than one real surface type even though the map assigns one class. This is often called a mixed-pixel issue, and it becomes more important when zooming in.
Land cover should also be separated from zoning, ownership, parcel boundaries, and legal land use. A forest-colored cell tells the reader what surface cover was classified there; it does not identify the owner or say whether construction is permitted. A wetland-colored cell is not a regulatory wetland determination. Parcel and legal questions need county records, surveys, or the appropriate permitting agency rather than a county-scale land-cover product.
Download the four Bradley County JPG maps
The ZIP contains the original JPG versions of the 2025 land-cover map, forest-and-farmland map, impervious-surface and developed-land map, and 1985–2025 land-cover change map. Each JPG is 2480×1754 pixels; the article previews are 1800×1273 WebP images. The original files are useful when you want to inspect smaller mapped patches, place a map into a slide or document, or keep all four views together for later comparison.
Map File Information
Bradley County Land Cover Maps — 4 JPG Files
- Included Files: Use only the versions confirmed in the article and supplied images
- File Type: Use the confirmed download contents
- Intended Use: Printing, education, presentations, and map-based projects
Related Maps
- Arkansas County Arkansas Land Cover Map
- Ashley County Arkansas Land Cover Map
- Baxter County Arkansas Land Cover Map
Sources and References
Land-cover data and annual products are available through MRLC Annual NLCD Data, while class definitions are documented by the USGS Annual NLCD Land Cover Classification. County boundary data can be checked through the U.S. Census Bureau TIGER/Line Shapefiles.
For local context, the University of Arkansas System Cooperative Extension Bradley County Office and its Bradley County programs provide county-specific agriculture and natural-resource information. The Encyclopedia of Arkansas Bradley County profile provides geographic context for the county’s major river boundaries.
Green Map creates custom-edited map images using open geographic data sources such as geoBoundaries, Natural Earth, OpenStreetMap, and government open data.
These maps are edited visual materials, not raw data files, and are provided for education, documents, presentations, and graphic reference.