You can download four high-resolution JPG maps of Haakon County from this page in one ZIP file, while the WebP versions in the article are sized for quick viewing. Philip is the easiest place to use as an anchor: it sits near the south-central edge of the county, with Midland much farther east in the southeast. The maps then add different layers around those two places—numbered roads and localities, a simplified ranked-community view, named rivers and creeks, and a relief surface that ranges from about 483 to 860 meters.
Haakon County does not read like a neat rectangle. The south and west include long straight boundary segments, but the northern line bends repeatedly and the northeast projects outward before dropping south along the eastern side. That irregular outline matters because the drainage is also strongly divided. Bad River and its forks organize much of the south, Plum Creek and West Plum Creek cut the interior, and the Cheyenne River name appears toward the northwest and north. When the county outline is matched across the four maps, the roads, towns, valleys, and high ground become easier to place.
The elevation map provides the clearest summary of that contrast. Its legend gives an actual range of roughly 483–860 meters and a mean near 697 meters. Broad brown uplands occupy the southwest and parts of the west, while green and light-green valleys thread northward, eastward, and along the Bad River corridor in the south. The water map explains many of those low strips: Bridger Creek, West Plum Creek, Plum Creek, Midland Creek, Ash Creek, the North and South Forks of Bad River, and many smaller tributaries carve through the county.
Table of Contents
Philip anchors the southern road network, while Midland marks the far southeast
On the general county map, Philip is the most obvious reference point because it lies just inside the southern boundary near the middle of the county. From there, the mapped road system spreads west and north toward the areas labeled 73 and 34, while the main southern route continues east past Nowlin toward Midland. Midland sits much closer to the southeastern edge and to the road labeled 14, so the two communities frame a long southern span rather than a compact cluster.
Other labels help establish the county’s scale. Bridger appears in the west, Cherry Creek lies close to the winding northern boundary, and Dowling is marked as a historical place on the western side. A route labeled 11 appears through the south-central interior, while 63 is shown near the northeastern projection. These labels are useful not because they create a complete street network—the map is not a turn-by-turn navigation product—but because they show where the better-known localities and numbered routes sit inside an unusually shaped county.
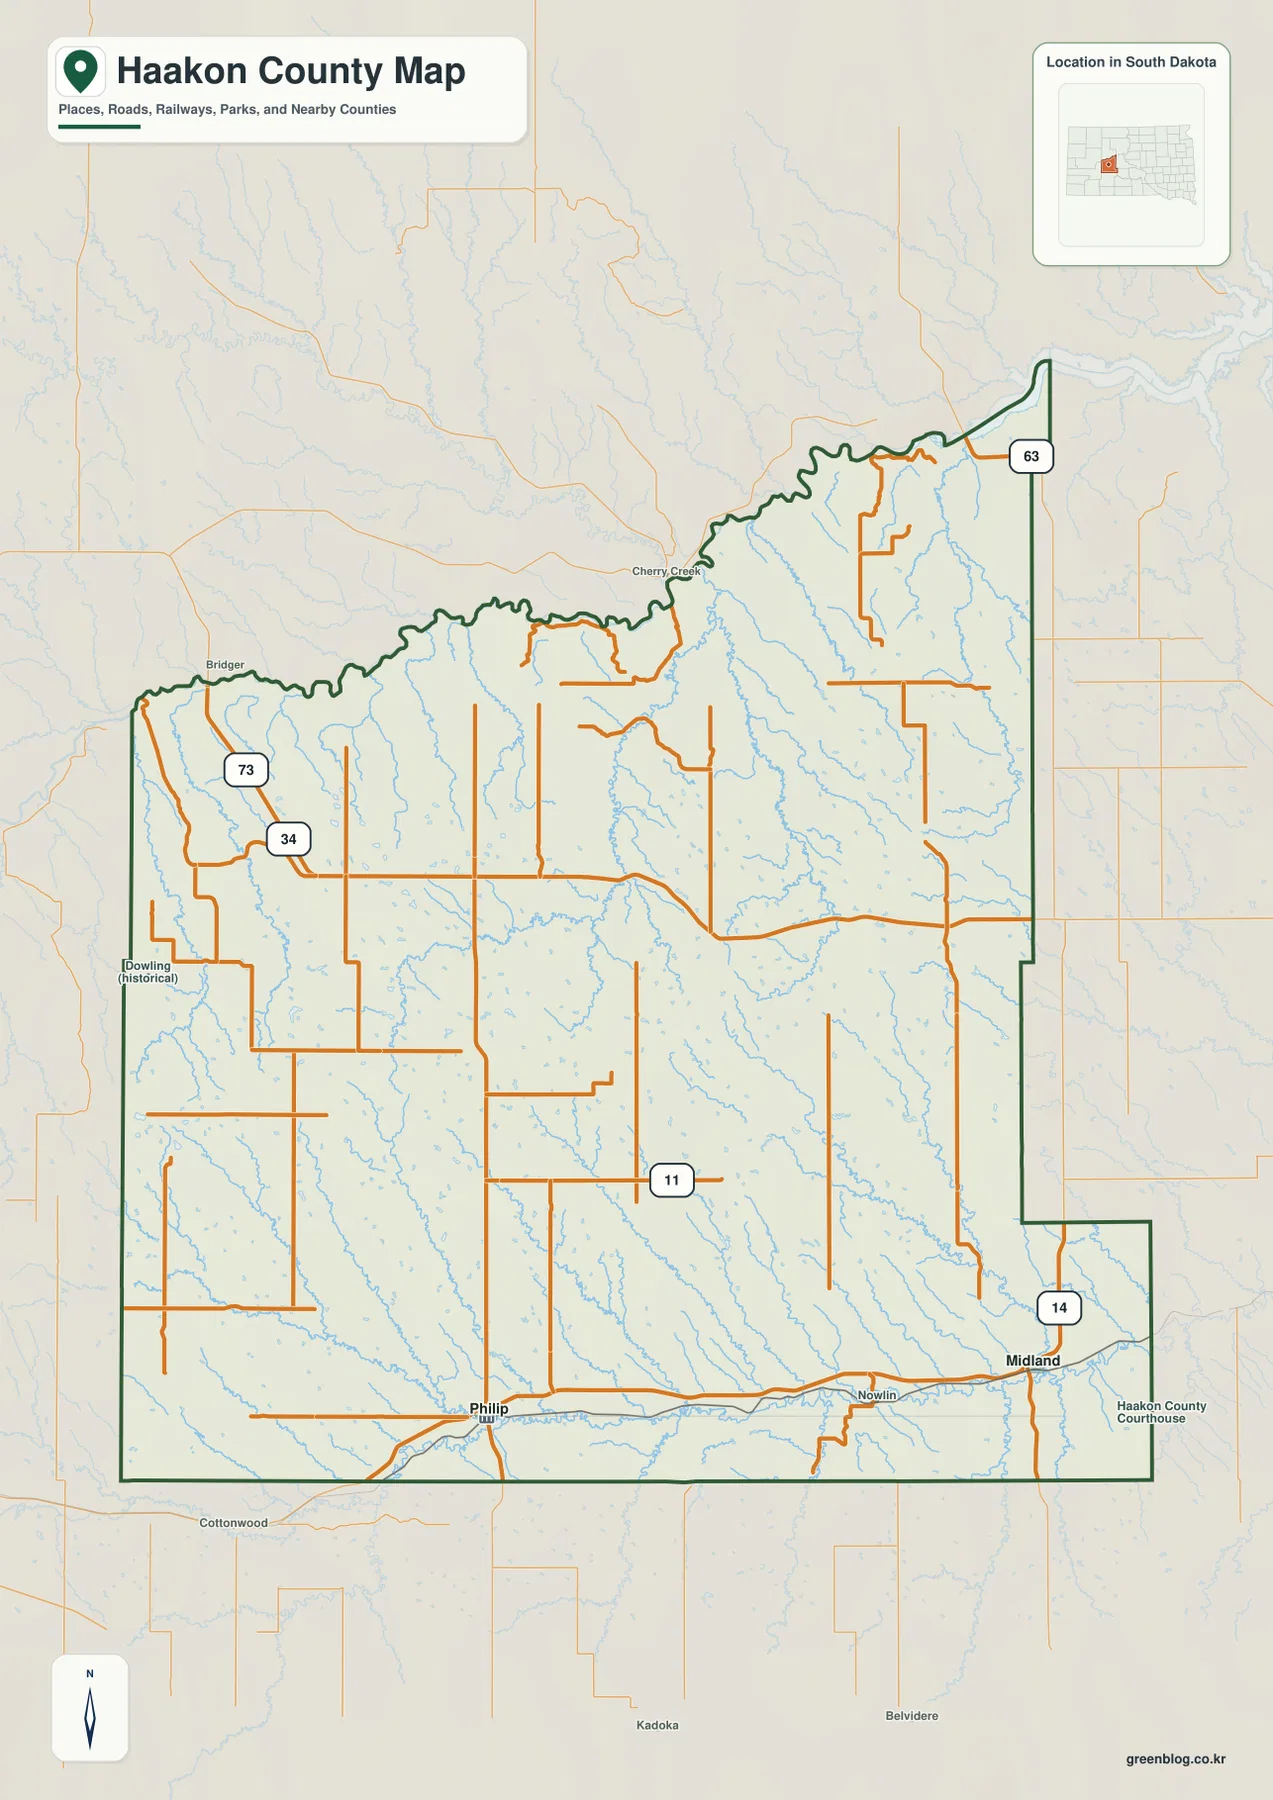
The northern boundary is worth following before moving to the other layers. It rises and falls in a series of bends, then extends into the northeast where the county becomes narrower. That shape is echoed by the drainage pattern, with many short tributaries descending from the interior toward lower valleys. Keeping the outline in mind prevents a creek or road near the edge from being mistaken for a feature outside Haakon County when the simpler water or elevation map is viewed next.
The ranked community map strips the county down to Philip and Midland
The city-distribution map deliberately removes most of the smaller place labels and highlights only two ranked communities. Philip is first and appears near the south-central part of the county; Midland is second and sits close to the southeast. The distance between them on the page is visually important because it shows that the two highlighted settlements are spread along the southern side rather than grouped near one county center.
No connector line or mileage number is drawn between Philip and Midland on this map. It should therefore be used for relative placement, not for estimating driving distance, straight-line distance, or travel time. Labels around the outside identify neighboring counties such as Pennington, Jackson, Dewey, Ziebach, Stanley, and Jones. Those names provide broad orientation, but the purpose of the map remains simple: show where the two highlighted communities fall inside the county outline.
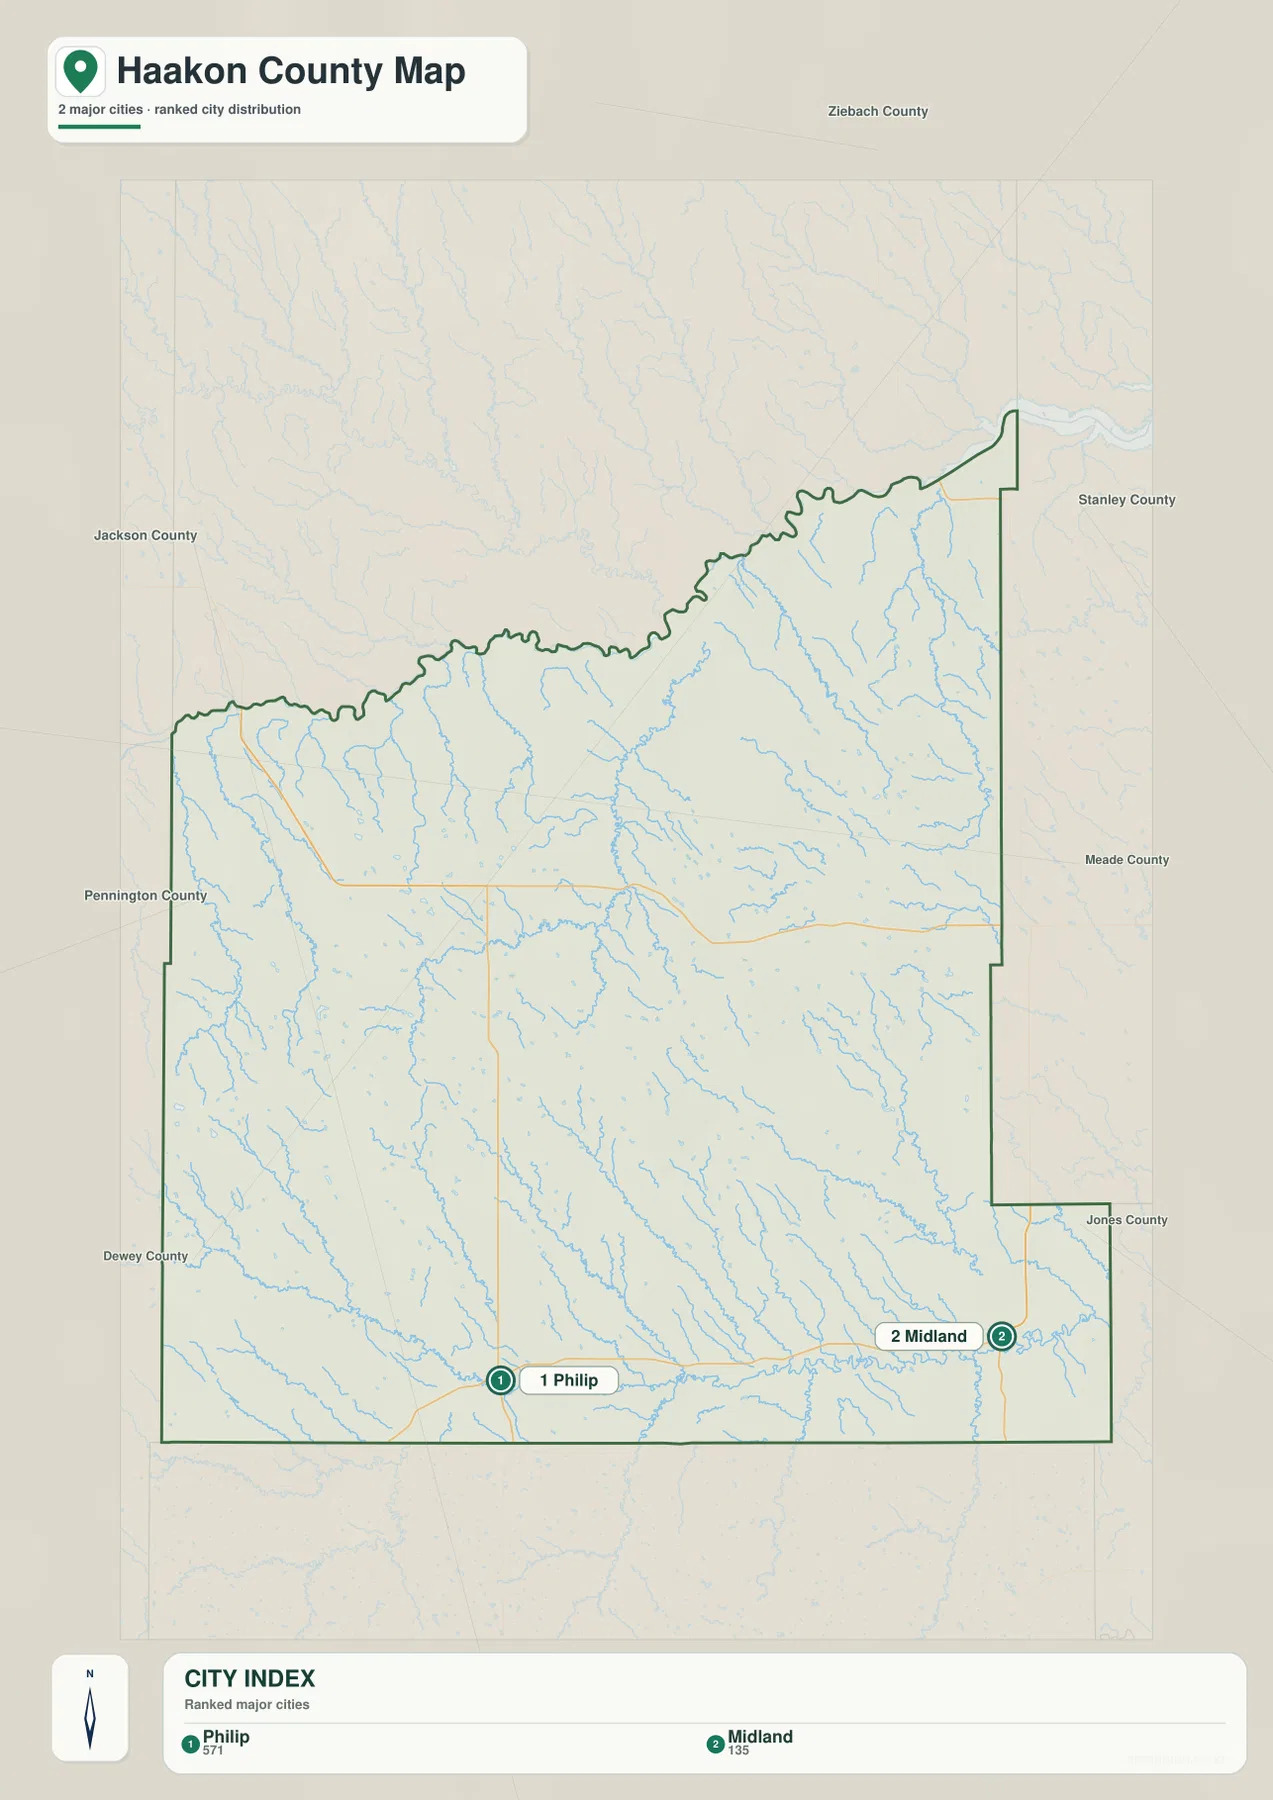
Because the community layer is so spare, it works well as a reference for the other maps. Philip can be carried over to the southern road and Bad River area, while Midland can be matched with Midland Creek and the lower southeastern terrain. The map is less useful for locating every settlement than the general map, but it is better for remembering the broad west-to-east separation of the county’s two highlighted communities.
Bad River forms the southern drainage spine, with Plum Creek cutting the interior
The terrain-and-water map changes the character of the county. Bad River is the dominant named channel across the south, with North Fork Bad River and South Fork Bad River entering from the southwestern side. The main river then continues eastward through the lower southern corridor. This makes a useful contrast with the road map: Philip and Midland sit in the same broad southern zone, but the water layer reveals the branching valleys and tributaries that the road layer only hints at.
Farther north, West Plum Creek and Plum Creek run through the interior, while Midland Creek occupies the southeast. Bridger Creek and Ash Creek appear in the west, and the Cheyenne River label is visible toward the northwest and northern side. The map also shows a dense background of smaller unnamed streams. Rather than draining through a single central river, Haakon County is divided into several systems that descend from higher ground into the Bad River, Cheyenne River, and associated tributary valleys.
Several small lakes provide useful landmarks. Kroetch Lake lies in the west-central part of the county, Ottumwa Lake is farther east, and Waggoner Lake and Sunshine Lake sit near the southern drainage network. These water bodies are not large enough to dominate the county map, yet they help tie local relief to named places. Comparing Kroetch Lake with nearby tributaries, or Ottumwa Lake with Midland Creek, makes the interior drainage easier to follow.
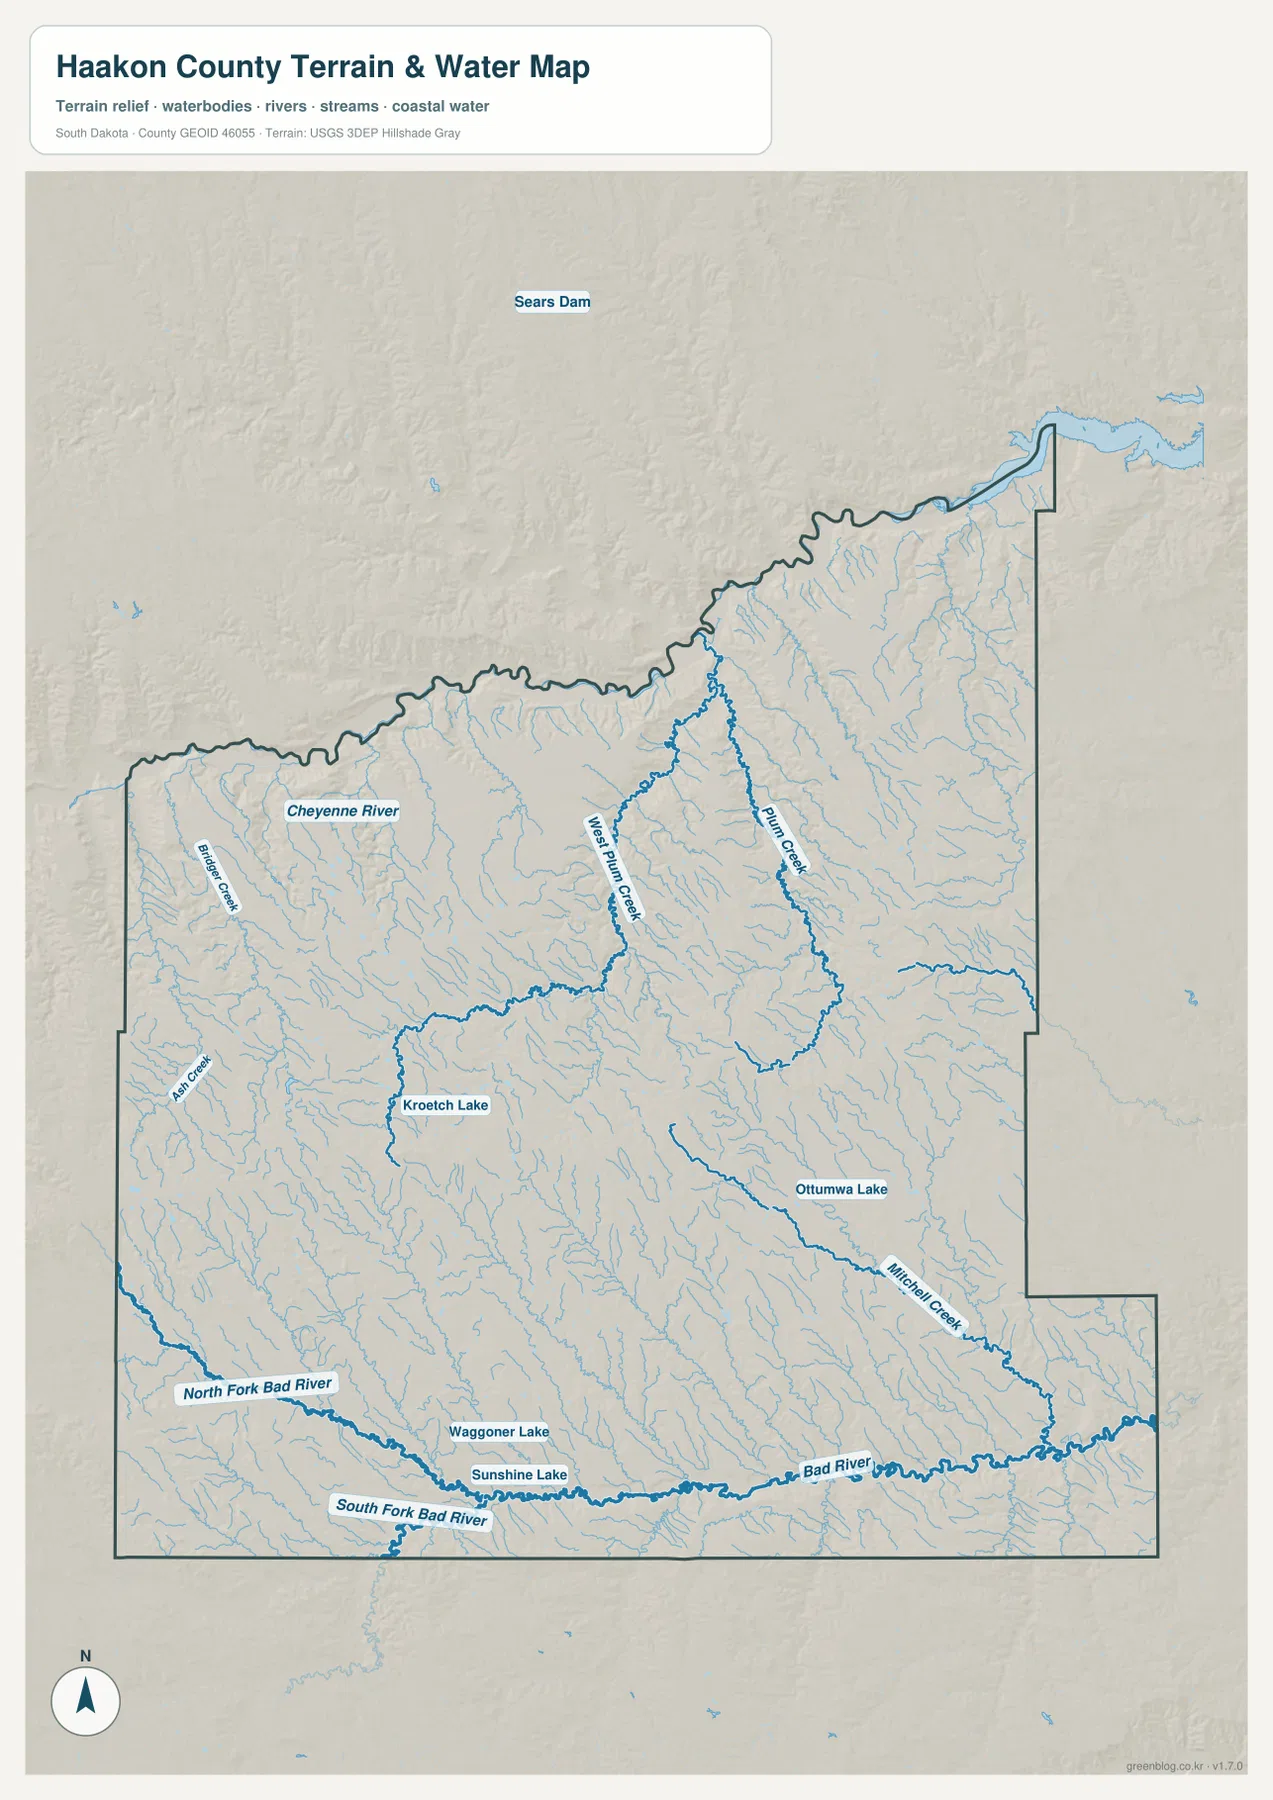
This is a geographic reference map, not a flood-hazard, navigation, parcel, or legal-boundary product. It shows the names and relative positions of waterways visible in the supplied image, but it does not provide flood probability, water depth, channel condition, or ownership information. For current detailed hydrography, USGS National Hydrography is the appropriate official source to consult alongside this overview.
The southwest rises above deeply cut river and creek valleys
The elevation map makes the southwest stand out immediately. Dark brown and brown terrain covers a broad area there, while tan and yellow surfaces extend into the central interior. The legend reports an actual elevation range of about 483 to 860 meters, with a mean around 697 meters. Green lowlands appear along many drainage lines and become especially visible toward the northern valleys, the east, and the southern Bad River corridor.
The high ground is not a smooth plateau. Long, narrow valleys cut into it from several directions, creating a branched relief pattern. When those low strips are compared with the water map, many line up with Bridger Creek, Ash Creek, the Bad River forks, West Plum Creek, Plum Creek, and smaller tributaries. The result is a county where local elevation can change quickly across a short horizontal distance even though the broad regional trend is from higher southwestern uplands into lower river corridors.
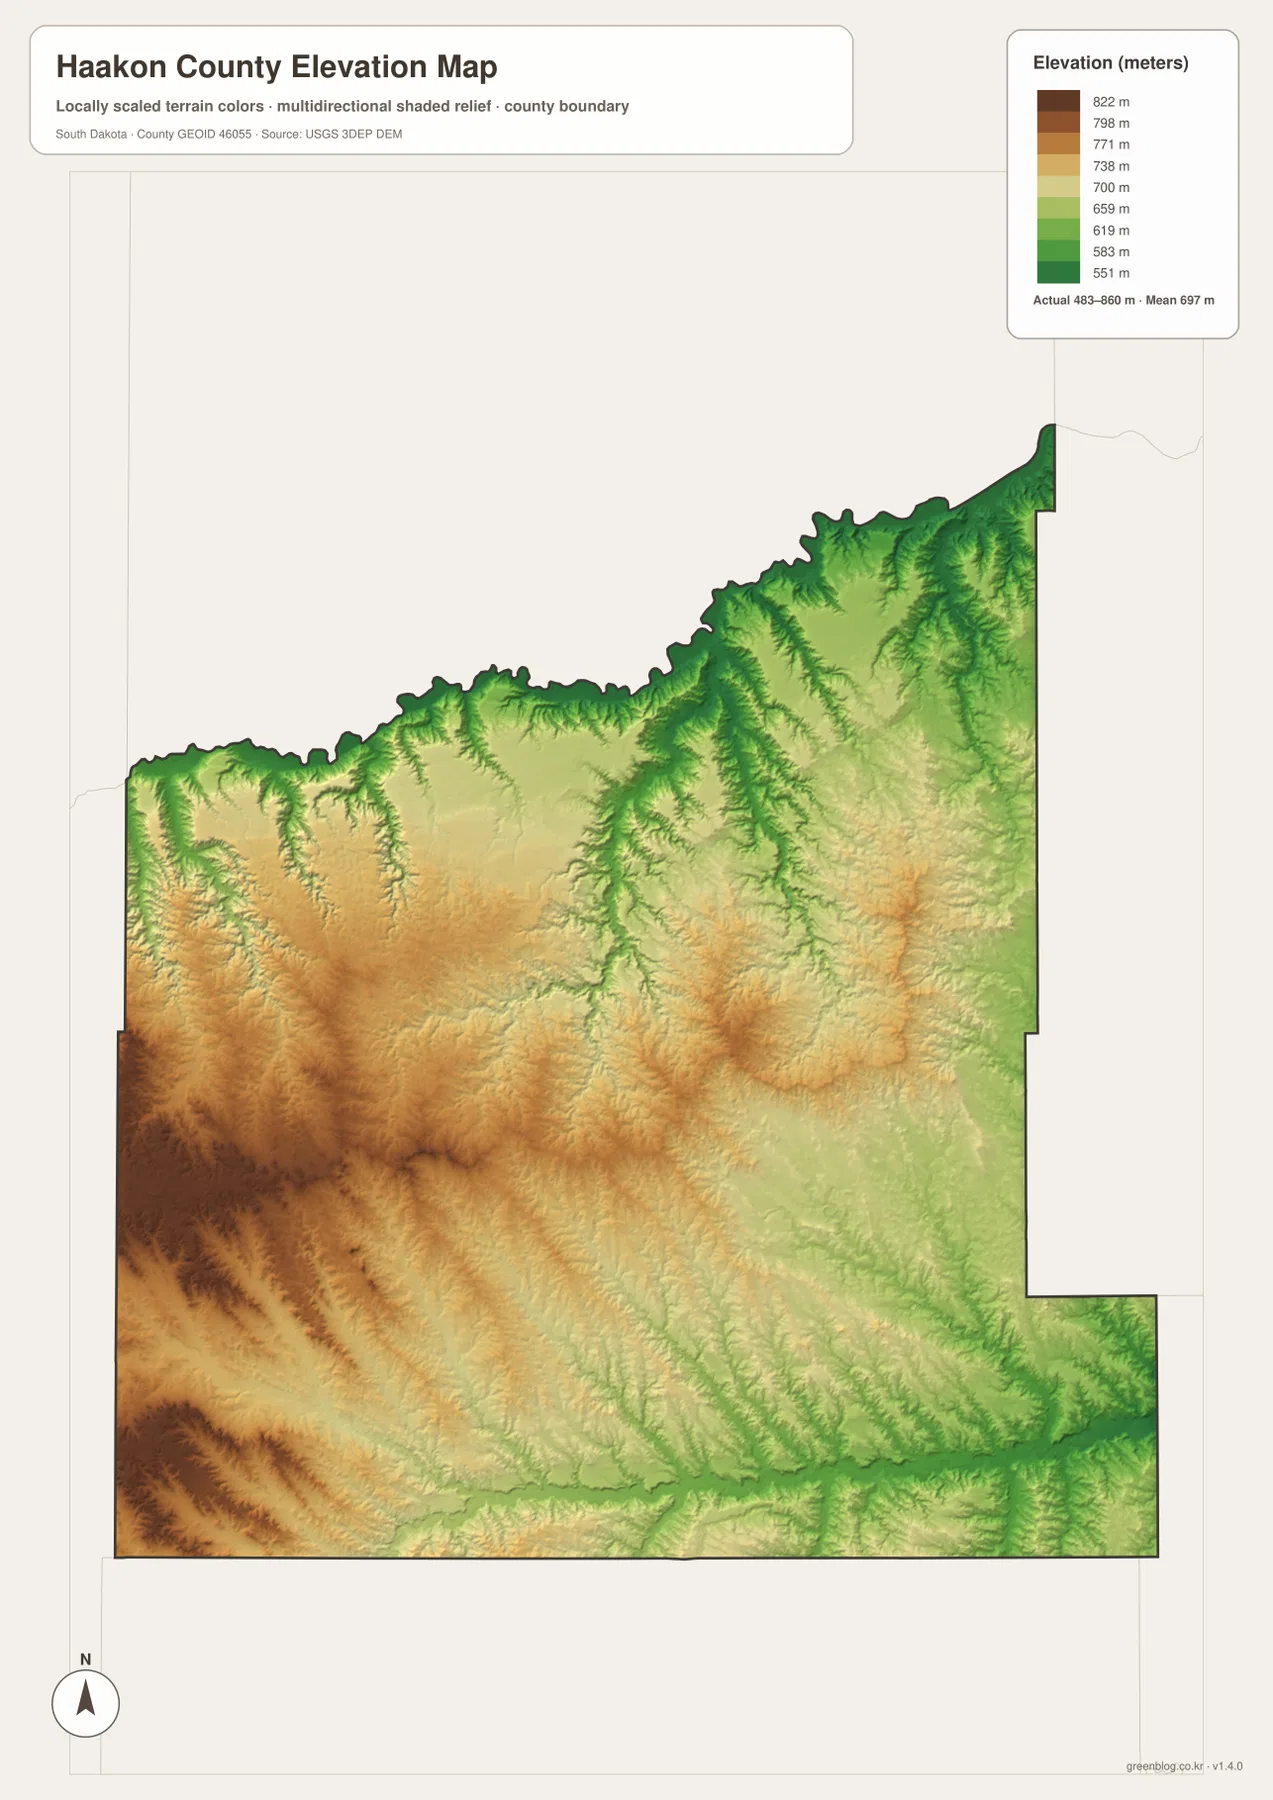
The color scale is intended for county-level comparison, not survey-grade measurement. It is useful for seeing which parts of Haakon County are broadly higher or lower and for recognizing major valleys, but it should not be used to determine the precise elevation of a field, road, building, or construction site. USGS 3D Elevation Program data should be used when accurate source elevations or engineering-grade work is required.
Use one landmark across the layers to connect roads, water, and relief
A practical way to compare the four maps is to keep Philip fixed as the first landmark. Find Philip and the southern road corridor on the general map, then note Midland’s direction on the ranked community map. Move to the water layer and locate the Bad River system south of the interior, then finish on the elevation layer by checking how the same southern corridor lies below the broad southwestern uplands. The sequence turns four separate images into one geographic story without requiring specialized GIS software.
If water is the main interest, start with Bad River instead. Trace its southern course, follow the North and South Forks into the southwest, then move north to West Plum Creek and Plum Creek. On the elevation map, those drainage lines correspond to many of the green and light-green valleys. Returning to the general map then shows how numbered roads cross or skirt those lower corridors. For the north, the Cheyenne River label and the winding county boundary provide a different reference than Philip or Midland.
Each map is strongest for a different task. The general map is best for named places, numbered roads, and the county outline. The ranked community map is the quickest way to remember the relative positions of Philip and Midland. The terrain-and-water map is the useful choice for Bad River, Plum Creek, Midland Creek, tributaries, and the small lakes, while the elevation map gives the clearest view of the high southwest and the lower incised valleys. Choosing the layer that matches the question first makes the page easier to use.
Frequently Asked Questions
Where are Philip and Midland on the supplied maps?
Philip is near the south-central part of Haakon County, while Midland is farther east near the southeastern side. The ranked community map highlights only these two places, making their relative position easy to remember. It does not show a connector distance, so road mileage and travel time need to be checked with a separate current road source.
Which waterways are easiest to identify in Haakon County?
Bad River and its North and South Forks dominate the southern part of the water map. West Plum Creek and Plum Creek cross the interior, Midland Creek is labeled in the southeast, and the Cheyenne River name appears toward the northwest and north. Kroetch, Ottumwa, Waggoner, and Sunshine Lakes provide additional reference points inside the county.
What does the elevation map say about the southwest?
The legend gives an actual county range of about 483–860 meters and a mean near 697 meters. The southwest is broadly higher and appears in brown tones, while river and creek valleys are lower and appear green or light green. The surface is appropriate for regional comparison, not precise surveying or engineering measurements.
Map File Information
The ZIP contains the original JPG versions of the general county map, ranked community map, terrain-and-water map, and elevation map. Use these larger files when the in-article WebP previews are not enough.
- Printable Size: 2572 × 3638 px each
Related Maps
Sources and references
- U.S. Census Bureau TIGER/Line Shapefiles – official geographic data for county boundaries, roads, and related features.
- USGS National Hydrography – official U.S. hydrography information for rivers, streams, and water features.
- USGS 3D Elevation Program – official source information for U.S. elevation data.
- South Dakota Department of Health – Haakon County Register of Deeds – county-specific office information for Haakon County in Philip.
Green Map creates custom-edited map images using open geographic data sources such as geoBoundaries, Natural Earth, OpenStreetMap, and government open data.
These maps are edited visual materials, not raw data files, and are provided for education, documents, presentations, and graphic reference.