Suffolk County changes character markedly from west to east, and the 2025 land-cover data make that contrast easy to see. Developed cover dominates the county summary at 51.48 percent, yet broad forest occupies the center, agriculture becomes much more visible toward the East End, and water frames a large share of the mapped county extent. The four maps on this page separate those themes so a dense western neighborhood, a forested central tract, an eastern farm area, and a coastal wetland do not get reduced to a single countywide percentage.
The web images are intended for quick viewing. A ZIP containing the four original JPG maps is available farther down the page for printing, lessons, presentations, and side-by-side comparison. Land cover describes what is physically covering the surface—such as forest, cultivated ground, water, wetlands, or developed surfaces. It does not establish zoning, ownership, parcel boundaries, building rights, or the legal boundary of a regulated wetland.
Table of Contents
Why Suffolk’s land-cover pattern changes from west to east
Suffolk is long and narrow, so a county average hides strong geographic differences. The western portion is dominated by developed cover, with red areas joining into a broad and nearly continuous pattern. Moving east, that continuity weakens as larger forest blocks appear. Farther toward the two forks, agriculture, forest, wetlands, and water become much more prominent. Keeping this west-to-east sequence in mind provides a useful framework for every map that follows.
Coastal geography is just as important as the land pattern. Suffolk County environmental planning materials identify Long Island Sound, the Peconic Bay System, and the South Shore Bays as major estuarine settings. Those names help explain why water, wetlands, shorelines, and separated land masses are so visually important here. The land-cover product does not draw management boundaries for those estuaries, but the large water areas make excellent orientation points when matching the same location across all four maps.
Central Suffolk introduces another distinctive feature: a large concentration of forest. County open-space materials specifically identify the Pine Barrens as an important ecological resource and describe preservation efforts involving forests, wetlands, river corridors, shorelines, and farmland. The forest visible on this map should not be treated as the legal Pine Barrens boundary, however. Green cells indicate forest cover, not ownership, protected status, public access, or conservation designation.
The 2025 land-cover map: development leads, but water matters
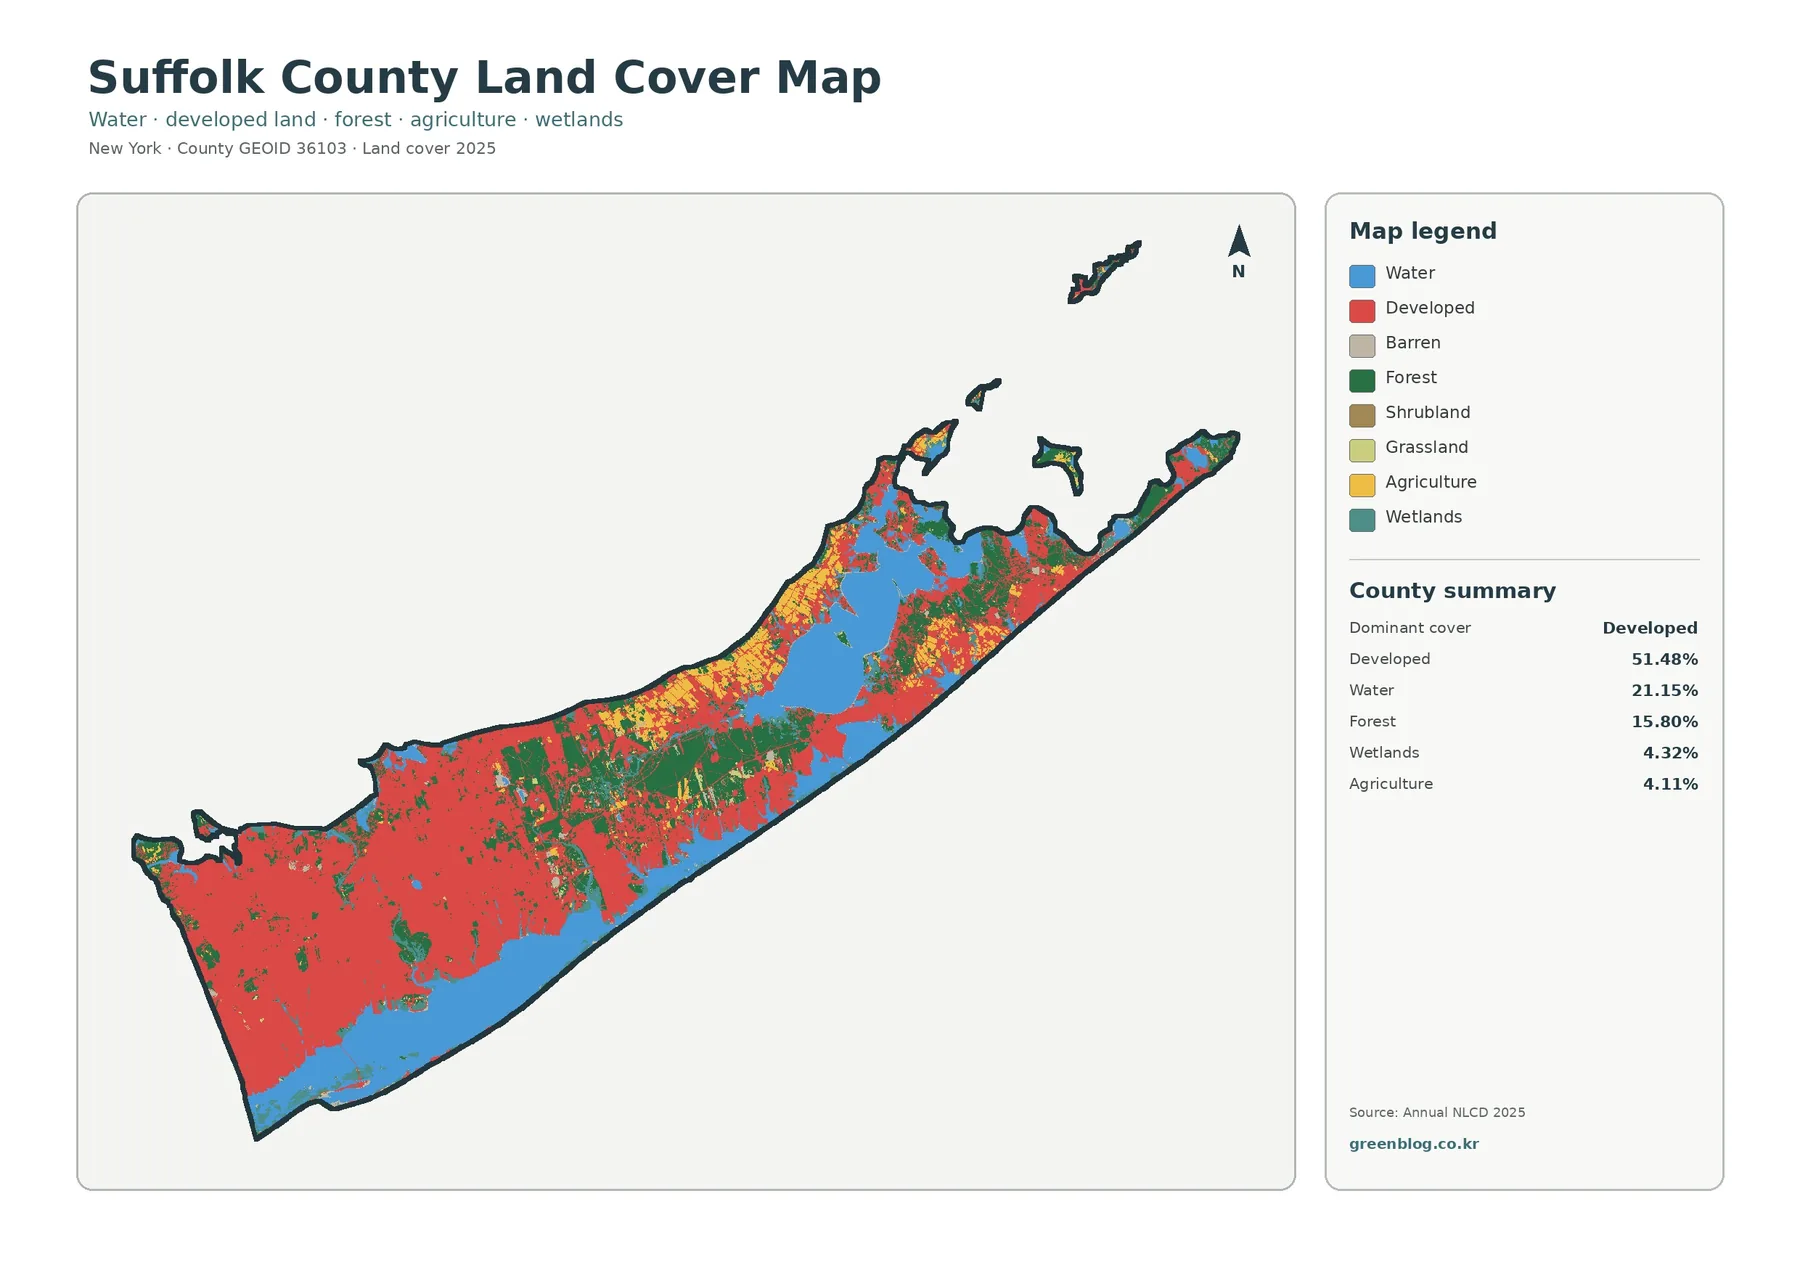
The county summary lists developed cover at 51.48 percent, the largest category. Its location is not uniform. The western half contains the most continuous red pattern, while central and eastern Suffolk break into smaller developed clusters separated by forest, agriculture, wetland, and water. This is why the map is more informative than the percentage alone: it shows where development is concentrated and where it gives way to very different surface conditions.
Water accounts for 21.15 percent of the mapped county extent. That large number reflects Suffolk’s coastal setting and the amount of open water contained within the mapped boundary. It should not be described as 21.15 percent of the county’s dry land being converted to water. On the map, blue surfaces border much of the county and occupy broad bays and channels, especially toward the east. Water also serves as a stable visual landmark for comparing the other themes.
Forest represents 15.80 percent. Although it is far below the developed percentage, it appears as a large, coherent presence in central Suffolk and in additional eastern patches. This concentration makes forest important to the county’s visual pattern even when its countywide share is smaller. The map does not distinguish forest type, stand age, public ownership, or management status, so those questions require separate forestry or conservation data.
Wetlands account for 4.32 percent and agriculture for 4.11 percent. Both are spatially concentrated rather than evenly distributed. Agricultural colors are easiest to pick out in the eastern part of the county, while wetlands repeatedly appear near coastal water and other low-lying environments. Because these classes can occur in narrow or irregular shapes, their distribution can matter more than the countywide total when the goal is to understand habitat, farming landscapes, or shoreline conditions.
The legend also contains barren, shrubland, and grassland classes. The forest-and-farmland summary reports grassland at 0.80 percent and shrubland at 0.16 percent. These smaller categories are useful for close inspection, but they should not distract from the major pattern. For a first reading, identify western development, central forest, eastern agriculture, and the water-wetland edge; then use the legend to inspect the smaller classes.
Forest and farmland reveal the center and East End more clearly
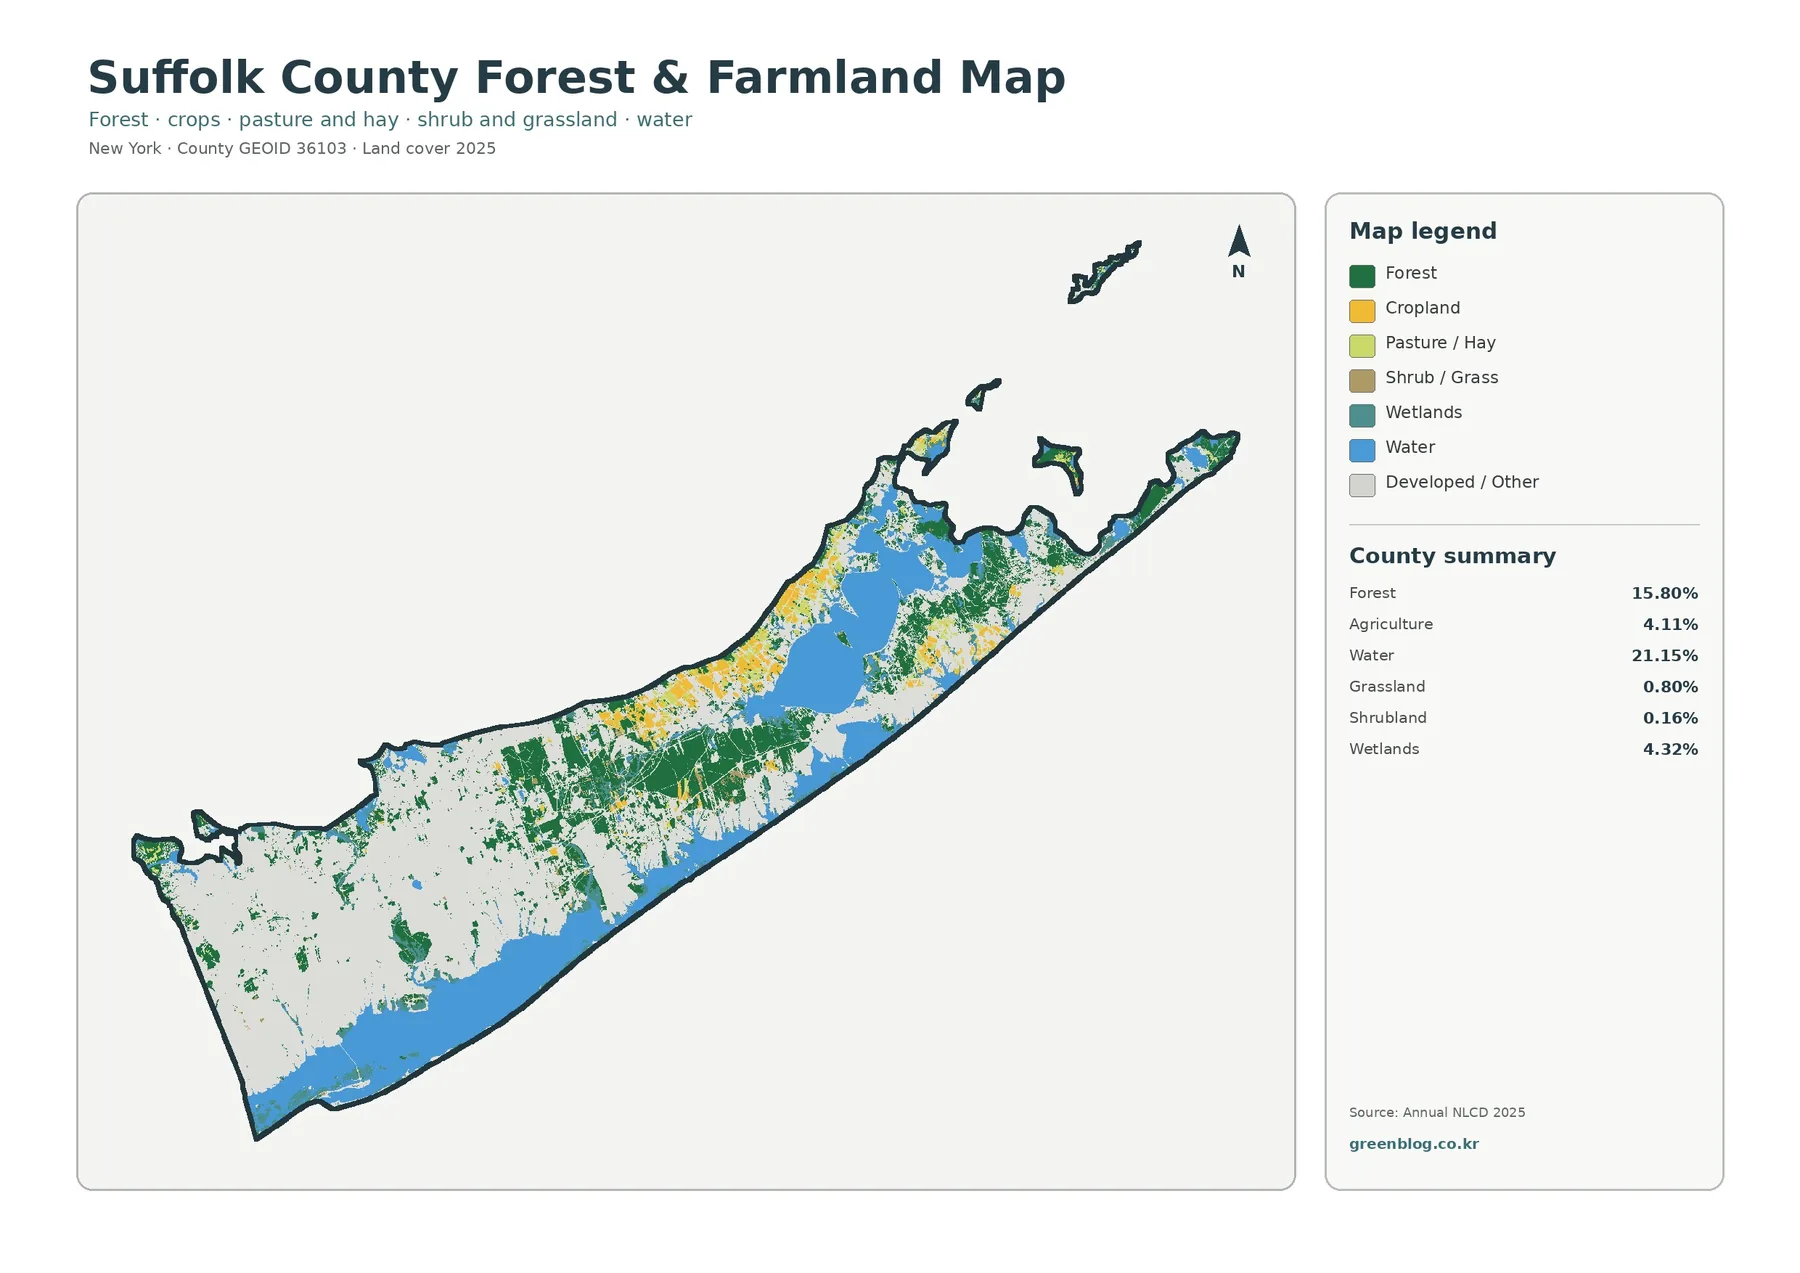
Removing most developed detail from the foreground makes the county’s green and agricultural surfaces easier to compare. The broad central forest stands out immediately. Agricultural areas are much more conspicuous farther east, especially where yellow fields appear in clusters rather than isolated pixels. Western Suffolk becomes comparatively pale because developed and other surfaces dominate there. This simplified view is useful when the question is specifically about remaining forest, farmed ground, wetlands, and open water.
Suffolk County’s farmland-preservation work provides useful context for the eastern agricultural pattern. County planning programs administer farmland preservation and agricultural-district activities, while the open-space program describes the acquisition of development rights on productive farmland. Those programs should not be mapped directly from the yellow land-cover cells. The land-cover product classifies the visible surface; a farmland-preservation or agricultural-district map documents a different legal or policy status.
The same distinction matters for the central forest. A continuous green patch can be used to locate forest cover and to compare it with nearby development, but it cannot tell a reader whether the land is public, preserved, privately owned, or open for recreation. Suffolk’s official open-space information can answer some conservation questions, while park and property records are needed for access and ownership questions.
For teaching, choose one central forest location and one eastern agricultural location, then follow each through the remaining maps. In the central site, look for how little high impervious surface appears inside the forest block and whether any 1985–2025 class differences are present. In the eastern farm area, compare the agricultural cells with nearby developed surfaces, wetlands, and water. Tracking the same locations prevents the maps from becoming four disconnected illustrations.
Water remains a major visual component in this simplified map. The county’s elongated shape, bays, and eastern forks can make orientation difficult when labels are limited, so blue water is a practical reference. Once a bay or shoreline bend is identified, the adjacent forest, farm, or wetland pattern can be located again in the impervious and change maps with much less uncertainty.
Impervious surface separates development from pavement density
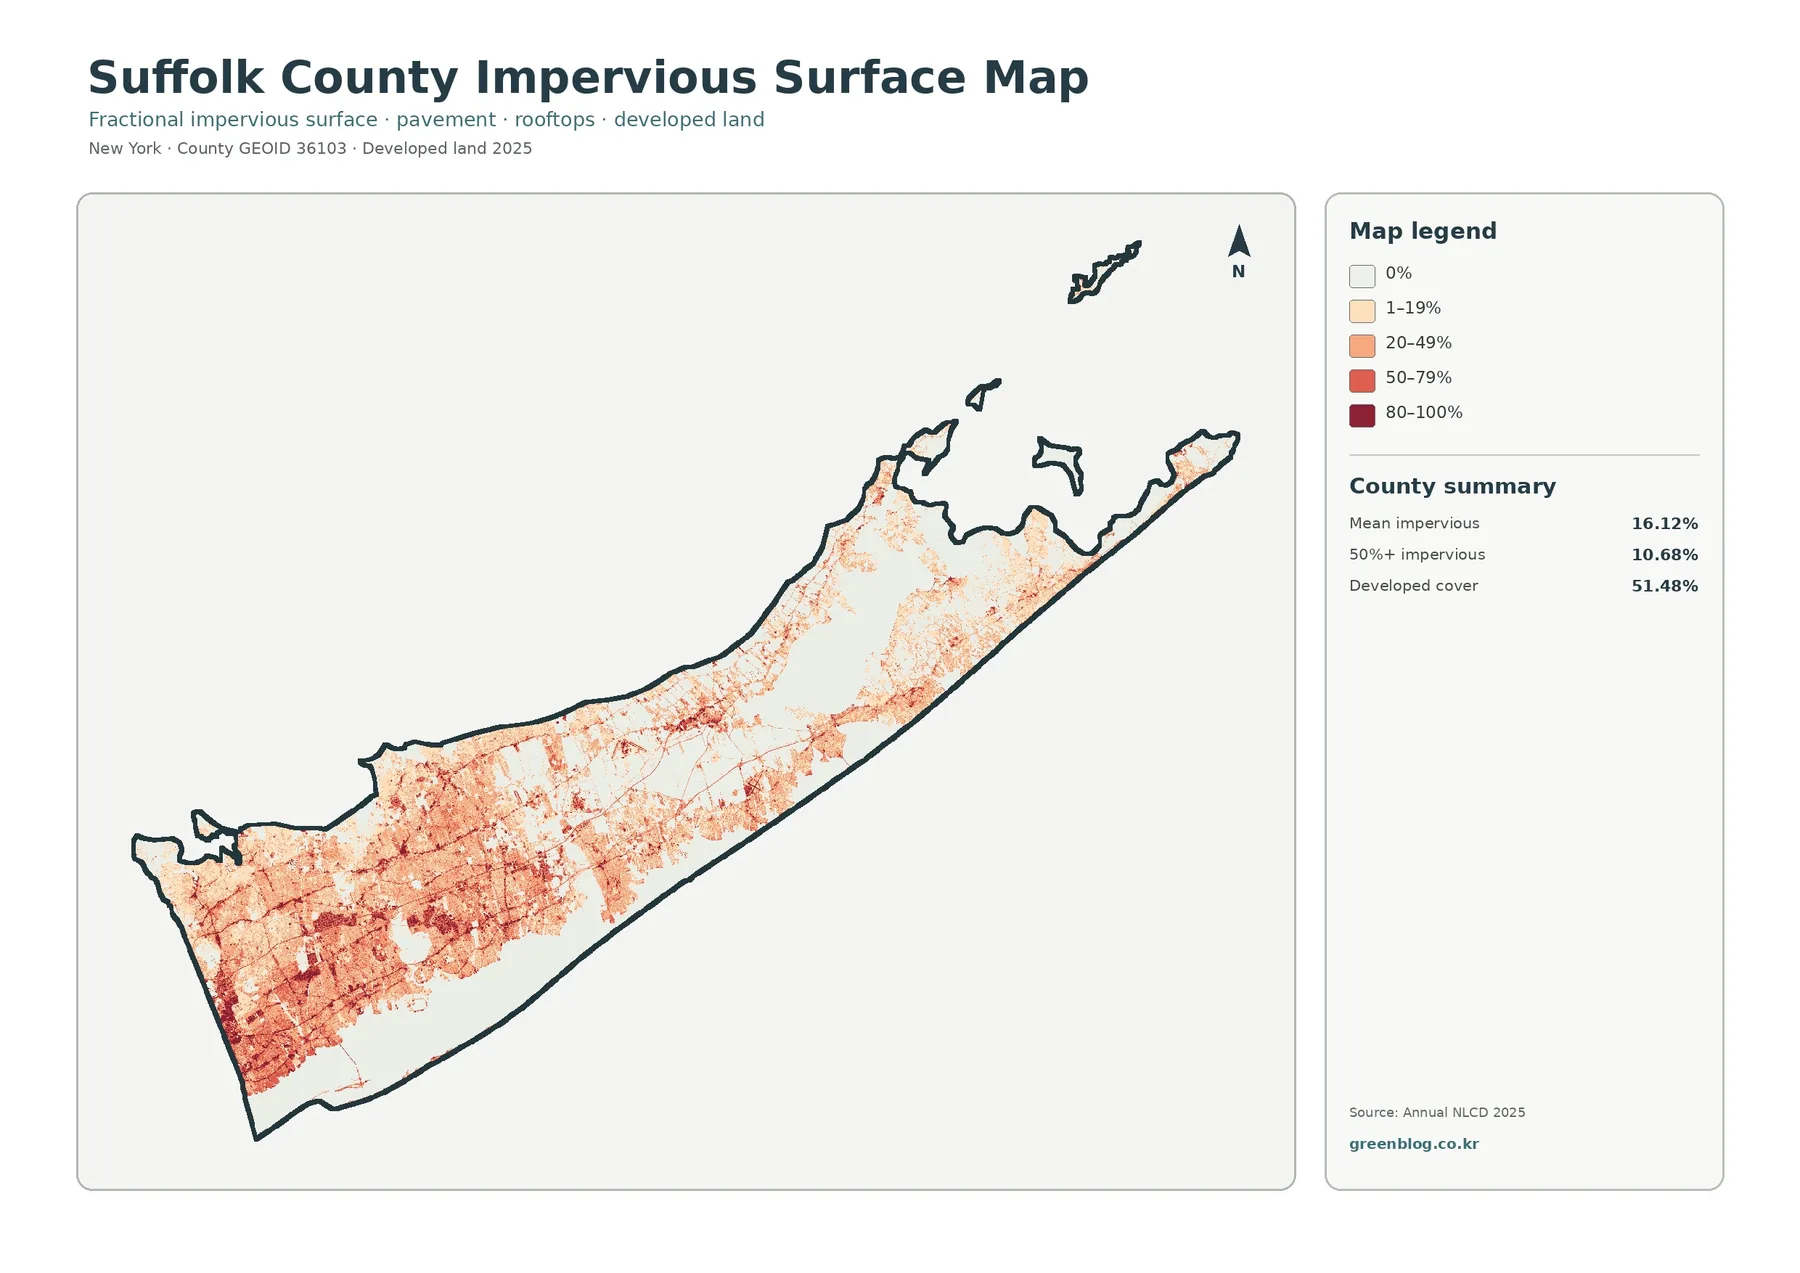
Impervious surface means hard cover such as pavement and rooftops that does not readily absorb rainfall into the soil. Suffolk County’s mean impervious value is 16.12 percent, and 10.68 percent of the mapped area falls in the 50-percent-or-higher impervious category. Those numbers are much lower than the 51.48 percent developed-cover share because “developed” land can still contain lawns, trees, bare soil, and other surfaces that allow water to infiltrate.
The strongest impervious pattern is concentrated in western Suffolk. Darker reds and oranges form broad clusters, and thin linear features create a dense network through the developed area. Central Suffolk contains much larger pale areas, corresponding to the broad forest and less intensely developed surfaces seen on the previous maps. Eastern development appears in smaller centers and corridors rather than the nearly continuous western pattern.
A countywide mean should never be read as a local condition. A 16.12 percent average combines intensely built western areas with lightly covered forests, farms, wetlands, and open water. The 10.68 percent figure for areas at or above 50 percent imperviousness adds another useful perspective, but it also needs the map. Without location, either statistic can give a distorted impression of how evenly hard surfaces are distributed.
Impervious data are useful in discussions of runoff and watershed conditions, but this is not a flood-risk or water-quality model. Rainfall, slope, soils, drainage infrastructure, groundwater, shoreline conditions, and the position of streams or wetlands all affect what happens after rain falls. In a coastal county with numerous bays and estuaries, pairing impervious cover with hydrologic and water-quality information is especially important before drawing environmental conclusions.
Some narrow dark features resemble roads, but the map cannot identify road names, lane counts, traffic volume, or pavement condition. The values are summarized in raster cells, so a narrow road can share a cell with vegetation or nearby buildings. Use a transportation map when the road network itself is the subject; use this map when the question is how much hard surface occupies an area.
What the 1985–2025 comparison actually measures
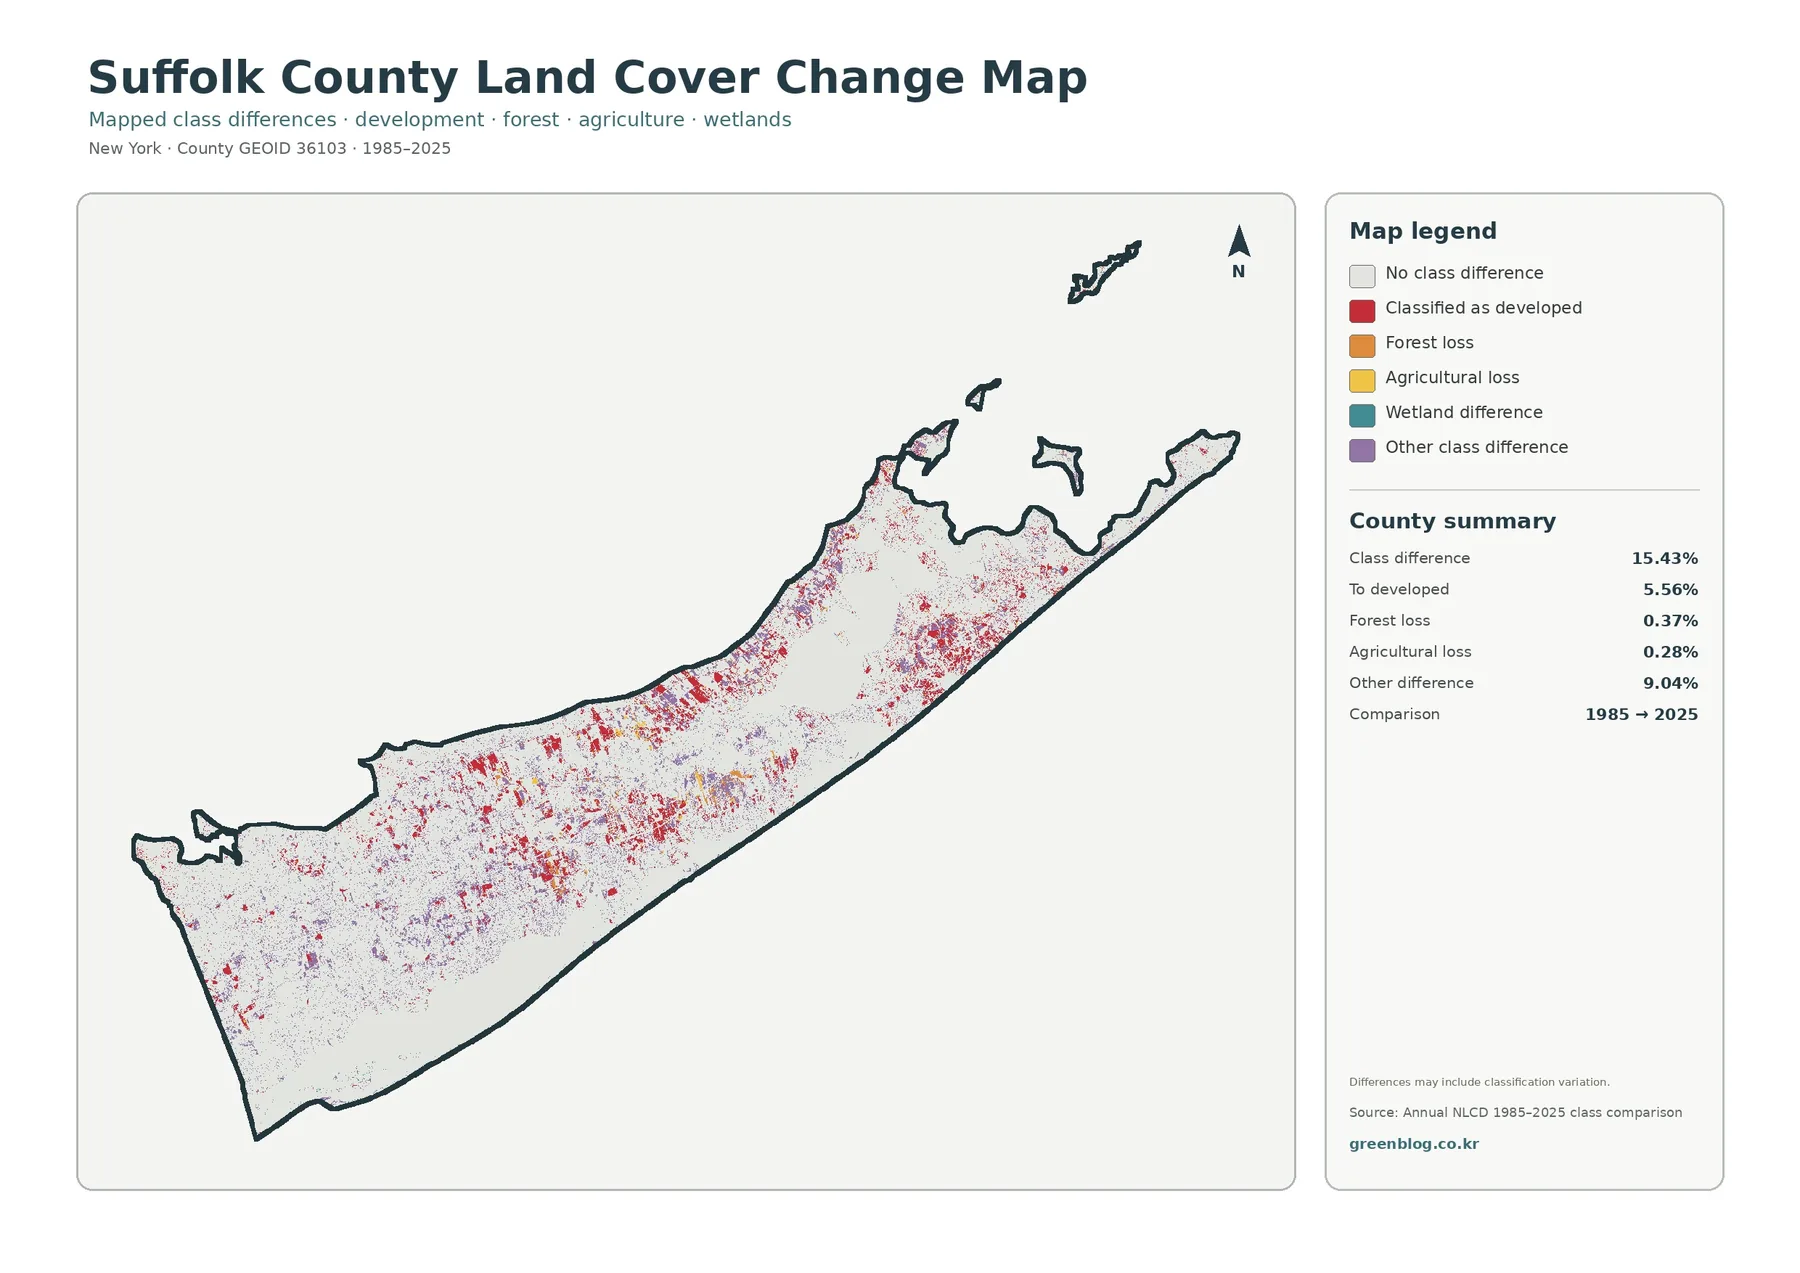
The comparison map reports a total class difference of 15.43 percent between 1985 and 2025. Within that total, 5.56 percent is classified as change to developed, 0.37 percent as forest loss, 0.28 percent as agricultural loss, and 9.04 percent as other class difference. Wetland difference appears as a legend category, but the summary panel does not provide its own percentage. No additional value should be invented from the image.
The largest component is the 9.04 percent “other class difference” category. That fact is essential because it prevents the 15.43 percent total from being mislabeled as development growth. Red change-to-developed cells are visible in many places, yet purple and other difference colors are also widespread. The note on the map warns that mapped differences can include classification variation, so the product is best treated as a comparison of class labels at two dates rather than a complete record of land-use history.
The 5.56 percent change-to-developed value also should not be confused with the current 51.48 percent developed-cover share. One describes the 2025 condition; the other identifies cells whose comparison category moved to developed between the two endpoints. Much of today’s developed land may already have been developed in 1985 and therefore would not appear as a new change in this comparison.
Forest loss at 0.37 percent and agricultural loss at 0.28 percent occur as scattered pieces rather than one single countywide block. A colored cell does not reveal why a change occurred. Construction, vegetation succession, clearing, farm conversion, storm effects, or classification differences are possible explanations in different places, but the map itself cannot choose among them. Intermediate-year data, historical aerial imagery, and local records are needed for cause-and-effect questions.
A good workflow starts with the current land-cover map. Locate the place of interest and identify its 2025 surface. Use the forest/farmland or impervious map to refine the present-day description, and only then look at the change map. This sequence keeps three visually similar red concepts separate: current developed cover, high impervious percentage, and a cell classified as changing to developed.
Endpoint comparison also hides events that happened in between. A cell could change after 1985 and return to its original class by 2025, leaving no endpoint difference. Border cells can also switch categories because they contain a mixture of surfaces. The map is therefore well suited to screening and regional comparison, but a site-specific history needs a time series rather than two dates alone.
Using shoreline and bays as orientation across all four maps
Suffolk’s coastline can be used as a practical indexing system. Start with a recognizable bay, shoreline bend, or one of the eastern forks. Find the adjacent land-cover colors, then move to the forest/farmland map to isolate vegetation and agriculture. Check the impervious map for hard-surface intensity in the same place, and finish with the 1985–2025 comparison. The sequence works especially well where developed land, wetlands, and water sit close together.
County environmental planning explicitly works with Long Island Sound, the Peconic Bay System, and the South Shore Bays, along with harbors, watersheds, flooding, erosion, wetlands, and coastal resources. That official context reinforces the importance of the blue and wetland-colored portions of the maps. It does not mean the land-cover product can replace detailed coastal-management, flood, or wetland-regulation maps.
Spatial proximity should not be turned into causation. If developed cover and a wetland appear beside each other, the map supports saying that they are adjacent. It does not prove that development caused a particular wetland change. The same caution applies when a red change cell appears near a road or shoreline. Cause requires additional evidence from dates, permits, imagery, hydrology, or field records.
Choosing and downloading the four original JPG maps
The download contains one JPG for each theme: overall 2025 land cover, forest and farmland, impervious/developed land, and the 1985–2025 class comparison. The files are useful when a map needs to be placed into a lesson, printed reference sheet, presentation, draft report, or county-comparison project. Each image includes its title, legend, and summary panel, which helps preserve meaning when the file is viewed outside this article.
Choose the overall map for a broad description of Suffolk in 2025. Use the forest/farmland version when central forest and East End agriculture are the main subject. Select the impervious map for questions about pavement and rooftop intensity inside developed areas. Reserve the comparison map for questions involving the two endpoint years. Matching the map to the question keeps the legend simple and avoids forcing unrelated indicators into one explanation.
When cropping or reusing a map, keep the year and legend visible whenever possible. The current land-cover and impervious products are labeled 2025, while the comparison spans 1985 to 2025. If the legend disappears, a red area can easily be mistaken for current developed land when it actually represents high imperviousness or a change-to-developed category. A short caption naming the theme and year prevents most of that confusion.
The original JPG dimensions are those supplied in the package. Do not assume that a file automatically meets a particular print standard simply because it is larger than the web preview. For a large print, check the actual dimensions, output size, and legend readability before final production. The web images are best for fast browsing; use the downloaded originals when layout or print quality matters.
Limits that matter when reading county-scale land cover
Annual NLCD products are raster data. A raster divides the surface into a grid and assigns a class or numeric value to each cell. Where forest, yards, roads, buildings, wetlands, and shorelines meet, one cell can contain a mixture of real surfaces. The class boundary on the map is therefore a generalized analytical boundary, not a surveyed parcel line.
County summaries are averages across the mapped extent. Developed cover at 51.48 percent does not mean every community is half developed, just as forest at 15.80 percent does not mean every neighborhood has the same amount of tree cover. The western built-up pattern, central forest, eastern farms, and coastal water make Suffolk a strong example of why percentages should always be paired with a map of location.
The year matters as well. A 2025 classification cannot capture construction, vegetation change, farming changes, or shoreline conditions that occur afterward. For a current parcel or project, review newer aerial imagery and the responsible local or state datasets. County-scale land cover is excellent for regional context, education, and preliminary comparison, but it is not a substitute for current site inspection.
Finally, the classes do not define legal land use. Green forest is not automatically parkland or protected Pine Barrens. Yellow agriculture is not an agricultural-district boundary. Red developed cover does not identify residential, commercial, or industrial zoning. Treat the maps as a clear view of surface cover, then move to purpose-specific official records when the question becomes legal, regulatory, or parcel-specific.
Frequently Asked Questions
What is the dominant 2025 land-cover category in Suffolk County?
Developed cover is the largest category at 51.48 percent. Water is 21.15 percent, forest 15.80 percent, wetlands 4.32 percent, and agriculture 4.11 percent. Those county totals should be read with the map because development is much more concentrated in the west, while central forest, eastern agriculture, and coastal water create very different local patterns.
Why is developed cover 51.48 percent while mean imperviousness is 16.12 percent?
They measure different things. Developed cover classifies a broader developed landscape, which can include lawns, trees, and other permeable surfaces. Imperviousness estimates the share of hard surface such as pavement and rooftops within each cell. In Suffolk, areas at or above 50 percent imperviousness account for 10.68 percent of the mapped extent.
Does the 15.43 percent 1985–2025 difference mean that much of the county was developed?
No. Change to developed is 5.56 percent. The map also reports forest loss at 0.37 percent, agricultural loss at 0.28 percent, and other class difference at 9.04 percent, with wetland difference shown as another legend category. The total combines several types of class difference and can include classification variation, so it should not be described as a single development rate.
Map File Information
The ZIP contains four original JPG maps for Suffolk County: 2025 land cover, forest and farmland, impervious/developed land, and the 1985–2025 land-cover comparison.
- Included Files: Land cover, forest & farmland, impervious/developed land, and land cover change maps
- File Type: ZIP containing four original JPG maps
- Intended Use: Printing, teaching, presentations, environmental study, county comparison, and map reference
Related Maps
- Albany County Land Cover Map
- Allegany County New York Land Cover Map
- Bronx County New York Land Cover Map
Sources and references
Map percentages and legends in this article follow the supplied 2025 Annual NLCD-based maps and the 1985–2025 comparison summary. County-specific coastal, open-space, Pine Barrens, and farmland context is supported by Suffolk County planning and environmental pages.
- MRLC Annual NLCD Data – Annual NLCD data and product access
- USGS Annual NLCD Land Cover Classification – land-cover class documentation
- U.S. Census Bureau TIGER/Line Shapefiles – county boundary and reference geography
- Suffolk County Open Space Preservation – official information on open space, Pine Barrens, wetlands, and farmland preservation
- Suffolk County Environmental Planning and Aquaculture – official coastal and estuary planning context for Long Island Sound, Peconic Bay, and South Shore Bays
The county planning links provide geographic and policy context; they do not convert the land-cover classes into regulatory or ownership boundaries. For legal, permitting, parcel, wetland-jurisdiction, or current site questions, use the responsible agency’s purpose-specific records and the most recent available information.
Green Map creates custom-edited map images using open geographic data sources such as geoBoundaries, Natural Earth, OpenStreetMap, and government open data.
These maps are edited visual materials, not raw data files, and are provided for education, documents, presentations, and graphic reference.