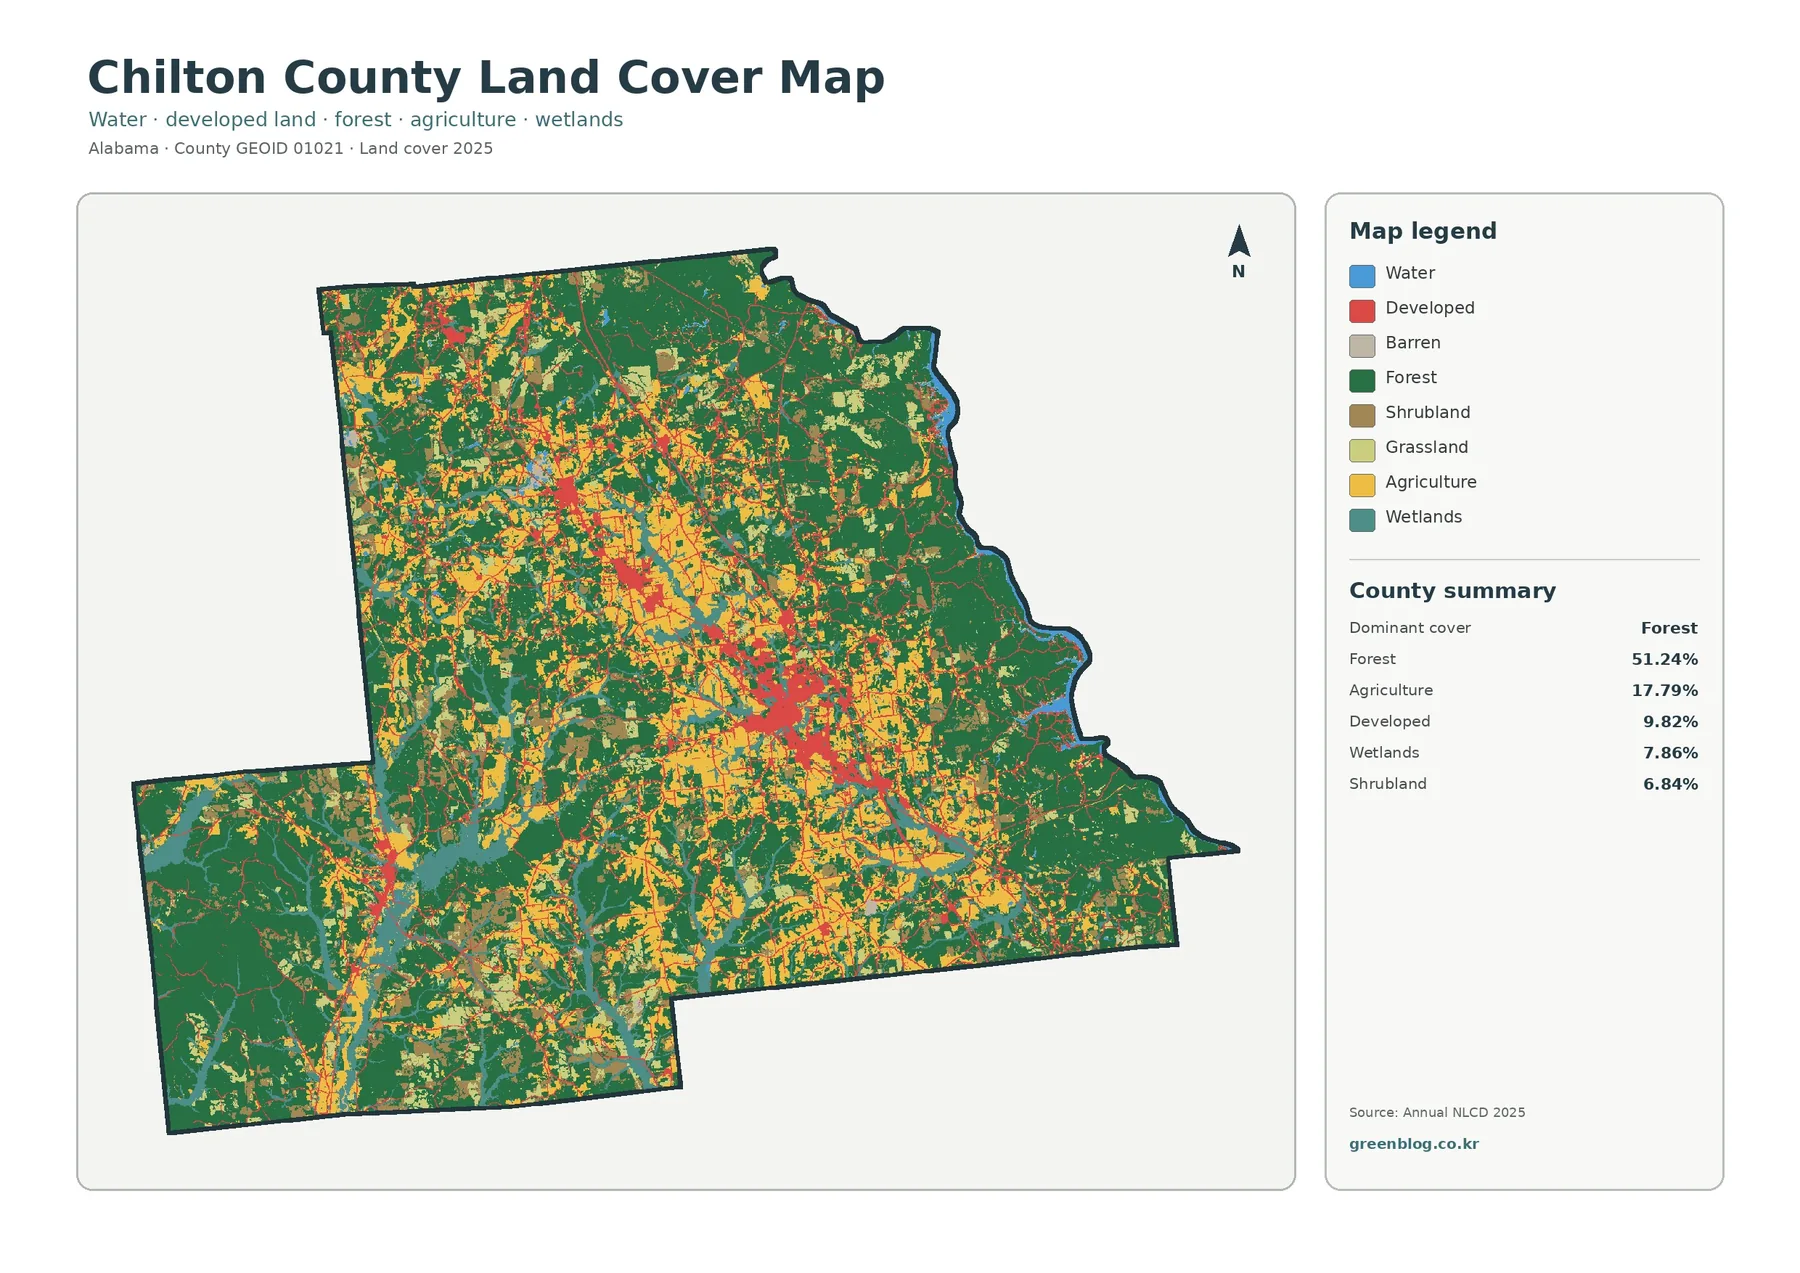
Chilton County’s 2025 land-cover map is dominated by forest, but the county is not a single continuous block of woodland. Forest accounts for 51.24% of the mapped area, agriculture for 17.79%, developed land for 9.82%, wetlands for 7.86%, and shrubland for 6.84%. The broadest forest areas stand out along the east and southwest, while the middle of the county contains a tighter mixture of farms, developed patches, and smaller forest blocks. That contrast gives the four maps a useful county-specific pattern to follow.
The page provides four complementary views: general 2025 land cover, forest and farmland, impervious surface and developed land, and a 1985–2025 class comparison. Each map appears as a WebP preview in the article, and the four original JPG maps are available together in one ZIP download. They are useful for classroom work, presentations, preliminary environmental review, and county comparisons, as long as the maps are treated as generalized land-cover references rather than parcel or zoning maps.
Table of Contents
Start with the Clanton–I-65 corridor, then look outward
The clearest developed concentration sits near the center of Chilton County. County offices are based in Clanton, and the Alabama Cooperative Extension System’s Chilton County office is also in Clanton. Local directions published by ACES use Interstate 65 as a main approach, while broader county geography places I-65 on a north–south course through the middle of the county. That context fits the map’s strong central red cluster and its thin north–south developed traces, although the land-cover image itself does not label roads or municipal limits.
Developed land makes up 9.82% of the county. Red cells are most visible in the central area, with smaller clusters and narrow lines extending away from it. These patterns are better described as concentrations that occur in the same general area as established settlements and transportation corridors, not as proof that a particular road caused nearby development. The map records surface cover. It does not measure traffic, growth rates, building permits, or population density.
Moving away from the central cluster changes the character of the map quickly. Large green forest blocks become more prominent to the east and southwest, while agriculture appears in yellow patches through much of the central and northwestern interior. Wetland and shrub colors add another layer of variation, especially where forest, open land, and drainage areas meet. The result is a county where the developed center is visually distinct but still surrounded by a broad rural mosaic.
The countywide percentages help establish scale, but location matters just as much. A class that is spread in hundreds of small pieces can look less dramatic than a smaller class concentrated in one recognizable corridor. Chilton County is a good example: developed cover is under one tenth of the county, yet the central cluster is visually strong, while forest is more than half of the county but is divided by farms, roads, wetlands, and other cover in many places.
A forest majority with farmland woven through it
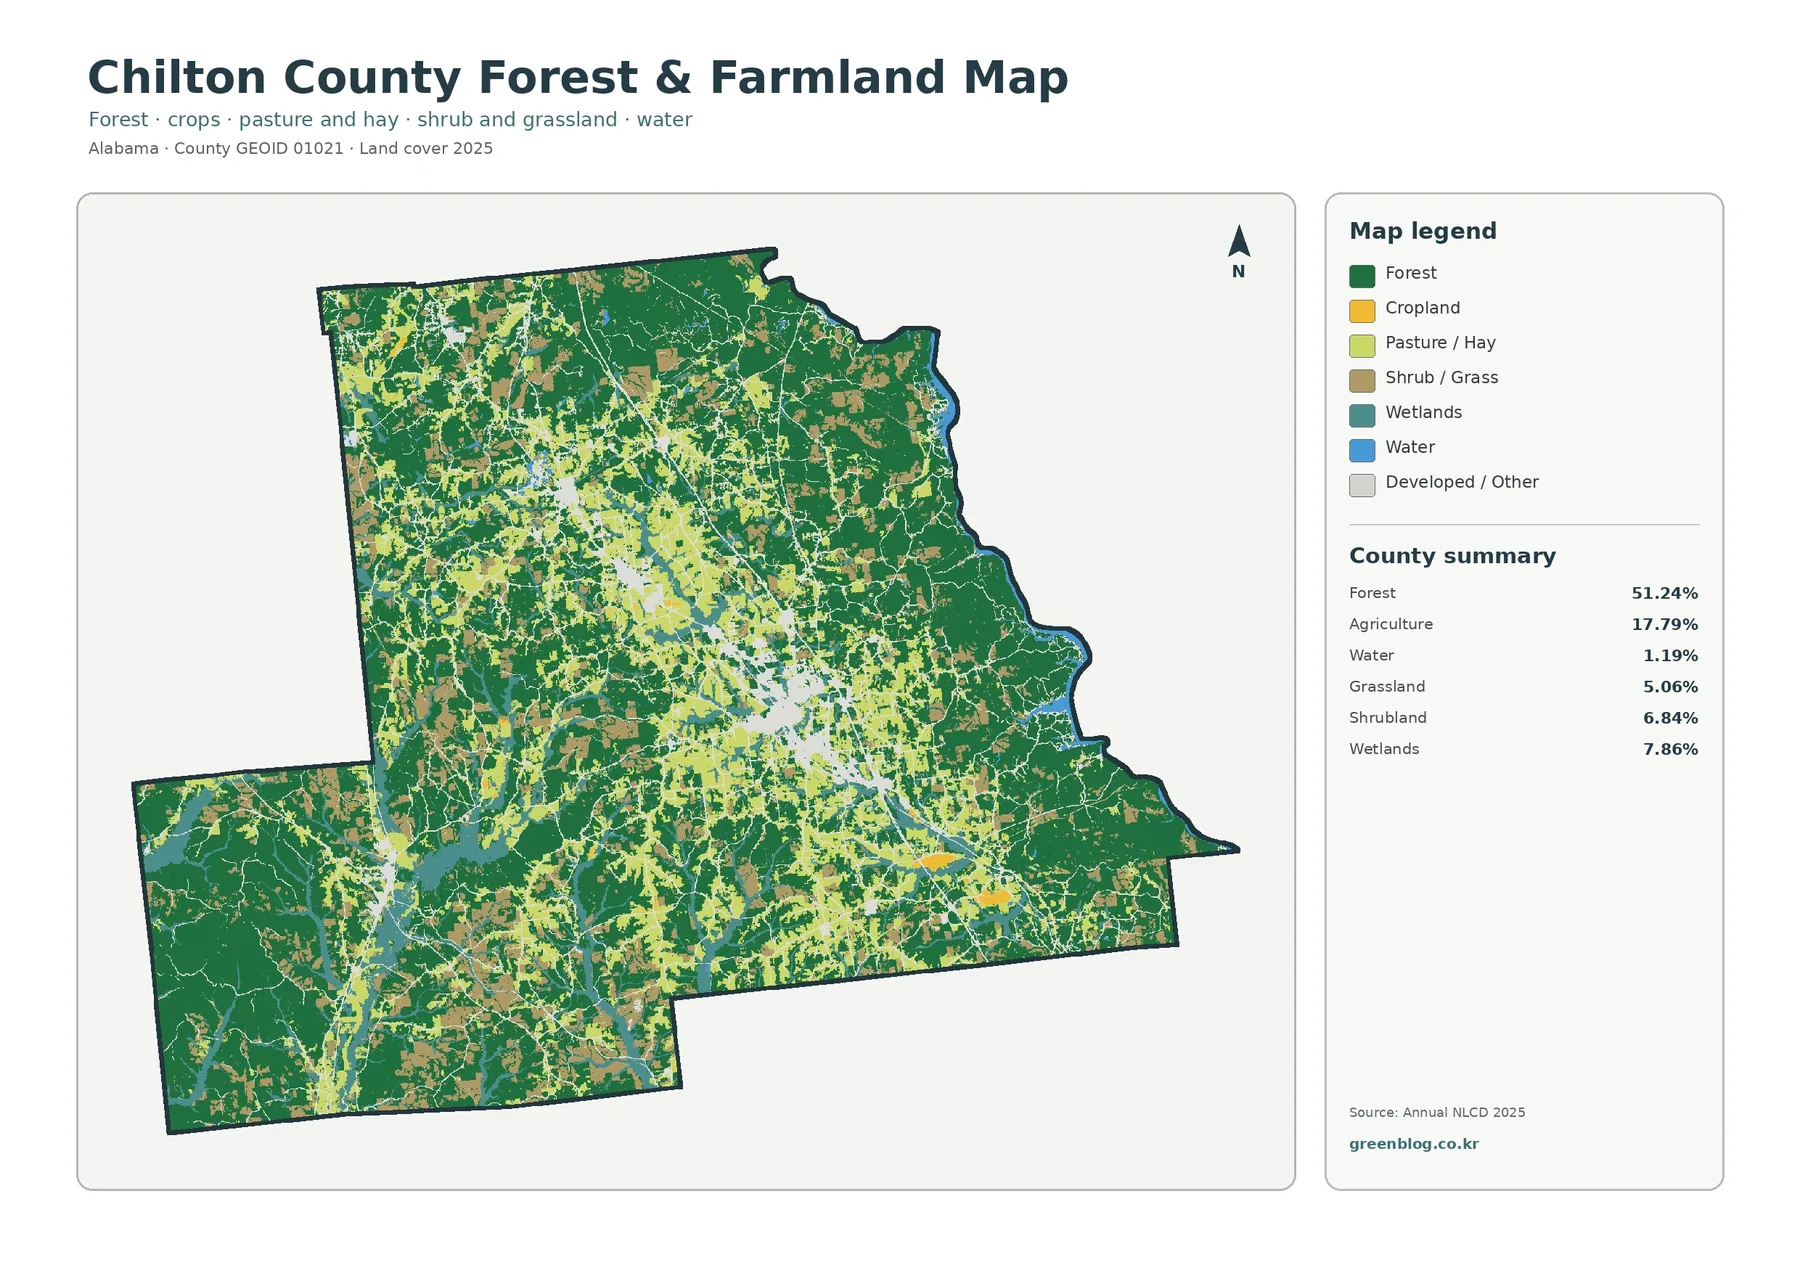
The forest-and-farmland map strips away some of the visual competition from developed classes and makes the rural pattern easier to compare. Its summary lists forest at 51.24%, agriculture at 17.79%, wetlands at 7.86%, shrubland at 6.84%, grassland at 5.06%, and water at 1.19%. Forest is clearly the largest class, but the agricultural cover is not confined to one belt. Yellow areas appear as broad and narrow patches from the center toward the northwest and south, repeatedly interrupting or bordering woodland.
This arrangement matters when the county is described as agricultural. Chilton County is strongly associated with peaches, and Auburn University’s Chilton Research and Extension Center in Clanton has a long-running emphasis on peach research and orchard management. That local context is useful, but the yellow agriculture class on this map should not be renamed “peach orchards.” Annual NLCD groups agricultural surfaces into broad land-cover categories, so the map does not identify individual crop types or orchard boundaries.
The southwest corner is especially useful for contrast because the map shows a larger, more continuous wooded area there. USDA Forest Service documents identify parts of Chilton County within the Oakmulgee Ranger District of Talladega National Forest. The forest boundary is not drawn on the supplied map, so green cells cannot be equated with federal ownership. The safer conclusion is that the county’s southwest has both a known national-forest context and a visibly strong forest-cover pattern.
Shrubland and grassland together account for a meaningful share of the map. They appear in scattered pieces between larger forest and agricultural areas rather than as one dominant region. Those classes can reflect open vegetation, early regrowth, managed grass, or other surfaces that do not fit neatly into mature forest or cultivated agriculture. Their presence helps explain why many boundaries on the map look mottled instead of forming clean straight edges.
The forest-and-farmland view is therefore useful for questions about landscape composition rather than property use. A green cell indicates tree-dominated surface cover, not ownership or timber rights. A yellow agricultural cell indicates a satellite-based agricultural class, not zoning or a legal designation. Parcel boundaries, tax status, conservation restrictions, and development rights require current county records or other specialized sources.
Water is a small share, while wetlands are much more extensive
Open water accounts for only 1.19% in the forest-and-farmland summary, so Chilton County is not a water-dominated county by area. Even so, the eastern edge provides a recognizable water reference. Regional geography places the Coosa River along the county’s eastern side, with Lay Lake and Mitchell Lake associated with that river system. The supplied map does not label these features, but the blue edge and nearby drainage cover make the eastern side useful for orienting the different map views.
Wetlands are much larger at 7.86%. Teal cells appear not only near the eastern water edge but also along narrower internal drainage patterns. Open water and wetland cover should remain separate in an explanation. Wetlands represent water-influenced land cover and vegetation, while open water is mapped as a different class. Neither class should be treated as a legal wetland delineation or a surveyed stream boundary.
For watershed teaching or preliminary environmental review, this difference is useful. A reader can locate broad wetland corridors and compare them with forest or agricultural areas before deciding where more detailed data are needed. Regulatory decisions, flood studies, or site-specific wetland work require current field information and agency data because the 30-meter land-cover grid generalizes small channels, narrow shorelines, and mixed vegetation.
Impervious surface shows the hard footprint inside developed land
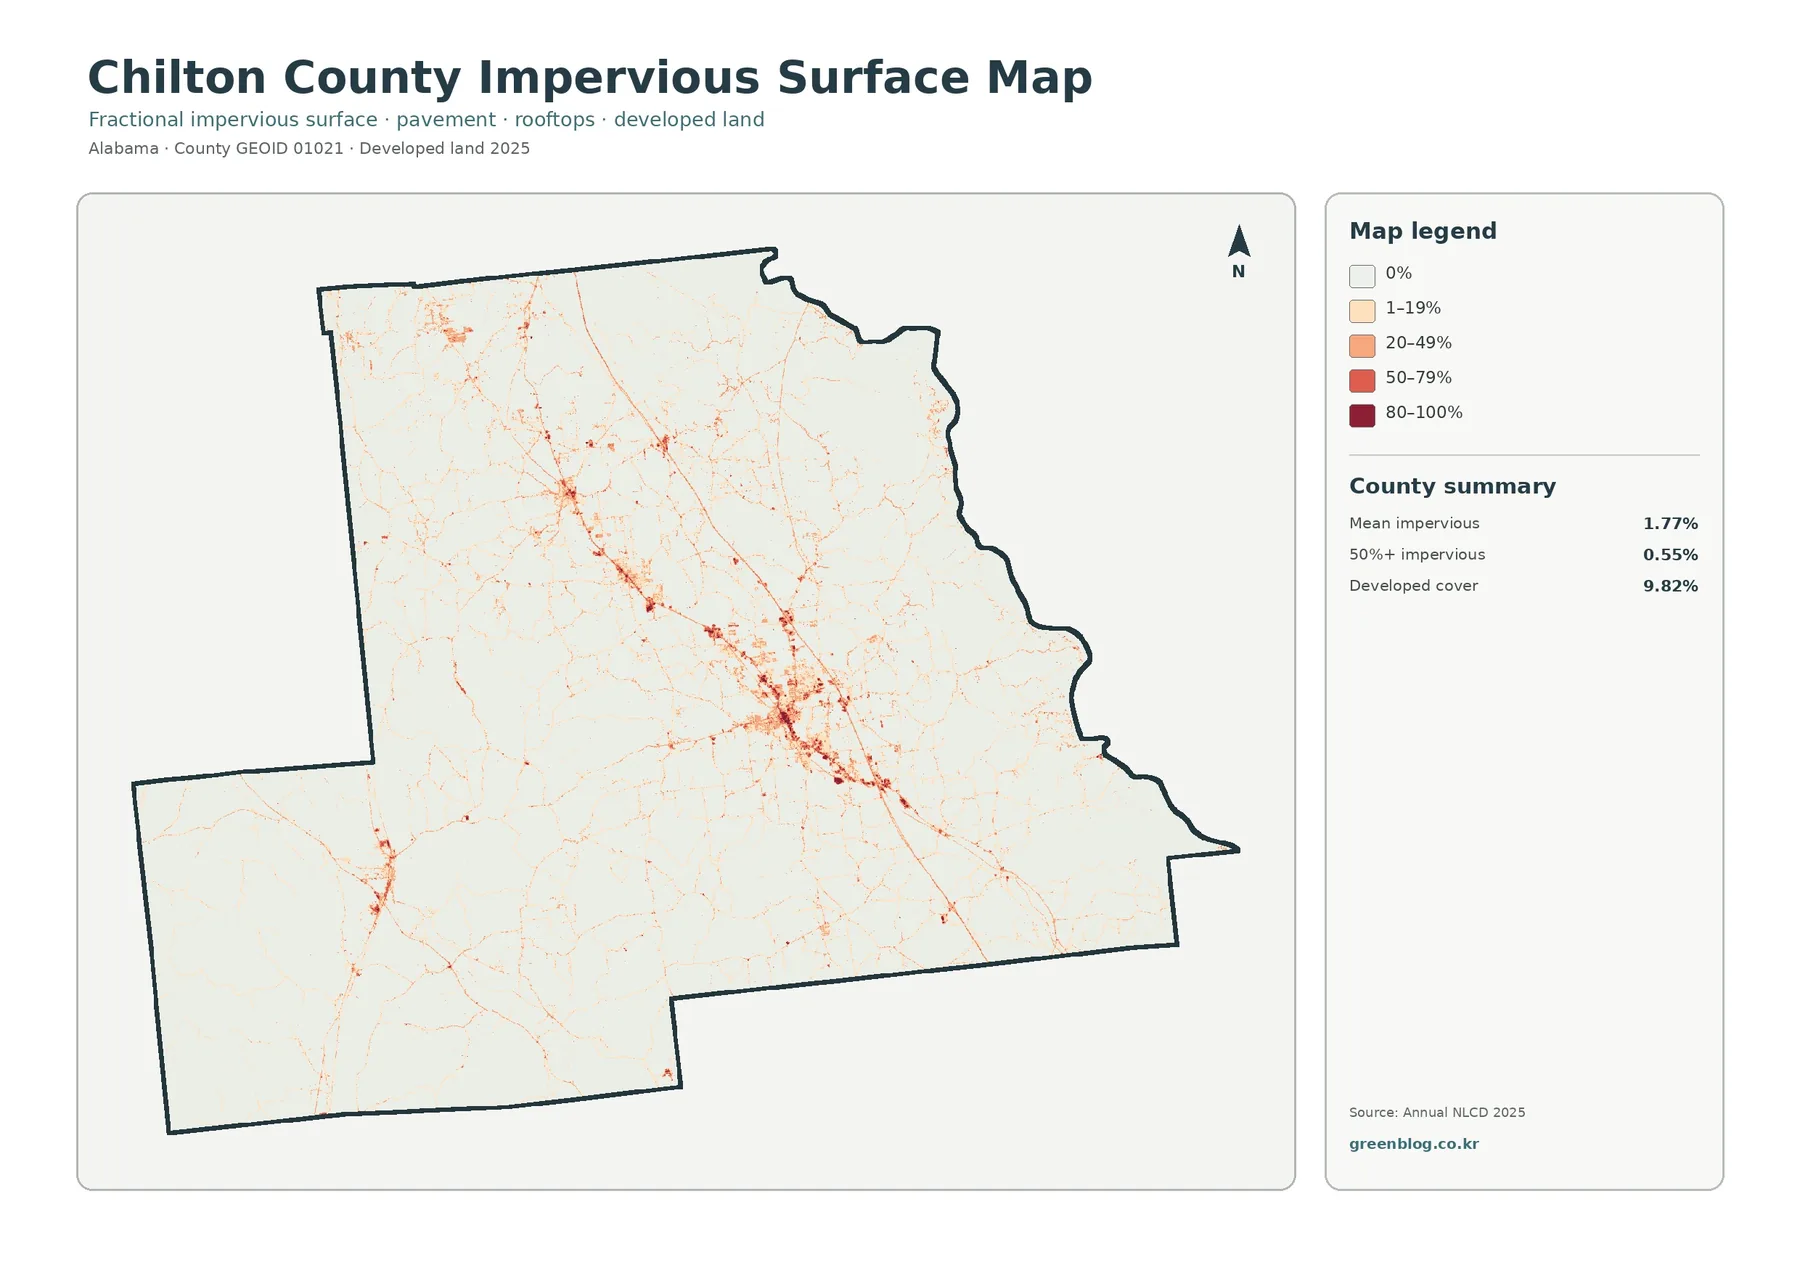
Impervious surface means pavement, rooftops, parking areas, and other hard surfaces that do not readily absorb rainfall. Chilton County’s mean impervious value is 1.77%, and only 0.55% of the county is summarized as having at least 50% impervious cover. Those numbers are far below the 9.82% developed-land share because the two measures describe different things. A developed residential cell can contain a house and road together with lawn, trees, and bare soil.
The map is mostly pale, but a strong orange-red concentration appears around the central settlement area. Thin linear traces extend north and south and branch toward other smaller clusters. This pattern makes the Clanton-area hard-surface footprint much easier to see than on the general land-cover map. It also shows why a countywide mean can be misleading by itself: a low average can coexist with localized places where impervious cover is much higher.
The 50%+ statistic is especially helpful for separating heavily paved or roofed cells from low-density development. Only 0.55% of the county falls into that high-impervious group, so the darkest values occupy a very small footprint. Much of the developed class is therefore likely to include a substantial amount of vegetation or other permeable cover inside the same 30-meter cells. This is one reason the developed percentage and impervious percentage should never be substituted for one another.
Impervious data can support watershed discussions because hard surfaces change how rainfall reaches the ground, but this map is not a flood-risk product. Runoff and flooding depend on slope, soils, drainage systems, channel conditions, rainfall, and many other factors. The layer is most useful for locating built-surface concentrations and deciding where a more detailed hydrologic or infrastructure review may be worthwhile.
The 41.05% change figure is an endpoint class comparison
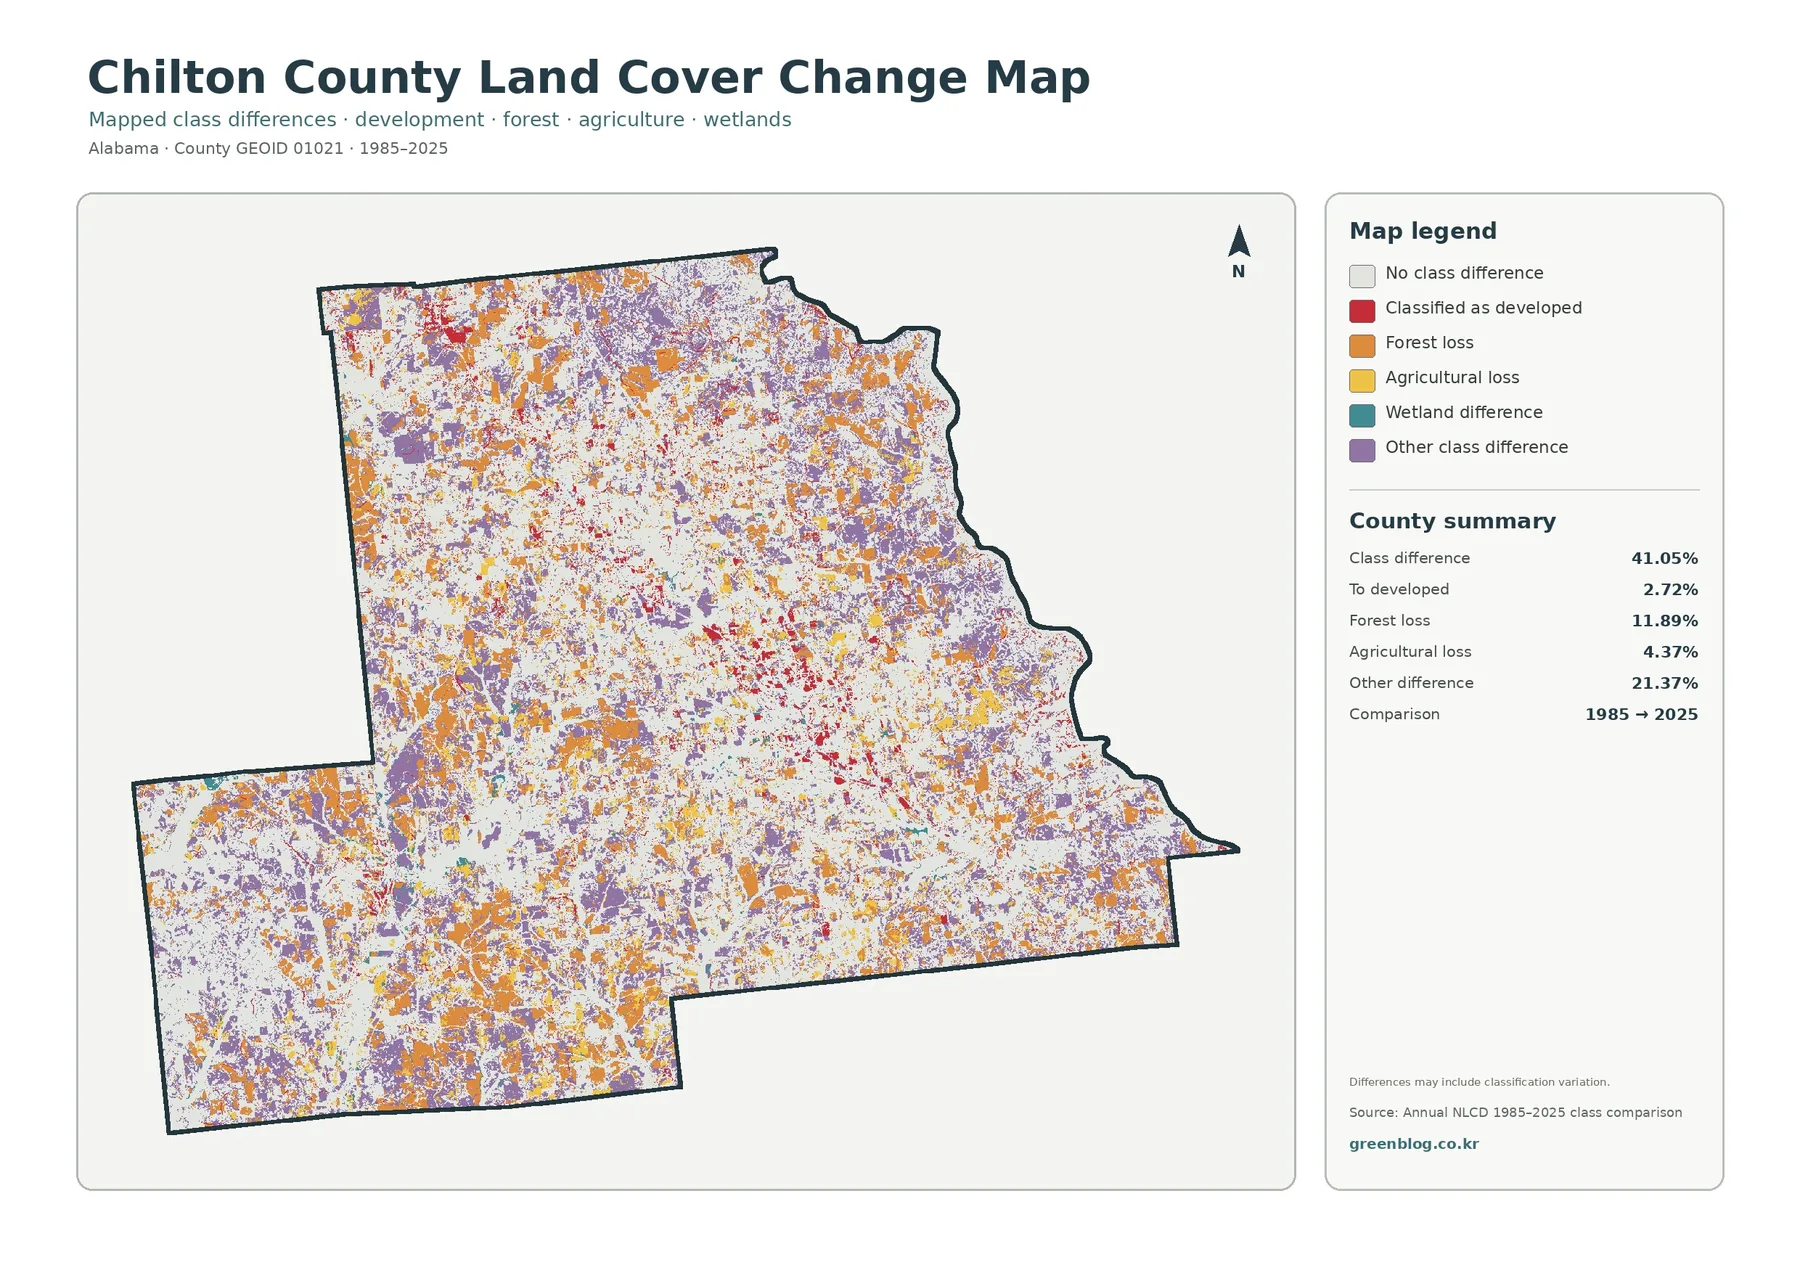
The change map compares the class assigned in 1985 with the class assigned in 2025 and reports a total class difference of 41.05%. The listed components include 2.72% classified to developed, 11.89% forest loss, 4.37% agricultural loss, and 21.37% other class difference. Wetland difference also appears as a legend category, but the summary does not provide a separate percentage for it, so an additional exact value should not be invented.
Orange forest-loss cells and purple other-difference cells are distributed broadly across the county. Red cells classified to developed are more localized and appear most noticeably around the same central area where current developed and impervious cover are concentrated, with additional smaller patches elsewhere. Yellow agricultural-loss cells occur in scattered pieces rather than one continuous zone. The map therefore depicts many kinds of endpoint differences, not a single land-change process moving in one direction.
The 41.05% figure does not mean that 41.05% of Chilton County became developed. The specific to-developed component is 2.72%. The larger total includes several other class transitions and may also include classification variation. Differences in imagery, mixed pixels, vegetation condition, or classification methods can contribute to a cell receiving a different class at the two endpoints. The map itself warns that differences may include classification variation.
Forest loss at 11.89% requires the same caution. It means that a cell mapped as forest at the earlier endpoint was mapped as another class at the later endpoint. It does not identify whether the cause was permanent development, timber harvest, agricultural conversion, temporary disturbance, or a shift between forest and shrub or grass classes. Agricultural loss at 4.37% is also an endpoint classification result. Determining timing or cause requires annual NLCD layers, aerial imagery, and local records.
How to choose the right map for a question
For a quick county overview, begin with the general land-cover map. It shows the proportions and locations of forest, agriculture, developed land, wetlands, shrubland, grassland, water, and other mapped classes in one view. Once a question becomes more specific, the specialized maps are easier to use. The forest-and-farmland view reduces visual clutter, while the impervious layer focuses attention on the built surface within developed areas.
The change map belongs to a different type of question. It is not a second version of the current land-cover map; it compares classifications at two endpoints. For a presentation, it is often clearer to pair the 2025 map with one specialized view rather than display all four at once. Keeping the year and legend visible prevents a current percentage such as 51.24% forest from being confused with an endpoint statistic such as 11.89% forest loss.
In a classroom, Chilton County can illustrate several map-reading concepts at the same time: a dominant class that is spatially fragmented, an agricultural county identity that cannot be reduced to one crop class, a developed corridor whose hard-surface footprint is smaller than the developed category, and a large change percentage that does not equal development. For preliminary planning or environmental work, the maps can divide the county into broad areas for follow-up before more detailed parcel, terrain, stream, or aerial-image data are consulted.
Download the four original JPG maps
The ZIP download contains four 2480×1754 JPG files: the 2025 general land-cover map, the forest-and-farmland map, the impervious-surface and developed-land map, and the 1985–2025 class-difference map. These files are larger than the 1800-pixel-wide WebP previews shown in the article. Because all four use the same Chilton County extent, they are easy to align in a report, slide deck, or side-by-side comparison.
The asset manifest does not mark the JPGs as meeting an A3 high-resolution reference. They can still work well for screen presentations and ordinary documents, but a large print should be tested before final use to make sure the legend and smaller text remain readable. Enlarging the image does not create detail beyond the 30-meter Annual NLCD source grid.
When comparing counties, match the year and map type. Chilton County’s 2025 forest percentage should be compared with another 2025 land-cover map based on the same classification. The 1985–2025 class-difference percentage answers a different question and should be labeled separately. This simple distinction keeps current condition, hard-surface intensity, and change statistics from being mixed together in a single chart or caption.
Scale, raster cells, and what the maps cannot answer
USGS describes Annual NLCD as a Landsat-derived raster product at 30-meter resolution. In plain language, the landscape is divided into grid cells and each cell receives a representative classification or value. A 30-meter cell can contain trees, pavement, grass, a small building, and other surfaces at the same time. The mapped class simplifies that mixture, which is why land-cover edges may not line up with a fence, parcel boundary, road shoulder, or field edge.
Land cover is also different from zoning, ownership, and legal land use. A forest cell does not say whether the land is federal, county, or private property. An agricultural cell does not identify the crop, the farm owner, or the parcel’s zoning. A developed cell does not prove that the whole cell is paved. Questions about property rights, permits, exact parcel boundaries, or regulatory wetlands require current local and agency records.
The 2025 map is a snapshot of the classification for that year, so later construction, harvest, crop changes, or vegetation recovery are not included. The 1985–2025 comparison uses two endpoints and does not show the sequence of events during the intervening decades. Annual NLCD time-series layers and current aerial imagery are better tools when the timing of a specific change matters. Used within these limits, the four maps provide a strong county-scale starting point for deciding where more detailed work is needed.
Frequently Asked Questions
What is the largest 2025 land-cover class in Chilton County?
Forest is the largest class at 51.24%. Agriculture follows at 17.79%, developed land at 9.82%, wetlands at 7.86%, and shrubland at 6.84%. The map is still important because those countywide percentages do not show how forest, farms, wetlands, and developed areas are arranged within the county.
Does the 17.79% agriculture figure represent peach orchards?
No. Chilton County is well known for peaches, and the local Auburn research center has a strong peach program, but Annual NLCD agriculture is a broad land-cover category. The map does not identify crop species or orchard parcels, so the entire agricultural area should not be labeled as peach production.
Why is developed land 9.82% while mean impervious cover is only 1.77%?
Developed land includes a mix of human-built and natural surfaces, especially in low-density residential areas. Impervious cover counts the hard portion such as pavement and rooftops. A developed cell can therefore contain substantial lawn, trees, or soil and have a much lower impervious percentage.
Does the 41.05% 1985–2025 class difference mean 41% of the county was developed?
No. Only 2.72% is summarized as classified to developed. The total also includes 11.89% forest loss, 4.37% agricultural loss, 21.37% other class difference, wetland difference, and possible classification variation. Additional annual data and imagery are needed to determine the timing and cause of a specific change.
What files are included in the download?
The ZIP contains four original 2480×1754 JPG maps covering 2025 general land cover, forest and farmland, impervious surface and developed land, and the 1985–2025 class comparison. The asset manifest does not identify them as meeting an A3 high-resolution reference, so large-format printing should be tested first.
Map File Information
Chilton County Land Cover Maps Four original JPG maps: 2025 land cover, forest and farmland, impervious/developed land, and 1985–2025 class differences
- Included Files: Use only the versions confirmed in the article and supplied images
- File Type: Use the confirmed download contents
- Intended Use: Printing, education, presentations, and map-based projects
Related Maps
- Autauga County Alabama Land Cover Map
- Baldwin County Alabama Land Cover Map
- Barbour County Alabama Land Cover Map
Sources and reference links
- MRLC Annual NLCD Data – official access to Annual NLCD land-cover and related products, including the 2025 data used for the map set.
- USGS Annual NLCD Collection 1.2 Land Cover – official information on the 2025 extension, 30-meter raster resolution, and land-cover classes.
- U.S. Census Bureau TIGER/Line Shapefiles – official county boundary and geographic reference data.
- Chilton County Commission – official county information and administrative context for Clanton.
- Auburn University Chilton Research and Extension Center – local agricultural research context, including the center’s long-running work on peaches and other crops.
- USDA Forest Service – National Forests in Alabama – official documentation that the Oakmulgee Ranger District of Talladega National Forest includes land in Chilton County.
Green Map creates custom-edited map images using open geographic data sources such as geoBoundaries, Natural Earth, OpenStreetMap, and government open data.
These maps are edited visual materials, not raw data files, and are provided for education, documents, presentations, and graphic reference.