Petroleum use connected with useful thermal output in the U.S. electric-power data was extremely uneven across states in 2024. In the 50-state series used here, Montana recorded 414.715 thousand barrels, Maryland 319.315 thousand barrels, and Hawaii 237.667 thousand barrels. Those three observations alone accounted for 81.37% of the sum of the 50 state values. Ohio was a distant fourth at 101.785 thousand barrels, while most states were either very small or reported zero in this specific series.
This is a narrow energy statistic, not a measure of total petroleum consumption in a state and not the combined petroleum use for electricity generation plus useful thermal output. The underlying U.S. Energy Information Administration series is the annual consumption-uto field for petroleum in the electric-power operational data, expressed in thousand barrels. That scope matters because a state can consume large amounts of petroleum elsewhere in its economy and still have little or no value here.
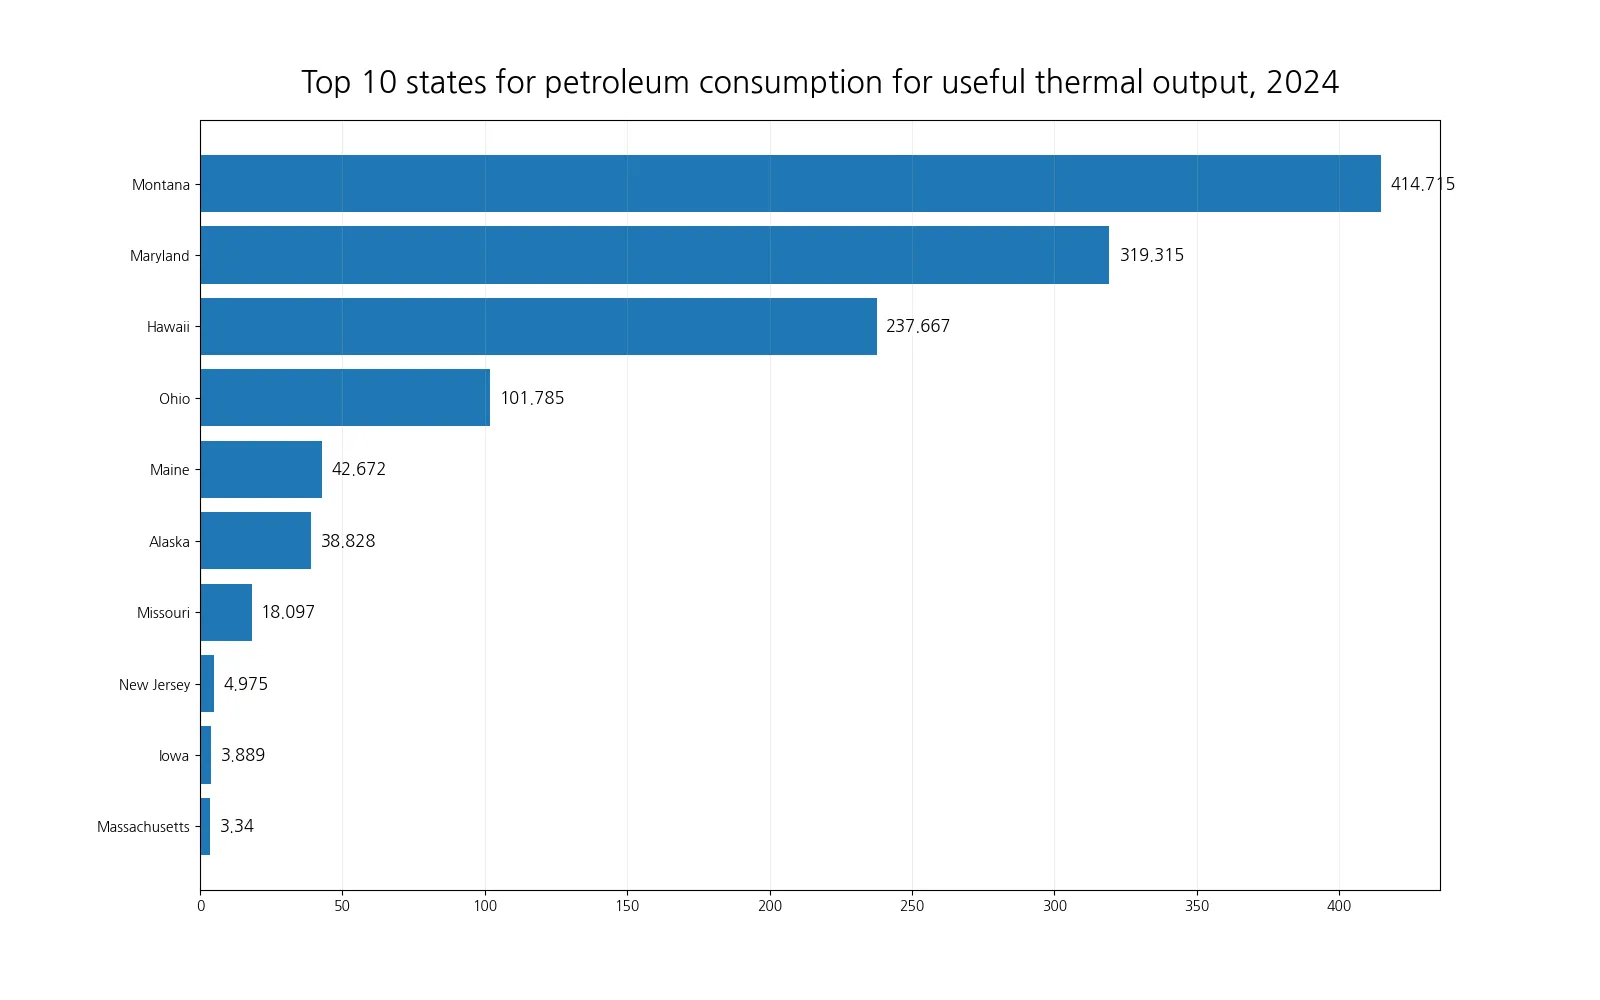
Table of Contents
What this EIA measure actually captures
Useful thermal output refers to heat that is produced for a useful purpose rather than simply being discarded. In power-sector reporting, the concept is closely associated with combined heat and power operations, where a facility can produce electricity and also make use of thermal energy. The EIA operational dataset separates fuel consumption for this useful thermal output from fuel consumption used for electricity generation. The distinction is important when comparing this article with broader state petroleum or power-generation statistics.
The state file contains one annual observation for each of the 50 states for 2024. The unit is thousand barrels and the fuel facet is petroleum. The values are direct published observations in the dataset; no missing values were imputed and no state figures were estimated from neighboring states or national totals. The analysis below therefore describes the pattern inside this exact 50-state series rather than trying to transform it into a broader petroleum-use estimate.
The 2024 distribution was highly concentrated
Adding the 50 state observations gives 1,194.102 thousand barrels. That total is useful as an internal denominator for measuring concentration across the state records. Montana contributed 34.73% of that sum, Maryland 26.74%, and Hawaii 19.90%. Together they reached 81.37%. Adding Ohio raised the share of the top four states to 89.90%. This is why a simple national-style average is a poor description of the distribution: the arithmetic mean was 23.882 thousand barrels per state, but the median for all 50 states was only 0.0135 thousand barrels.
The concentration remains visible even after the first four states. Maine recorded 42.672 thousand barrels and Alaska 38.828 thousand barrels. The top six states together represented 96.72% of the sum of all state observations, leaving only 3.28% for the other 44 states. Missouri, the seventh-ranked state, was at 18.097 thousand barrels; by New Jersey in eighth place, the value had already fallen to 4.975 thousand barrels.
Top states in the EIA series
| State | 2024 value (thousand barrels) | Share of 50-state sum |
|---|---|---|
| Montana | 414.715 | 34.73% |
| Maryland | 319.315 | 26.74% |
| Hawaii | 237.667 | 19.90% |
| Ohio | 101.785 | 8.52% |
| Maine | 42.672 | 3.57% |
| Alaska | 38.828 | 3.25% |
| Missouri | 18.097 | 1.52% |
| New Jersey | 4.975 | 0.42% |
| Iowa | 3.889 | 0.33% |
| Massachusetts | 3.34 | 0.28% |
| Kentucky | 1.459 | 0.12% |
| Wisconsin | 1.21 | 0.10% |
| North Dakota | 1.198 | 0.10% |
| Minnesota | 1.144 | 0.10% |
| Pennsylvania | 0.967 | 0.08% |
The table shows a steep drop rather than a gradual ranking. Montana and Maryland together already exceeded three-fifths of the 50-state sum. Hawaii added nearly another one-fifth. Ohio was the only other state above 100 thousand barrels. Maine and Alaska were in the tens of thousands of barrels, while every state below Missouri was under 5 thousand barrels. This long tail is a key feature of the data and should be kept in mind when reading a map or state ranking.
Zero values do not mean zero petroleum use in the state
Twenty-three states had a value of 0.000 in this particular 2024 series, while 27 had a positive value. A zero should be interpreted narrowly: the EIA record for this field, fuel and sector combination is zero for that state and year. It does not mean the state used no petroleum, generated no electricity from petroleum, had no combined heat and power facilities, or had no industrial thermal demand. Those are different questions and require different EIA series.
Among the 27 states with positive values, the median was 1.144 thousand barrels. Thirteen of the positive states were below 1 thousand barrels, and only seven states were at or above 10 thousand barrels. This reinforces the idea that the series is dominated by a small number of state-specific operations rather than by a broadly similar level of activity across the country.
Why state differences can be so large
The dataset itself reports quantities, not causes, so it should not be used to assign a single explanation to any state. In practice, useful thermal output can be affected by the presence and scale of combined heat and power facilities, the fuels those facilities are designed to burn, operating schedules, local industrial or institutional heat demand, and year-specific plant behavior. A high value therefore indicates more petroleum consumption in this narrow useful-thermal-output category, but it does not by itself tell us whether petroleum was economically preferred, technically necessary, used as a backup fuel, or associated with a particular type of customer.
Likewise, a low value can result from many different system configurations. Natural gas, biomass, coal, waste-derived fuels, or other energy sources may supply useful thermal output instead. Some states may have little CHP activity in the electric-power reporting universe, while others may have CHP facilities but use almost no petroleum for the thermal side of their operation. These possibilities are why the safest comparison is the direct state ranking and concentration pattern, not an unsupported causal story.
How this differs from petroleum used for electricity generation
Petroleum consumption for useful thermal output is a different measure from petroleum consumption for electricity generation. A power plant may burn petroleum to generate electricity, to support useful thermal output in a CHP configuration, or for both purposes. The EIA provides separate operational fields so analysts can avoid combining those activities accidentally. For readers comparing related Greenblog articles, this distinction is especially important: the present article isolates the useful-thermal-output field rather than the combined generation-and-thermal total.
That separation also explains why state leaders can differ across related metrics. A state that relies heavily on petroleum for electricity generation does not necessarily lead in petroleum used for useful thermal output. Conversely, a state with a sizable CHP-related thermal use can rank high here even if its overall electricity mix is dominated by other fuels. The ranking should therefore be read as a specialized operational profile rather than a general ranking of state petroleum dependence.
What the 50-state pattern tells us
The most defensible conclusion is about concentration. The top three states accounted for 81.37% of the state-sum denominator, the top four for 89.90%, and the top ten for 99.26%. That means the lower 40 states together contributed less than 1% of the sum. A map with equal visual weight for every state can therefore make the activity look more geographically widespread than the quantities actually are. A ranked chart is useful because it makes the steep scale difference visible.
The distribution is also a reminder to inspect absolute values rather than rankings alone. Moving from tenth to fifteenth place sounds like a moderate ranking change, but the values in that portion of the list are only a few thousand barrels or less. By contrast, the gap between first and fourth place is hundreds of thousands of barrels. For this reason, the article reports both values and shares instead of presenting ranks as if all positions were evenly spaced.
Data source, scope and calculation notes
The underlying observations come from the U.S. Energy Information Administration electric-power operational data API, using the 2024 annual useful-thermal-output consumption field for petroleum. EIA also publishes national context for petroleum liquids and useful thermal output in its Electric Power Annual. The state analysis uses the 50 published state rows supplied for the series and keeps the original thousand-barrel unit.
Shares were calculated by dividing each state value by the sum of the 50 state observations. No population, generation, capacity, economic output, or weather adjustment was applied. Consequently, these figures show absolute reported quantities, not per-capita intensity, efficiency, fuel share, or the probability that a state uses CHP. The year is fixed at 2024, so the results should not be presented as a trend unless comparable observations from other years are analyzed separately.
How to use this comparison responsibly
- Use the values to compare the scale of the same EIA useful-thermal-output petroleum series across states in 2024.
- Do not interpret a zero as evidence that a state had no petroleum consumption in other sectors or for electricity generation.
- Do not treat the state-sum denominator as automatically identical to every national EIA table, because published tables can use different sector groupings and reporting scopes.
- Use separate EIA series when the question is electricity generation, total petroleum consumption, heat content, emissions, or another fuel.
- When comparing years, use the same field, fuel, sector and unit so the metric identity remains consistent.
For a visitor trying to understand where this particular petroleum use was concentrated, the answer is clear: Montana, Maryland and Hawaii dominated the 2024 state distribution, with Ohio forming a second tier and the remaining states far behind. The more important analytical point is that this is a specialized CHP-related fuel-use measure. Keeping that narrow definition intact makes the ranking useful and prevents it from being mistaken for a general petroleum or electricity statistic.
Frequently Asked Questions
Which state had the highest petroleum consumption for useful thermal output in 2024?
Montana was highest in this EIA 50-state series at 414.715 thousand barrels, followed by Maryland and Hawaii.
Does a zero mean a state used no petroleum in 2024?
No. A zero applies only to this specific EIA useful-thermal-output petroleum series. The state may still use petroleum for electricity generation, transportation, industry or other purposes.
Is this the same as petroleum consumption for electricity generation?
No. EIA reports fuel consumption for electricity generation and for useful thermal output as separate operational measures. This article uses only the useful-thermal-output field.
Related Articles
Green Map creates custom-edited map images using open geographic data sources such as geoBoundaries, Natural Earth, OpenStreetMap, and government open data. These maps are edited visual materials, not raw data files, and are provided for education, documents, presentations, and graphic reference.