UNESCO Institute for Statistics (UIS) observations for 2021 show an exceptionally concentrated destination pattern for internationally mobile students whose origin region is Central Asia. Russia is the largest observed destination with 175,443 students, accounting for almost half of the sum across the 76 country and area observations in this comparison. Türkiye follows with 52,013 and Kyrgyzstan with 39,865. Together, those three destinations represent about 74.6% of the observed sum.
The 76 reported values add to approximately 358,128 students. That figure is useful as a common denominator for describing this extract, but it is not treated as an exhaustive worldwide total for every internationally mobile student from Central Asia. Destinations missing from the table are not converted to zero, and no unreported country value is estimated. The analysis therefore stays within the coverage of the observations actually present.
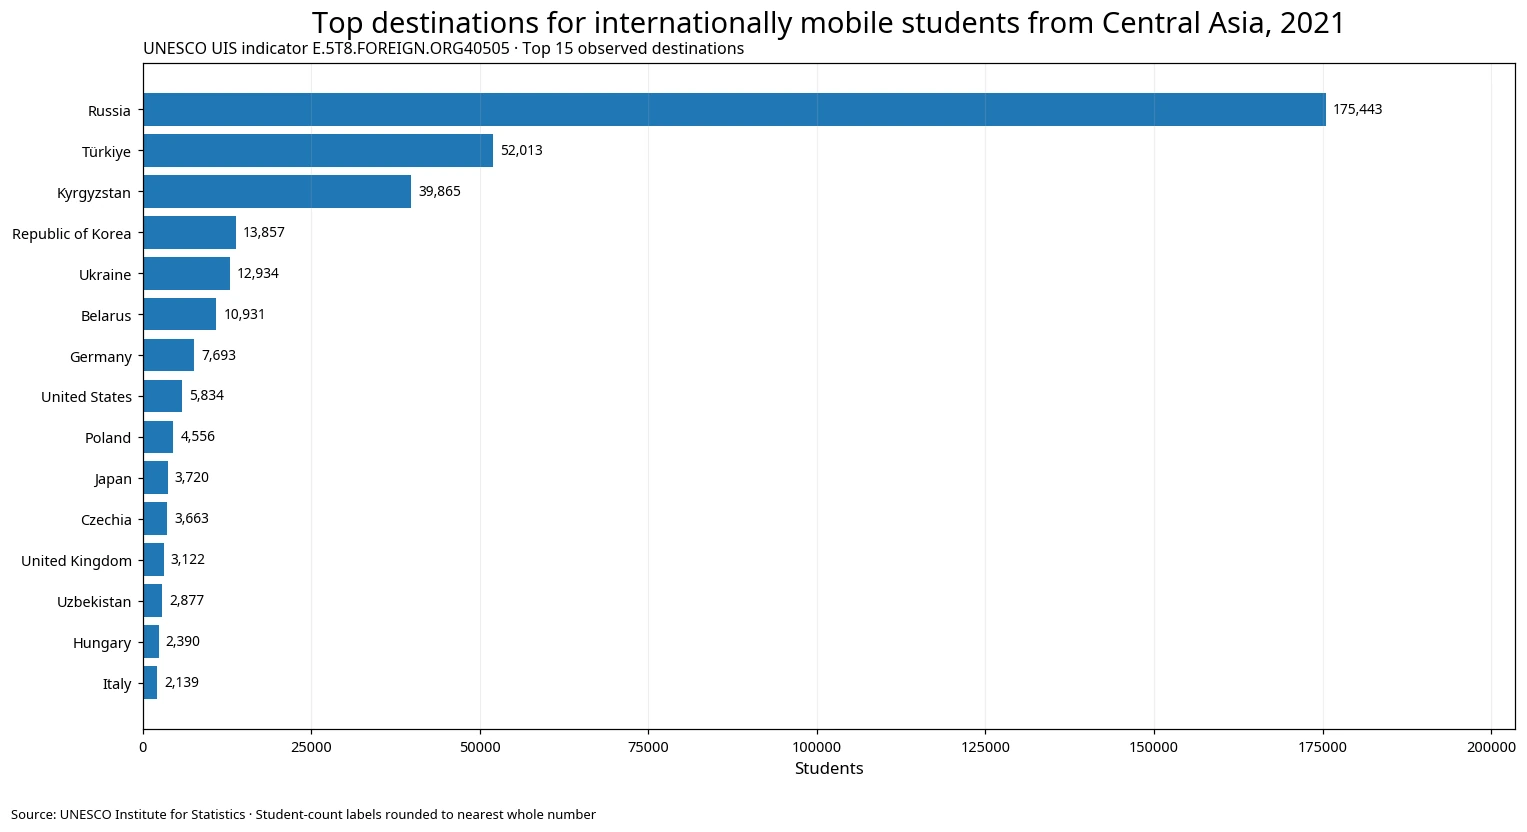
Table of Contents
Russia contains almost half of the observed student count
Russia’s 175,443 students equal about 49.0% of the 76-row observed sum. The value is more than three times Türkiye’s and is larger than Türkiye and Kyrgyzstan combined. That single-country concentration is the defining feature of the cross-section. The distribution is not one in which the leading destinations have similar values.
Russia and Türkiye together account for about 63.5% of the observed sum. Adding Kyrgyzstan raises the top-three share to 74.6%. The top five destinations reach about 82.1%, and the top ten reach 91.3%. The rapid increase in cumulative share shows why concentration measures are more informative here than a simple list of 76 ordinal ranks.
These values do not rank education quality, student satisfaction or the attractiveness of national higher-education systems. They also do not identify why individual students selected Russia, Türkiye or any other destination. Tuition, scholarships, language, visa policy, institutional partnerships, migration networks, geography and employment opportunities may all matter in real decisions, but this indicator does not contain those explanatory variables. The defensible statement is that the observed student counts are concentrated, not that one unmeasured factor caused that concentration.
The top 15 destinations show distinct scale bands
The leading group is not evenly spaced. Russia forms a scale category of its own, Türkiye and Kyrgyzstan form another large group, and the next destinations fall into the tens-of-thousands and then thousands. For that reason, the difference between broad scale bands is often more meaningful than whether two neighboring countries are separated by one place in the ranking.
| Rank | Destination | Students in 2021 | Share of 76-row sum |
|---|---|---|---|
| 1 | Russia | 175,443 | 49.0% |
| 2 | Türkiye | 52,013 | 14.5% |
| 3 | Kyrgyzstan | 39,865 | 11.1% |
| 4 | Republic of Korea | 13,857 | 3.9% |
| 5 | Ukraine | 12,934 | 3.6% |
| 6 | Belarus | 10,931 | 3.1% |
| 7 | Germany | 7,693 | 2.1% |
| 8 | United States | 5,834 | 1.6% |
| 9 | Poland | 4,556 | 1.3% |
| 10 | Japan | 3,720 | 1.0% |
| 11 | Czechia | 3,663 | 1.0% |
| 12 | United Kingdom | 3,122 | 0.9% |
| 13 | Uzbekistan | 2,877 | 0.8% |
| 14 | Hungary | 2,390 | 0.7% |
| 15 | Italy | 2,139 | 0.6% |
The Republic of Korea is fourth with 13,857 students, equal to roughly 3.9% of the observed sum. It is a substantial destination within the top 15, but it remains far below Russia and below both Türkiye and Kyrgyzstan. In this article it is treated as one comparison point inside the wider destination distribution rather than as the subject of the analysis.
Ukraine and Belarus also exceed 10,000 students, Germany is above 7,000, and the United States is about 5,834. Poland and Japan exceed 3,000. The leading destinations therefore span several parts of Europe and Asia as well as North America. Geographic breadth, however, does not remove the numerical concentration created by the first few destinations.
A mean of 4,712 and a median of 177 describe very different realities
The simple mean across 76 destinations is about 4,712 students, while the median is only about 177.1. The mean is roughly 26.6 times the median because the largest observations pull the arithmetic average sharply upward. Calling 4,700 students a typical destination size would therefore misrepresent most of the rows.
Only 21 destinations have at least 1,000 students. By contrast, 36 destinations are below 100 and 20 are at 10 or fewer. This is a long-tail distribution: a small number of very large destinations coexist with many small observations. The median and the share of low-count rows help reveal that structure in a way the mean alone cannot.
Small differences near the bottom of the table should not be interpreted with the same weight as gaps near the top. A change from one observed student to two can alter a low-end rank without changing the overall distribution, whereas the gap of more than 120,000 between Russia and Türkiye fundamentally shapes the aggregate picture. Rank order is most useful here when paired with actual counts and cumulative shares.
Kyrgyzstan in third place does not contradict the Central Asia origin label
The origin condition in this indicator is Central Asia as a region. A Central Asian country can therefore also appear as a destination. The Kyrgyzstan row does not represent domestic movement by Kyrgyz students. It can include students whose origin is elsewhere in Central Asia who physically crossed an international border to study in Kyrgyzstan.
The extract is region-aggregated rather than origin-country specific. It does not separate the number of students originating in Kazakhstan, Uzbekistan, Tajikistan, Kyrgyzstan or Turkmenistan. To answer a question about one specific origin country, a different UIS indicator that fixes that country as the origin is required. Treating a regional aggregate as if it belonged to one origin country would create a false conclusion.
The same rule applies to the Russian value of 175,443. It represents internationally mobile students from the Central Asia origin group observed in Russia. It does not show how much each individual Central Asian origin country contributed to that total, and this cross-section cannot reconstruct those origin-country shares.
Internationally mobile students are not simply all foreign citizens
UIS defines internationally mobile students around educational movement across an international border. A student studies in a destination country that differs from the country of origin and has physically moved for the purpose of education. For tertiary students, the preferred origin criterion is the country where the upper-secondary qualification used before entering tertiary education was obtained.
If that criterion is unavailable, usual or permanent residence may be used, and citizenship is recommended only as a last-resort proxy. This means that a Central Asia origin label is not automatically identical to a citizenship label. The distinction matters because mobility statistics are intended to capture movement for education rather than simply the presence of foreign passport holders.
Physical movement is also essential to the concept. A student who remains in the origin country while participating in a foreign institution’s distance-learning program is not classified as internationally mobile on that basis alone. The word ‘inbound’ is from the destination system’s perspective: each row describes students from the Central Asia origin group entering that destination for education.
The 76-row sum should not be relabeled as a complete world total
International student mobility data are assembled from destination systems reporting information about student origins. This extract contains 76 country and area observations with values for 2021. An absent destination cannot safely be assumed to have zero students because reporting availability, statistical systems and submission timing can differ.
For that reason, the approximately 358,128-student sum is used only as the total of the observed rows. It supports internally consistent comparisons such as Russia at 49.0%, the top three at 74.6%, and the top ten at 91.3% of this extract. Without a separate official total indicator establishing full coverage, it should not be presented as the exhaustive number of Central Asia-origin students studying abroad worldwide.
Zero-filling missing destinations would also alter the distribution statistics. It would add artificial low-count rows, change the median and affect any statement about the number of small destinations. The calculations here therefore use only the 76 non-missing observations actually supplied in the dataset, which keeps the analysis reproducible and avoids inventing values.
A 2021 cross-section compares destination size, not change over time
All observations use the same 2021 reference year. That makes the extract well suited to comparing destination size at a common point in time. Russia, Türkiye, Kyrgyzstan, Ukraine, Germany and the other destinations can be placed on the same scale without mixing different years.
A one-year cross-section cannot establish a trend. It does not show whether Russia’s share increased from 2020, whether Türkiye has been gaining students over several years, or whether a policy change caused the destination mix to shift. Those questions require a comparable time series and, for causal claims, evidence about the policies or conditions being evaluated.
The ‘both sexes’ label means male and female students are combined in the reported values. This series is not a gender-balance measure. Analyzing sex differences would require sex-disaggregated observations or a separate gender indicator. The current data are used only to compare the total observed scale across destinations.
Decimal observations are retained for calculations and rounded only for display
Most values are whole numbers, but several observations contain decimals in the source. Rather than changing the published data, the calculations retain those values exactly as provided. The chart and public table round student counts to the nearest whole number so that readers can scan them more easily.
Because of that display rounding, adding the visible table labels may differ slightly from the sum calculated from the underlying data. The observed total, mean, median and destination shares all use the unrounded source values. Separating calculation precision from display formatting avoids introducing unnecessary numerical error.
What the dataset can and cannot support
The strongest conclusions are about relative destination size, concentration and distribution shape in 2021. Russia is by far the largest observed destination; the first three destinations contain nearly three quarters of the observed sum; and the top ten contain more than nine tenths. The large gap between the mean and median further confirms that a few very large values dominate the distribution.
The dataset cannot, by itself, explain student motives, compare the quality of national education systems, estimate the effect of visa rules, or attribute the pattern to historical, linguistic or economic causes. It also cannot provide a time trend from a single year. Distinguishing descriptive evidence from causal explanation keeps the article within what the official observations actually support.
A useful way to read the ranking is therefore to combine three views: the absolute count for each destination, the cumulative share held by the leading group, and the much smaller median destination. Together those measures show not only which destinations are largest, but also how strongly the observed mobility pattern is concentrated and how different the typical row is from the arithmetic average.
Data source and calculation method
Country values come from UNESCO Institute for Statistics indicator E.5T8.FOREIGN.ORG40505, “Inbound internationally mobile students from Central Asia, both sexes (UIS estimate) (number),” using the 2021 NATIONAL observations in this comparison. The interpretation of internationally mobile students follows the UIS Data Browser glossary.
- UNESCO UIS official API — Central Asia origin international student indicator
- UNESCO UIS Data Browser Glossary — internationally mobile students
Rankings, the observed sum, mean, median and concentration shares are calculated directly from the 76 non-missing observations. Source decimals are retained during calculation and rounded only for the student-count labels shown in the chart and table. No absent destination is zero-filled and no missing country value is estimated.
These choices define the safe interpretation boundary of the article. Destination size and concentration can be compared confidently within the observed extract, while a complete worldwide total, origin-country composition, long-term trend and causal explanation require additional data. Keeping those questions separate makes the published comparison more precise and easier to verify.
Frequently Asked Questions
Are the country rows origins or study destinations?
They are destinations. Central Asia is fixed as the origin-region condition, and each row reports internationally mobile students from that origin group observed in the destination.
Is the approximately 358,000-student sum the complete worldwide total for Central Asia-origin students abroad?
No. It is the sum of the 76 destination observations present in this comparison. Destinations absent from the extract are not assumed to have zero students.
Can this dataset show how many students came from each individual Central Asian country?
No. The indicator aggregates Central Asia as an origin region. A country-specific origin indicator is needed to separate Kazakhstan, Uzbekistan, Tajikistan, Kyrgyzstan, Turkmenistan or other defined origin components.
Can the 2021 data show which destinations are growing or shrinking?
No. A one-year cross-section compares destination sizes at that point in time. A trend requires comparable observations across multiple years.
Related Maps
Green Map creates custom-edited map images using open geographic data sources such as geoBoundaries, Natural Earth, OpenStreetMap, and government open data.
These maps are edited visual materials, not raw data files, and are provided for education, documents, presentations, and graphic reference.