UNESCO Institute for Statistics (UIS) data for 2020 show a sharply concentrated destination pattern for internationally mobile tertiary students whose country of origin is Indonesia. Australia has the largest observation at 12,852 students, followed by Malaysia with 9,902 and the United States with about 8,039. Together, those three destinations account for 52.2% of the sum across the 71 reported country and area observations in this extract.
The 71 values add to about 59,030 students. That is a useful denominator for describing the distribution inside this dataset, but it should not be presented as a complete worldwide total for every Indonesian-origin student abroad in 2020. Within the observed set, the top five destinations contain 70.9% of the sum and the top ten contain 89.2%, leaving a long tail of much smaller destinations.
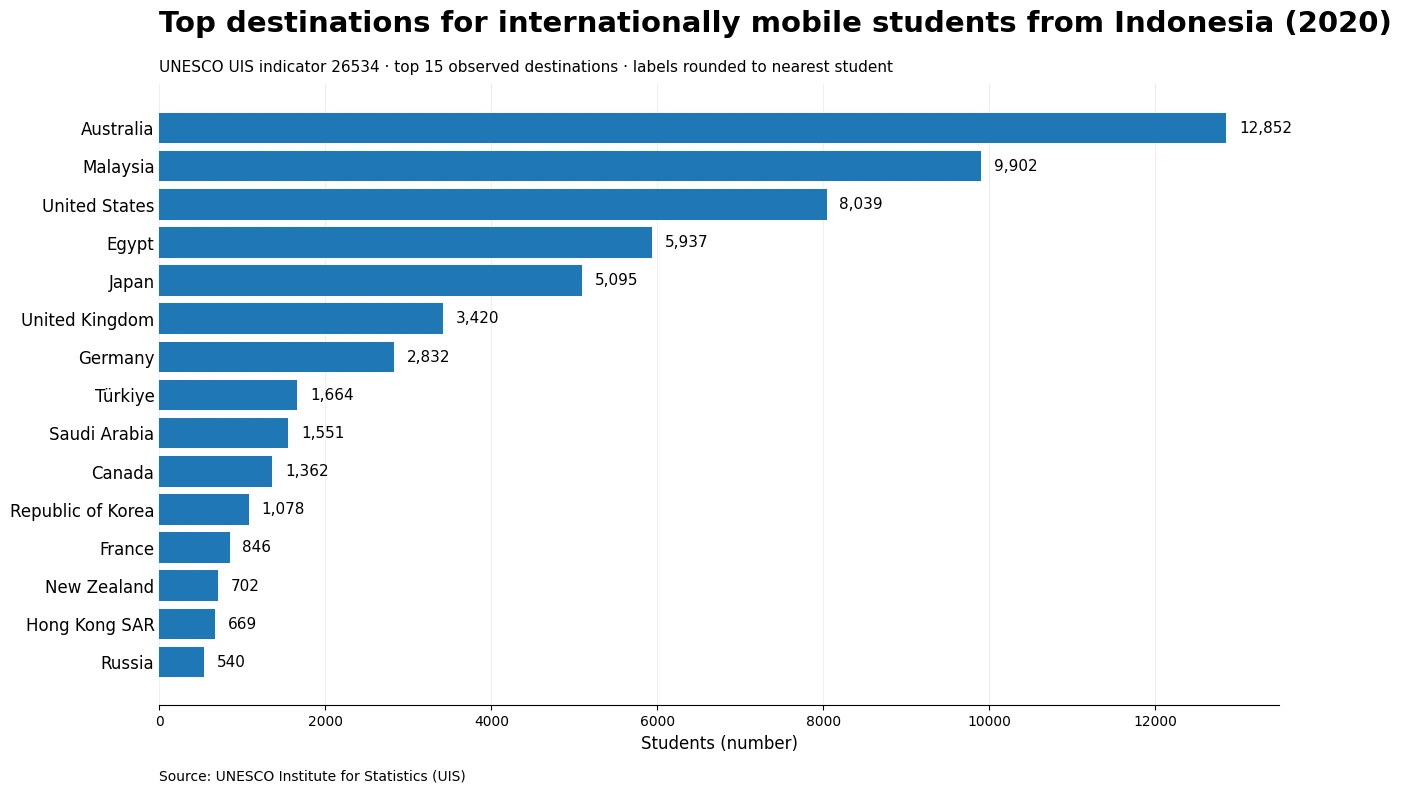
Table of Contents
Australia and Malaysia stand out at the top
Australia alone represents 21.8% of the 71-row sum, while Malaysia contributes another 16.8%. Combined, the two destinations make up 38.5% of the observations included here. The United States is third at roughly 8,039, followed by Egypt at 5,937 and Japan at 5,095.
The leading destinations are geographically varied. Nearby Asia-Pacific systems such as Malaysia, Australia and Japan appear alongside the United States, the United Kingdom and Germany. That pattern does not identify why any student chose a particular country, but it does show that the destination network is geographically broad even though the student counts are heavily concentrated in a small number of places.
Top 15 reported destinations
The percentage column below uses the sum of the 71 observed values as its denominator. It is therefore a share of this extract, not a claim about the exact share of all Indonesian students studying abroad worldwide. A few UIS observations contain decimals; table labels are rounded to the nearest student for readability while calculations use the reported values.
| Rank | Destination | Students | Share of 71-row sum |
|---|---|---|---|
| 1 | Australia | 12,852 | 21.8% |
| 2 | Malaysia | 9,902 | 16.8% |
| 3 | United States | 8,039 | 13.6% |
| 4 | Egypt | 5,937 | 10.1% |
| 5 | Japan | 5,095 | 8.6% |
| 6 | United Kingdom | 3,420 | 5.8% |
| 7 | Germany | 2,832 | 4.8% |
| 8 | Türkiye | 1,664 | 2.8% |
| 9 | Saudi Arabia | 1,551 | 2.6% |
| 10 | Canada | 1,362 | 2.3% |
| 11 | Republic of Korea | 1,078 | 1.8% |
| 12 | France | 846 | 1.4% |
| 13 | New Zealand | 702 | 1.2% |
| 14 | Hong Kong SAR | 669 | 1.1% |
| 15 | Russian Federation | 540 | 0.9% |
The Republic of Korea has an observation of 1,078 students, equal to about 1.8% of the 71-row sum. It is one destination among many in the comparison rather than the organizing focus of the indicator.
A median of 25 tells a different story from the mean of 831
The simple mean across the 71 destinations is about 831.4 students, but the median is only 25. The mean is roughly 33.3 times the median because a few very large destinations pull the average upward. For a distribution this skewed, the median describes a typical row more clearly than the arithmetic mean, while concentration shares show where most of the observed students are located.
Only 11 destinations have values of at least 1,000. By contrast, 49 are below 100 and 32 are at 10 or fewer. The top ten destinations contain 89.2% of the observed sum. Taken together, those figures describe a classic long-tail distribution: a small group of major destinations and many destinations with small reported counts.
Tiny differences at the bottom of the ranking should not be overinterpreted. Whether one destination reports one student and another reports two is far less informative than the thousands-of-students gaps near the top. The strongest signals in this cross-section are the scale of Australia and Malaysia, the large second tier led by the United States, Egypt and Japan, and the rapid drop-off after the leading destinations.
What “internationally mobile students from Indonesia” means
UIS defines internationally mobile students as people who physically cross an international border for education and study in a destination country different from their country of origin. For tertiary students, the preferred origin concept is the country where the student obtained the upper-secondary qualification before entering tertiary education. If that cannot be applied, usual or permanent residence may be used, and citizenship is recommended only as a last-resort proxy.
That definition matters because “from Indonesia” is not automatically identical to “Indonesian citizen.” The indicator is designed to measure educational mobility rather than simply count foreign passport holders. It also excludes arrangements that do not involve physical cross-border movement, such as a student remaining in the origin country while taking a distance-learning program delivered by a foreign institution.
The word “inbound” in the official indicator title is written from the perspective of each destination education system. An Australia row therefore means Indonesia-origin mobile students enrolled in Australia, not Australian students enrolled in Indonesia. Indonesia is fixed as the origin condition; the country rows are destinations.
Why the 71-row sum is not a complete global total
International student mobility statistics are assembled from destination-country reporting. This extract contains 71 country and area observations for 2020, but a destination that is absent from the extract cannot simply be assigned a value of zero. Missing or unavailable reporting is not the same thing as proof that no students were present.
For that reason, the approximately 59,030-student sum is used only as the total of the observed rows. It supports internally consistent statements such as Australia accounting for 21.8% of the extract or the top ten accounting for 89.2%. It should not be relabeled as an exhaustive official count of all Indonesian-origin tertiary students worldwide unless a separate UIS total indicator establishes that coverage.
What a one-year cross-section can and cannot show
All rows in this comparison use the same 2020 reference year, which makes the dataset suitable for comparing destination size at a common point in time. It can answer which reported destinations were largest, how quickly the distribution falls away after the leaders, and how concentrated the observed mobility pattern was.
A single year cannot establish a trend. It cannot show whether Australia was gaining or losing students relative to 2019, whether Malaysia became more popular after a policy change, or whether visa rules, tuition, scholarships, language, migration networks or employment prospects caused the observed differences. Those questions require comparable time-series data or separate evidence about the relevant policies and student decisions.
The “both sexes” label also means male and female students are combined. This series is not a gender-balance measure. Any claim about female or male representation would require sex-disaggregated counts or a separate gender parity indicator.
Data source and calculation method
The country values come from UNESCO Institute for Statistics indicator 26534, “Inbound internationally mobile students from Asia: Students from Indonesia, both sexes (number),” using 2020 NATIONAL observations. The interpretation of international mobility follows the UIS Data Browser glossary definition of internationally mobile students.
- UNESCO UIS official API — indicator 26534, 2020 national observations
- UNESCO UIS Data Browser Glossary — definition of internationally mobile students
The ranking, observed total, mean, median and concentration shares are calculated directly from the 71 non-missing observations. Published numeric values are retained for calculation, including the small number of decimal observations. Student-count labels in the chart and table are rounded to whole numbers only for display. No absent destination is filled with zero and no missing country value is estimated.
Frequently Asked Questions
Are the country rows origins or study destinations?
They are destinations. Indonesia is fixed as the country of origin, and each country or area row reports internationally mobile tertiary students from Indonesia observed in that destination.
Is the roughly 59,000-student sum the total number of Indonesian students studying abroad worldwide?
No. It is the sum of the 71 destination observations present in this extract. Destinations without an observation cannot automatically be treated as zero.
Why do a few student-count observations contain decimals?
A small number of UIS values in the source extract are non-integers. Calculations retain the published values, while chart and table labels are rounded to the nearest whole student for readability.
Can the 2020 data show whether a destination was gaining or losing Indonesian students?
No. A one-year cross-section can compare destination sizes at that time, but a trend requires comparable observations across multiple years.
Related Articles
- Top Destinations for Internationally Mobile Students from Japan | 2020
- Students from the Netherlands Abroad 2021 | Top Destinations
- Russian Student Destinations in 2023 | 70 Reported Destinations
Green Map creates custom-edited map images using open geographic data sources such as geoBoundaries, Natural Earth, OpenStreetMap, and government open data.
These maps are edited visual materials, not raw data files, and are provided for education, documents, presentations, and graphic reference.