The share of women ages 70–74 differs widely across countries and separately reported areas even when every observation is aligned to the same year. In the 2025 World Bank data, the median across 217 observations is 2.57% and the unweighted mean is 3.06%. The highest value is 7.43% and the lowest is 0.60%. That spread is large enough to show that a single five-year cohort can occupy a very different place in the female age structure from one population to another.
The formal World Bank series is Population ages 70-74, female (% of female population), code SP.POP.7074.FE.5Y. Its numerator is the number of women ages 70 through 74 and its denominator is the female population of all ages. A value of 6% means that about six of every 100 females are in this five-year age group. It does not mean that 6% of the total male-and-female population is 70–74, and it is not the share of all women age 70 or older. The World Bank identifies the United Nations Population Division’s World Population Prospects as the source and describes the values as midyear age-structure estimates.
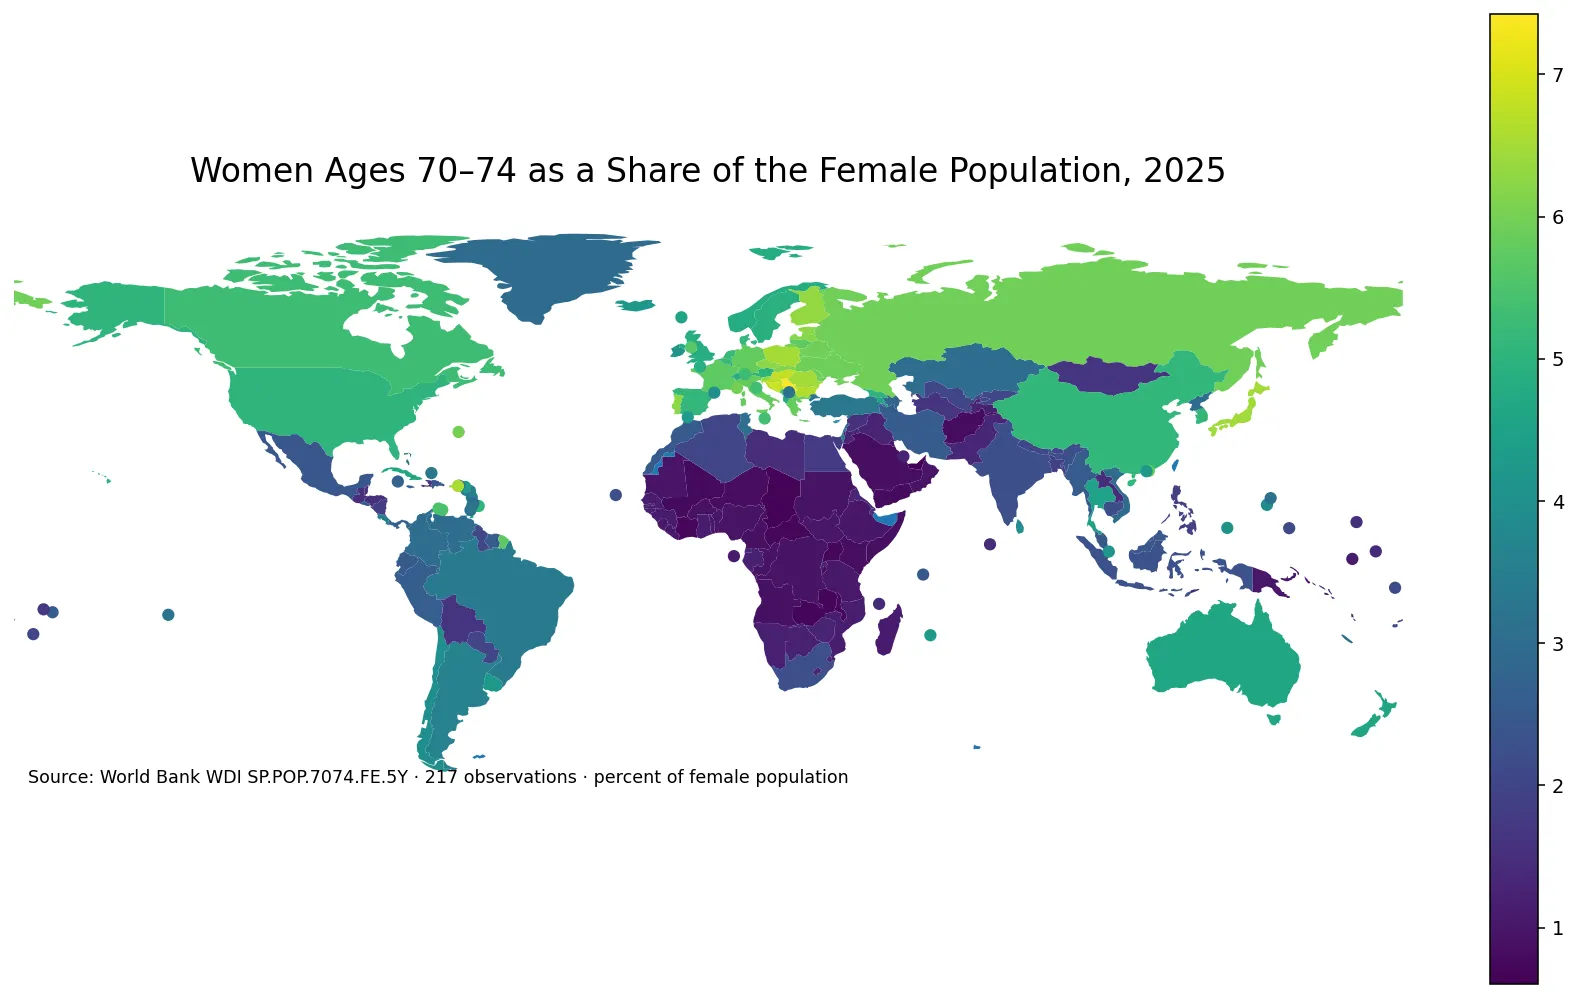
Table of Contents
This is an age-composition share, not a count of older women
A percentage can look large even when the underlying population is small. A small territory may have a high 70–74 share with relatively few women in that age band, while a populous country can contain millions of women ages 70–74 and still record a middling percentage because the female population is much larger at other ages. The indicator is therefore well suited to comparing age structure, but it should not be used as a substitute for the absolute number of women who may need health, care, housing, or pension services.
The narrow five-year band also limits what can be inferred about population aging as a whole. Two countries with the same 70–74 share can have very different numbers of women ages 65–69, 75–79, or 80 and older. A high value in this series does not guarantee a high share at every older age, and a low value does not prove that older women are scarce overall. Broader measures such as the 65+ population share or the old-age dependency ratio answer different questions.
Age structure reflects the combined history of birth cohort size, survival, migration, and the relative size of surrounding generations. The World Bank metadata notes that age-and-sex population estimates depend on demographic change through fertility, mortality, and migration. This indicator records the resulting composition; it does not separate those mechanisms. Geographic patterns can therefore be described, but assigning a single cause to a country’s percentage would go beyond the data.
The middle half of the 2025 observations lies between about 1.30% and 4.76%
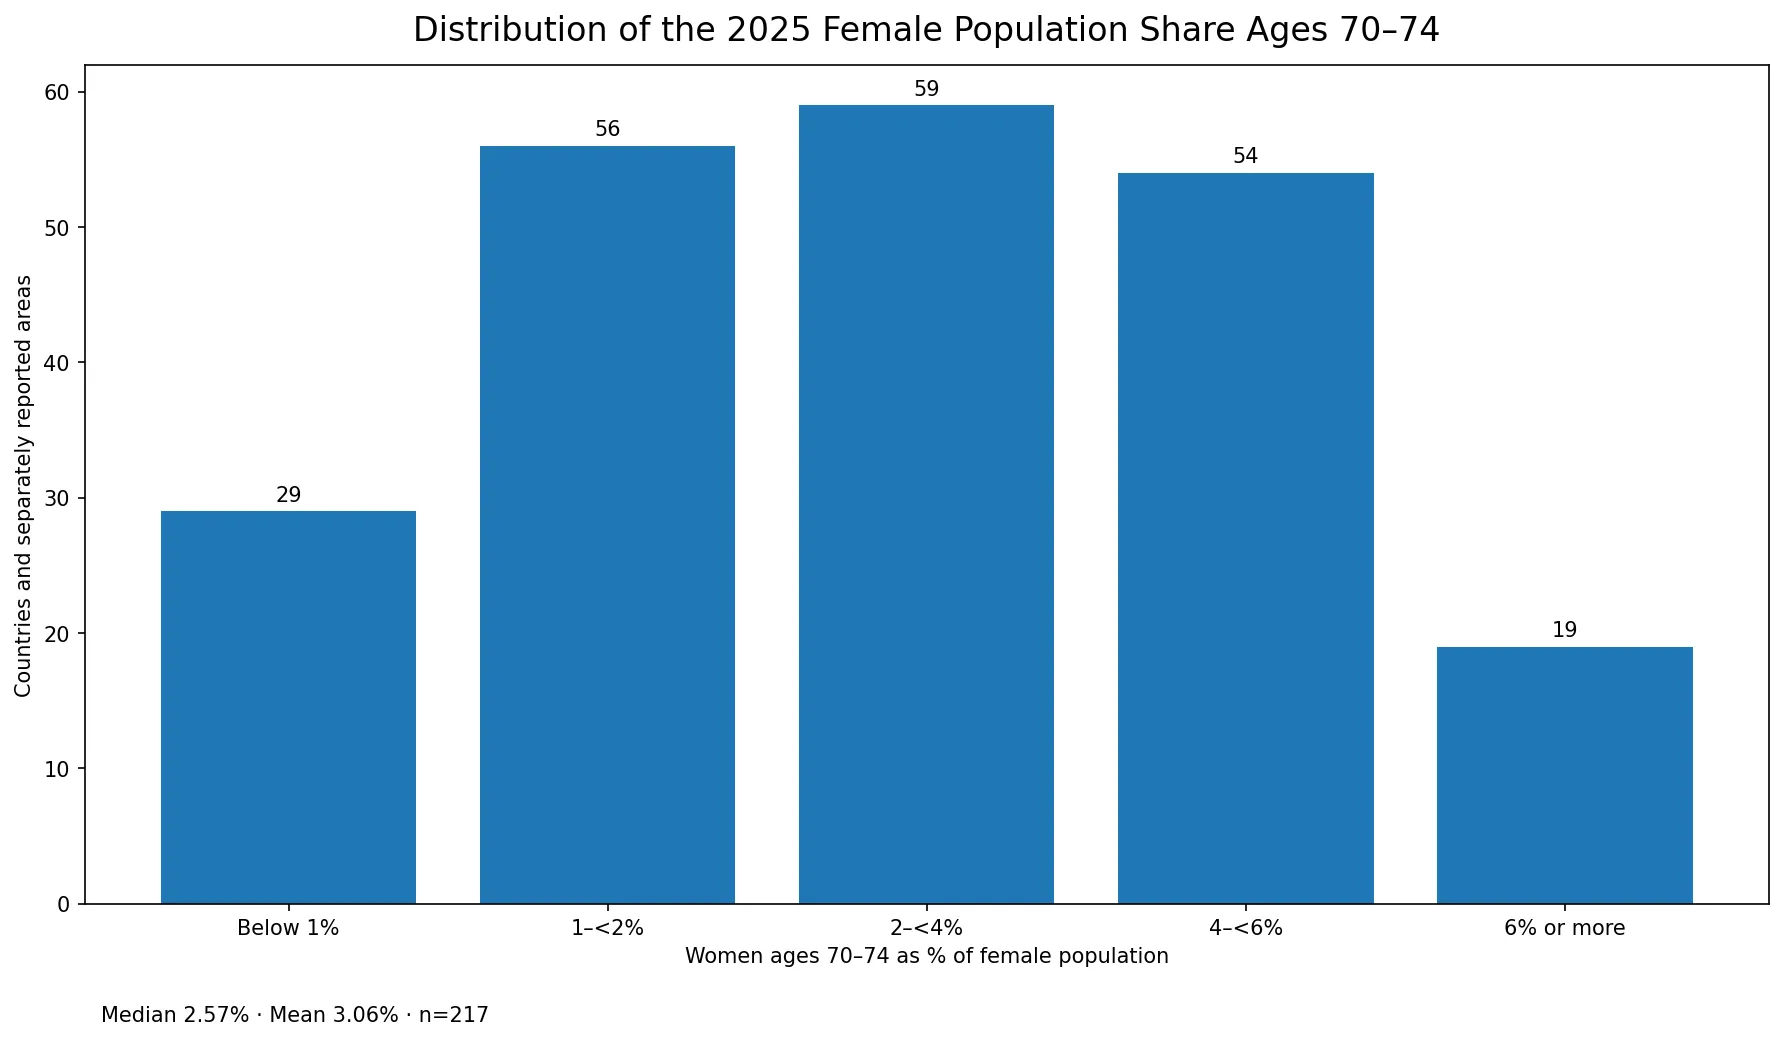
Giving each country or separately reported area equal weight, the first quartile is 1.30%, the median 2.57%, and the third quartile 4.76%. Half of the 217 observations therefore fall between roughly 1.30% and 4.76%. The simple mean of 3.06% is higher than the median because a smaller group of observations reaches 6% or more. This is not a population-weighted world female age share; it is a summary of 217 country-and-area percentages.
| 2025 share of female population | Countries and separately reported areas |
|---|---|
| Below 1% | 29 |
| 1% to under 2% | 56 |
| 2% to under 4% | 59 |
| 4% to under 6% | 54 |
| 6% or more | 19 |
The largest band is 2% to below 4%, with 59 observations. Another 56 are between 1% and 2%, and 54 fall between 4% and 6%. Twenty-nine observations are below 1%, while 19 reach 6% or more. The distribution is therefore broad rather than concentrated around a single common value, but the very highest shares are relatively uncommon.
A high-share cluster stretches across parts of Central and Eastern Europe
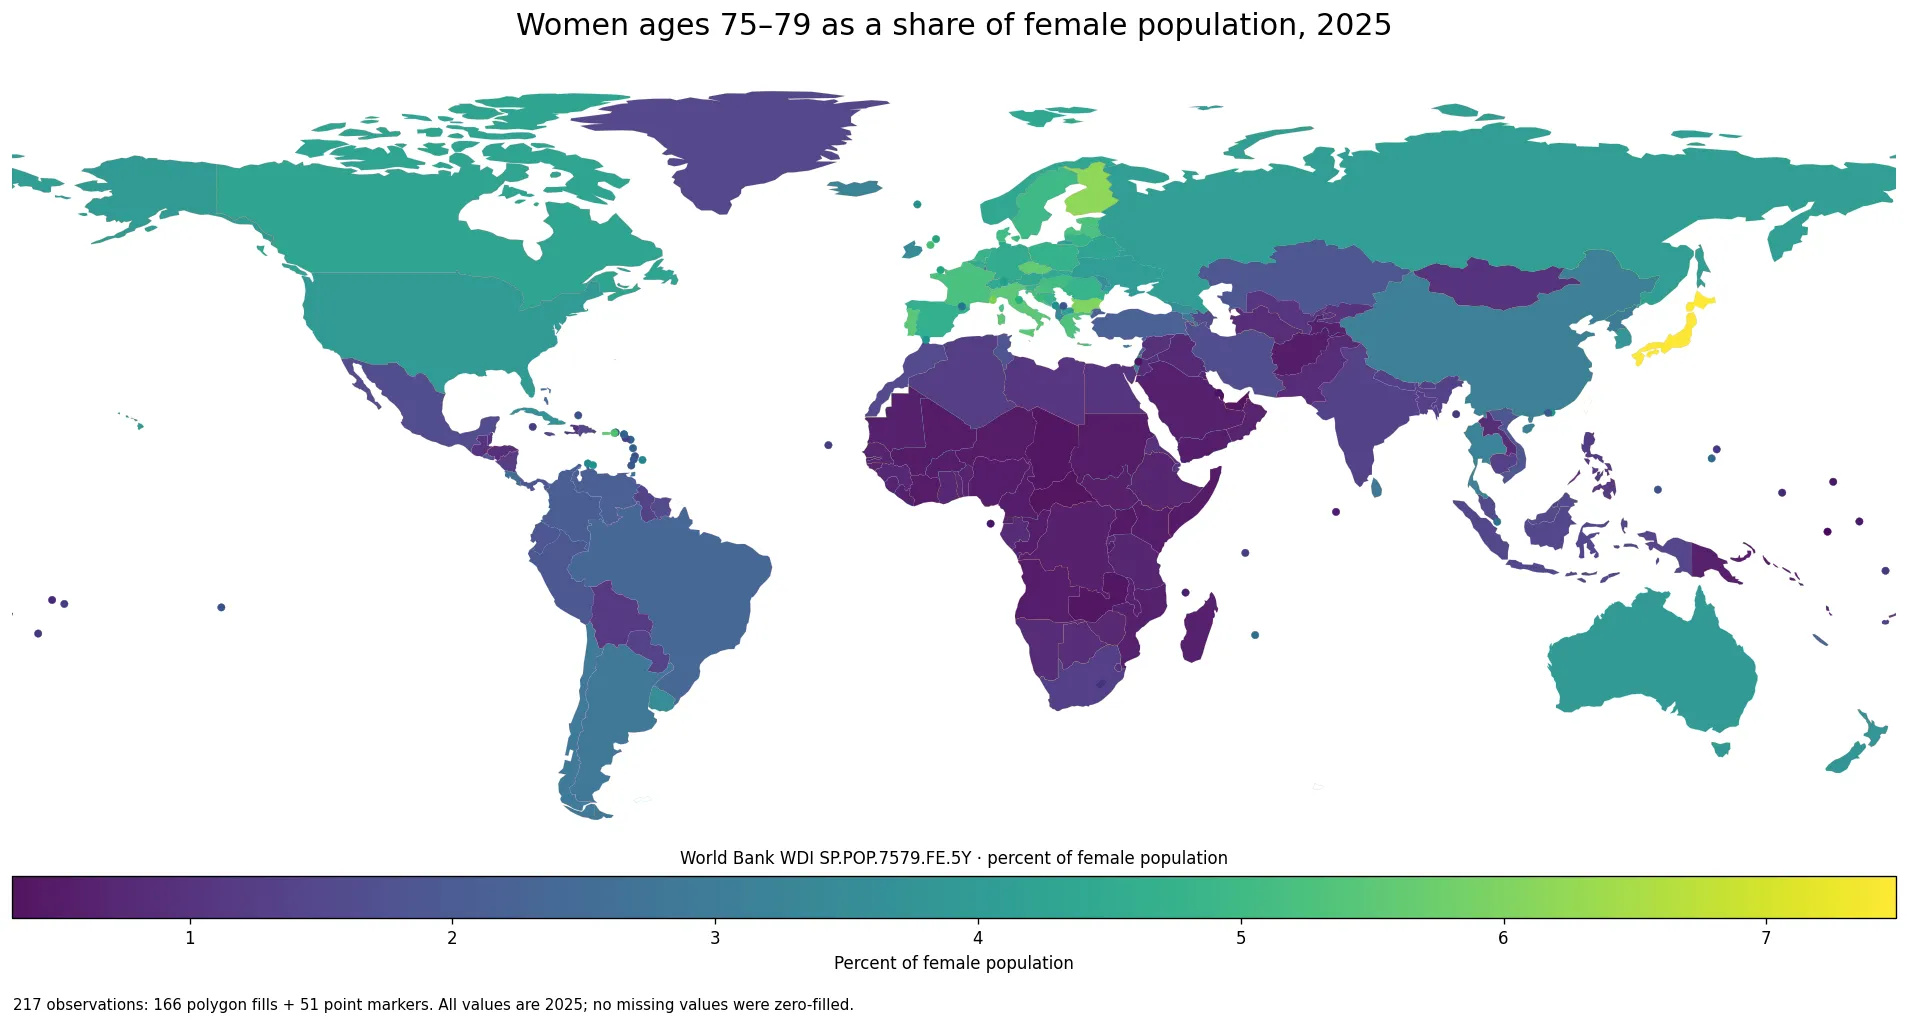
The clearest geographic concentration of high values appears across parts of Central, Eastern, and Southeastern Europe. Serbia is the highest observation at 7.43%. Bosnia and Herzegovina is 6.88%, Hungary 6.79%, Croatia 6.73%, Bulgaria 6.65%, Poland 6.51%, and Romania 6.48%. Several neighboring countries occupying the same high band makes the regional pattern visible on the map, although the series alone cannot identify a shared demographic cause.
Europe is not uniform. Portugal is 6.24% and Finland 6.31%, while Spain is lower at 5.13%. Neighboring populations can occupy different bands because past cohort sizes, survival, and migration histories are not identical. The map is most useful for locating those broad differences before turning to more detailed demographic data.
Japan is also near the top of the global distribution at 6.45%. China is 5.09%. In North America, Canada is 5.30% and the United States 5.05%, while Australia is 4.64%. These values indicate that women ages 70–74 make up a substantial part of the female population, but they do not reveal the absolute size of the cohort. A headcount series would be required for that comparison.
Very low shares appear in the Gulf and across several Sub-Saharan African countries
The two lowest observations are the United Arab Emirates at 0.60% and Qatar at 0.64%. Chad is 0.67%, Zambia 0.69%, Uganda 0.72%, the Central African Republic 0.73%, Malawi 0.73%, and Côte d’Ivoire 0.73%. In total, 29 of the 217 observations are below 1%, meaning that women ages 70–74 account for less than one woman in every 100 females in those populations.
Similar percentages do not imply similar demographic histories. A low share in a Gulf economy can be shaped by an unusually large working-age population, while a low share in a very young population can occur because younger cohorts are much larger. Migration may matter in some places and past fertility or survival patterns in others. The current series does not contain the explanatory variables needed to distinguish those mechanisms, so the safest interpretation is descriptive: the 70–74 female cohort occupies a small fraction of the female population.
| Highest observations | Share | Lowest observations | Share |
|---|---|---|---|
| Serbia | 7.43% | United Arab Emirates | 0.60% |
| Bosnia and Herzegovina | 6.88% | Qatar | 0.64% |
| Hungary | 6.79% | Chad | 0.67% |
| Croatia | 6.73% | Zambia | 0.69% |
| Bulgaria | 6.65% | Uganda | 0.72% |
The gap between the highest and lowest observations is about 6.82 percentage points, and the percentage itself differs by roughly a factor of 12.3. That does not mean one population has twelve times as many older women. The denominator is different in every country or area, so the ratio describes composition rather than headcount.
Large countries show why shares and population size answer different questions
Among large populations, Japan is 6.45%, Italy 5.81%, Germany 5.80%, France 5.74%, Canada 5.30%, Spain 5.13%, China 5.09%, and the United States 5.05%. Australia is 4.64%. Brazil is lower at 3.42%, followed by Mexico at 2.42%, India at 2.25%, South Africa at 2.23%, and Nigeria at 0.94%.
A 5% share in a very large country represents far more people than the same 5% share in a small territory. That distinction matters whenever the question shifts from age composition to service demand. Planning for health care, long-term care, housing, or pensions requires actual population counts and often additional information about health status, labor-force participation, household arrangements, and service use. This map does not provide those quantities.
The denominator is female population only
This series uses women of all ages as the denominator. The corresponding male age-band share is a separate indicator and should not be assumed to match. Sex differences in survival and migration can alter the size of an age group relative to the male or female population, so the two series answer related but distinct questions.
The measure also cannot be relabeled as the percentage of the total population that is ages 70–74. A total-population share would require both women and men ages 70–74 in the numerator and the total population in the denominator. When comparing this series with another demographic indicator, matching the age range, sex, and denominator is essential.
Using one common year removes a major international-comparison problem
All 217 observations retained for this comparison are dated 2025, and the validated table contains no missing values. That consistency matters because many international datasets combine each country’s latest available observation even when the years differ. Here, a darker or lighter value cannot be explained by one country being observed in 2021 and another in 2025.
The total of 217 rows should not be read as 217 sovereign states. The World Bank publishes some territories and separately reported areas as their own entries. On the low-resolution world boundary used for the map, 169 observations can be connected to polygons and 48 small or separately reported areas are shown as points. Their statistics remain part of the summary even when a separate polygon is impractical at this scale.
The World Bank metadata classifies the series as annual and identifies the UN Population Division’s World Population Prospects as the source. Because population estimates involve demographic estimation, small decimal-place differences should not be treated like exact performance scores. The broad bands, quartiles, and regional contrasts are more informative than claiming a meaningful gap between two countries separated by only a few hundredths of a percentage point.
Source and interpretation notes
The definition and methodological notes are available in the World Bank WDI metadata. The indicator is the percentage of the female population that is ages 70–74, based on the UN Population Division’s World Population Prospects. This comparison uses 217 observations from 2025 only; no missing value is replaced with zero and no older year is substituted for a missing 2025 value.
The most useful way to read the results is to start with the broad geographic pattern, then use the distribution and quartiles to judge how unusual an observation is, and finally compare the measure with broader aging indicators if the question concerns older populations as a whole. The share of women ages 70–74 is informative, but it is only one slice of the age structure and should not be turned into a direct measure of longevity, pension pressure, health costs, or policy quality.
Frequently Asked Questions
What does a 5% share for women ages 70–74 mean?
It means about five of every 100 females in that country or area are ages 70–74. It is not the share of the total population and not the share of all women age 70 or older.
Are all 217 observations from 2025?
Yes. Every observation used in the comparison is dated 2025, and the validated table has no missing values.
Does a high 70–74 female share prove that a country is more aged overall?
No. It describes one five-year age band. Broader measures such as the 65+ population share or old-age dependency ratio are needed to describe population aging more completely.
Is the 3.06% mean a population-weighted world share?
No. It is the simple unweighted mean of 217 country and area percentages, giving each row equal weight.
Related Articles
These directly related population-structure comparisons provide a broader context for the 70–74 female age share.
- Old-Age Dependency Ratio by Country – 2025
- Age Dependency Ratio by Country – 2025
- Young-Age Dependency Ratio by Country – 2025
Green Map creates custom-edited map images using open geographic data sources such as geoBoundaries, Natural Earth, OpenStreetMap, and government open data.
These maps are edited visual materials, not raw data files, and are provided for education, documents, presentations, and graphic reference.