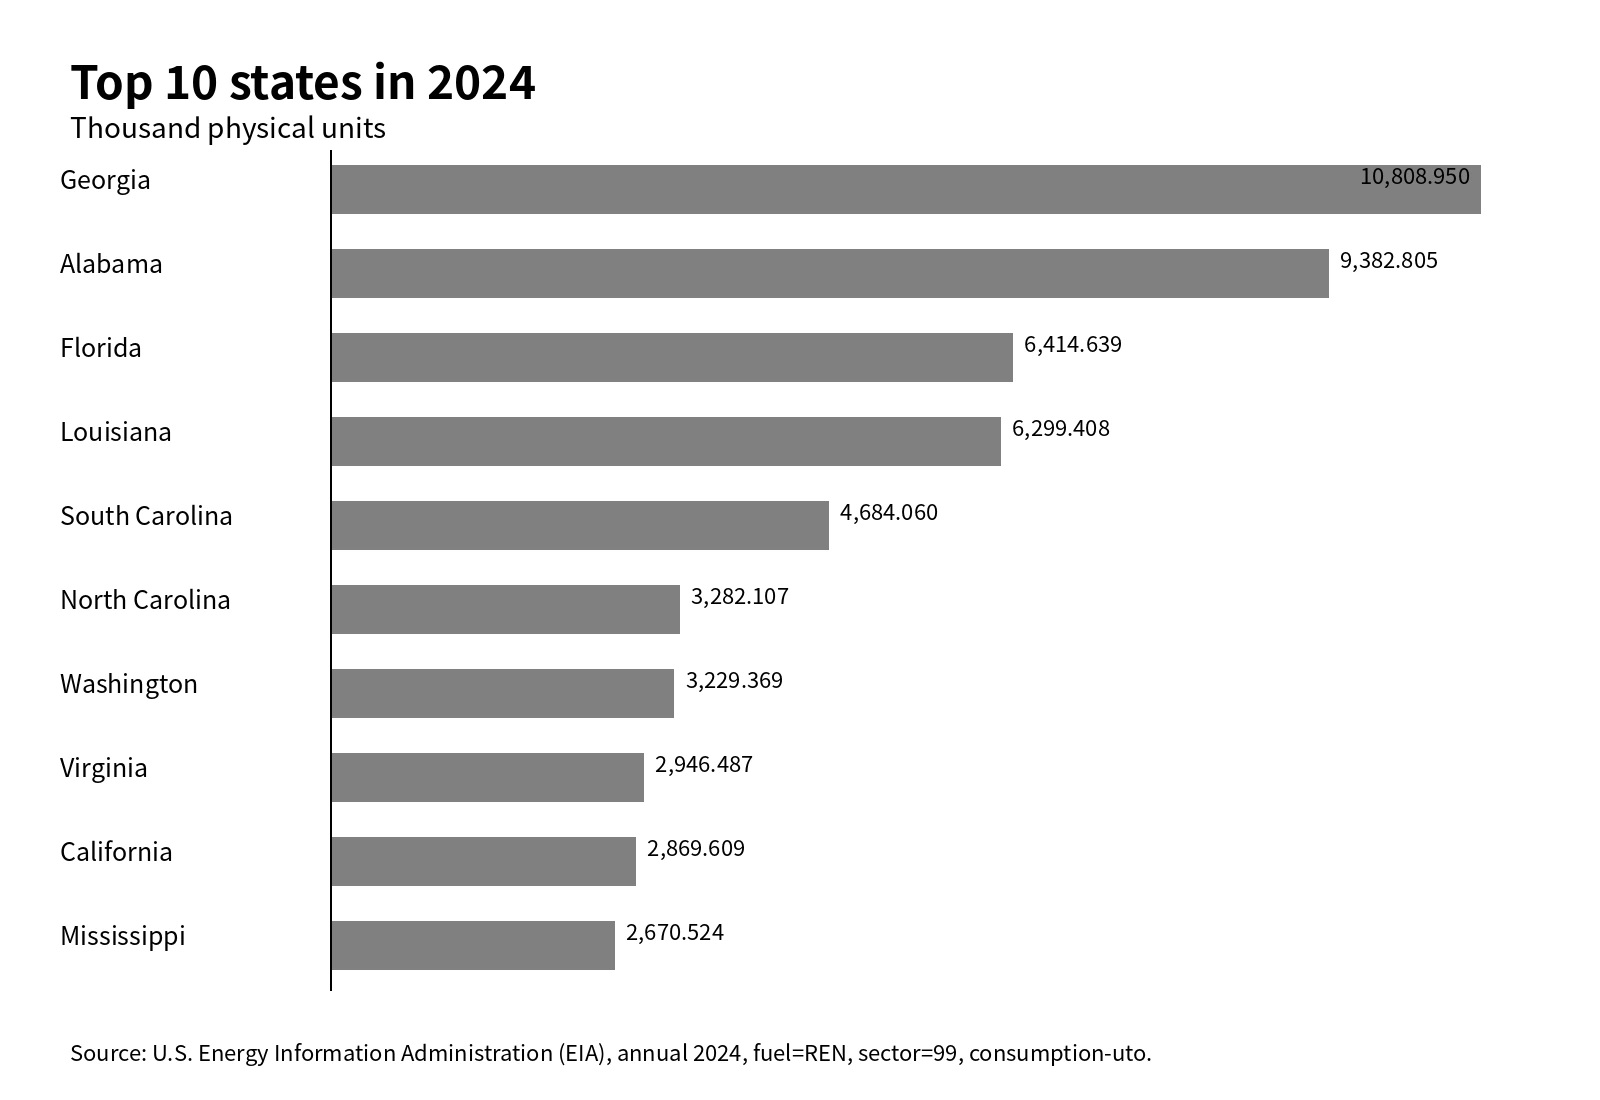
Georgia recorded the largest 2024 value in the U.S. Energy Information Administration series for renewable fuels consumed to produce useful thermal output across all electric-power sectors. Its observation was 10,808.950 thousand physical units, followed by Alabama at 9,382.805 and Florida at 6,414.639. The 51 observations covering the 50 states and the District of Columbia sum to 82,269.780 thousand physical units. Georgia therefore represents 13.1% of that series total. That percentage is useful for describing concentration inside this dataset, but it is not an energy-normalized share such as a Btu-based share of renewable energy input.
The exact EIA identity matters. This article uses fueltypeid=REN, sectorid=99 (All Sectors), field=consumption-uto, annual frequency, and 2024 observations. The published unit is “thousand physical units.” In practical terms, the series shows the physical quantity of renewable fuels reported for useful thermal output within EIA electric-power operational data, aggregated across the producer sectors represented by sector 99. Because physical units are not the same thing as common energy units, the ranking answers a narrower question than a Btu or MWh comparison would.
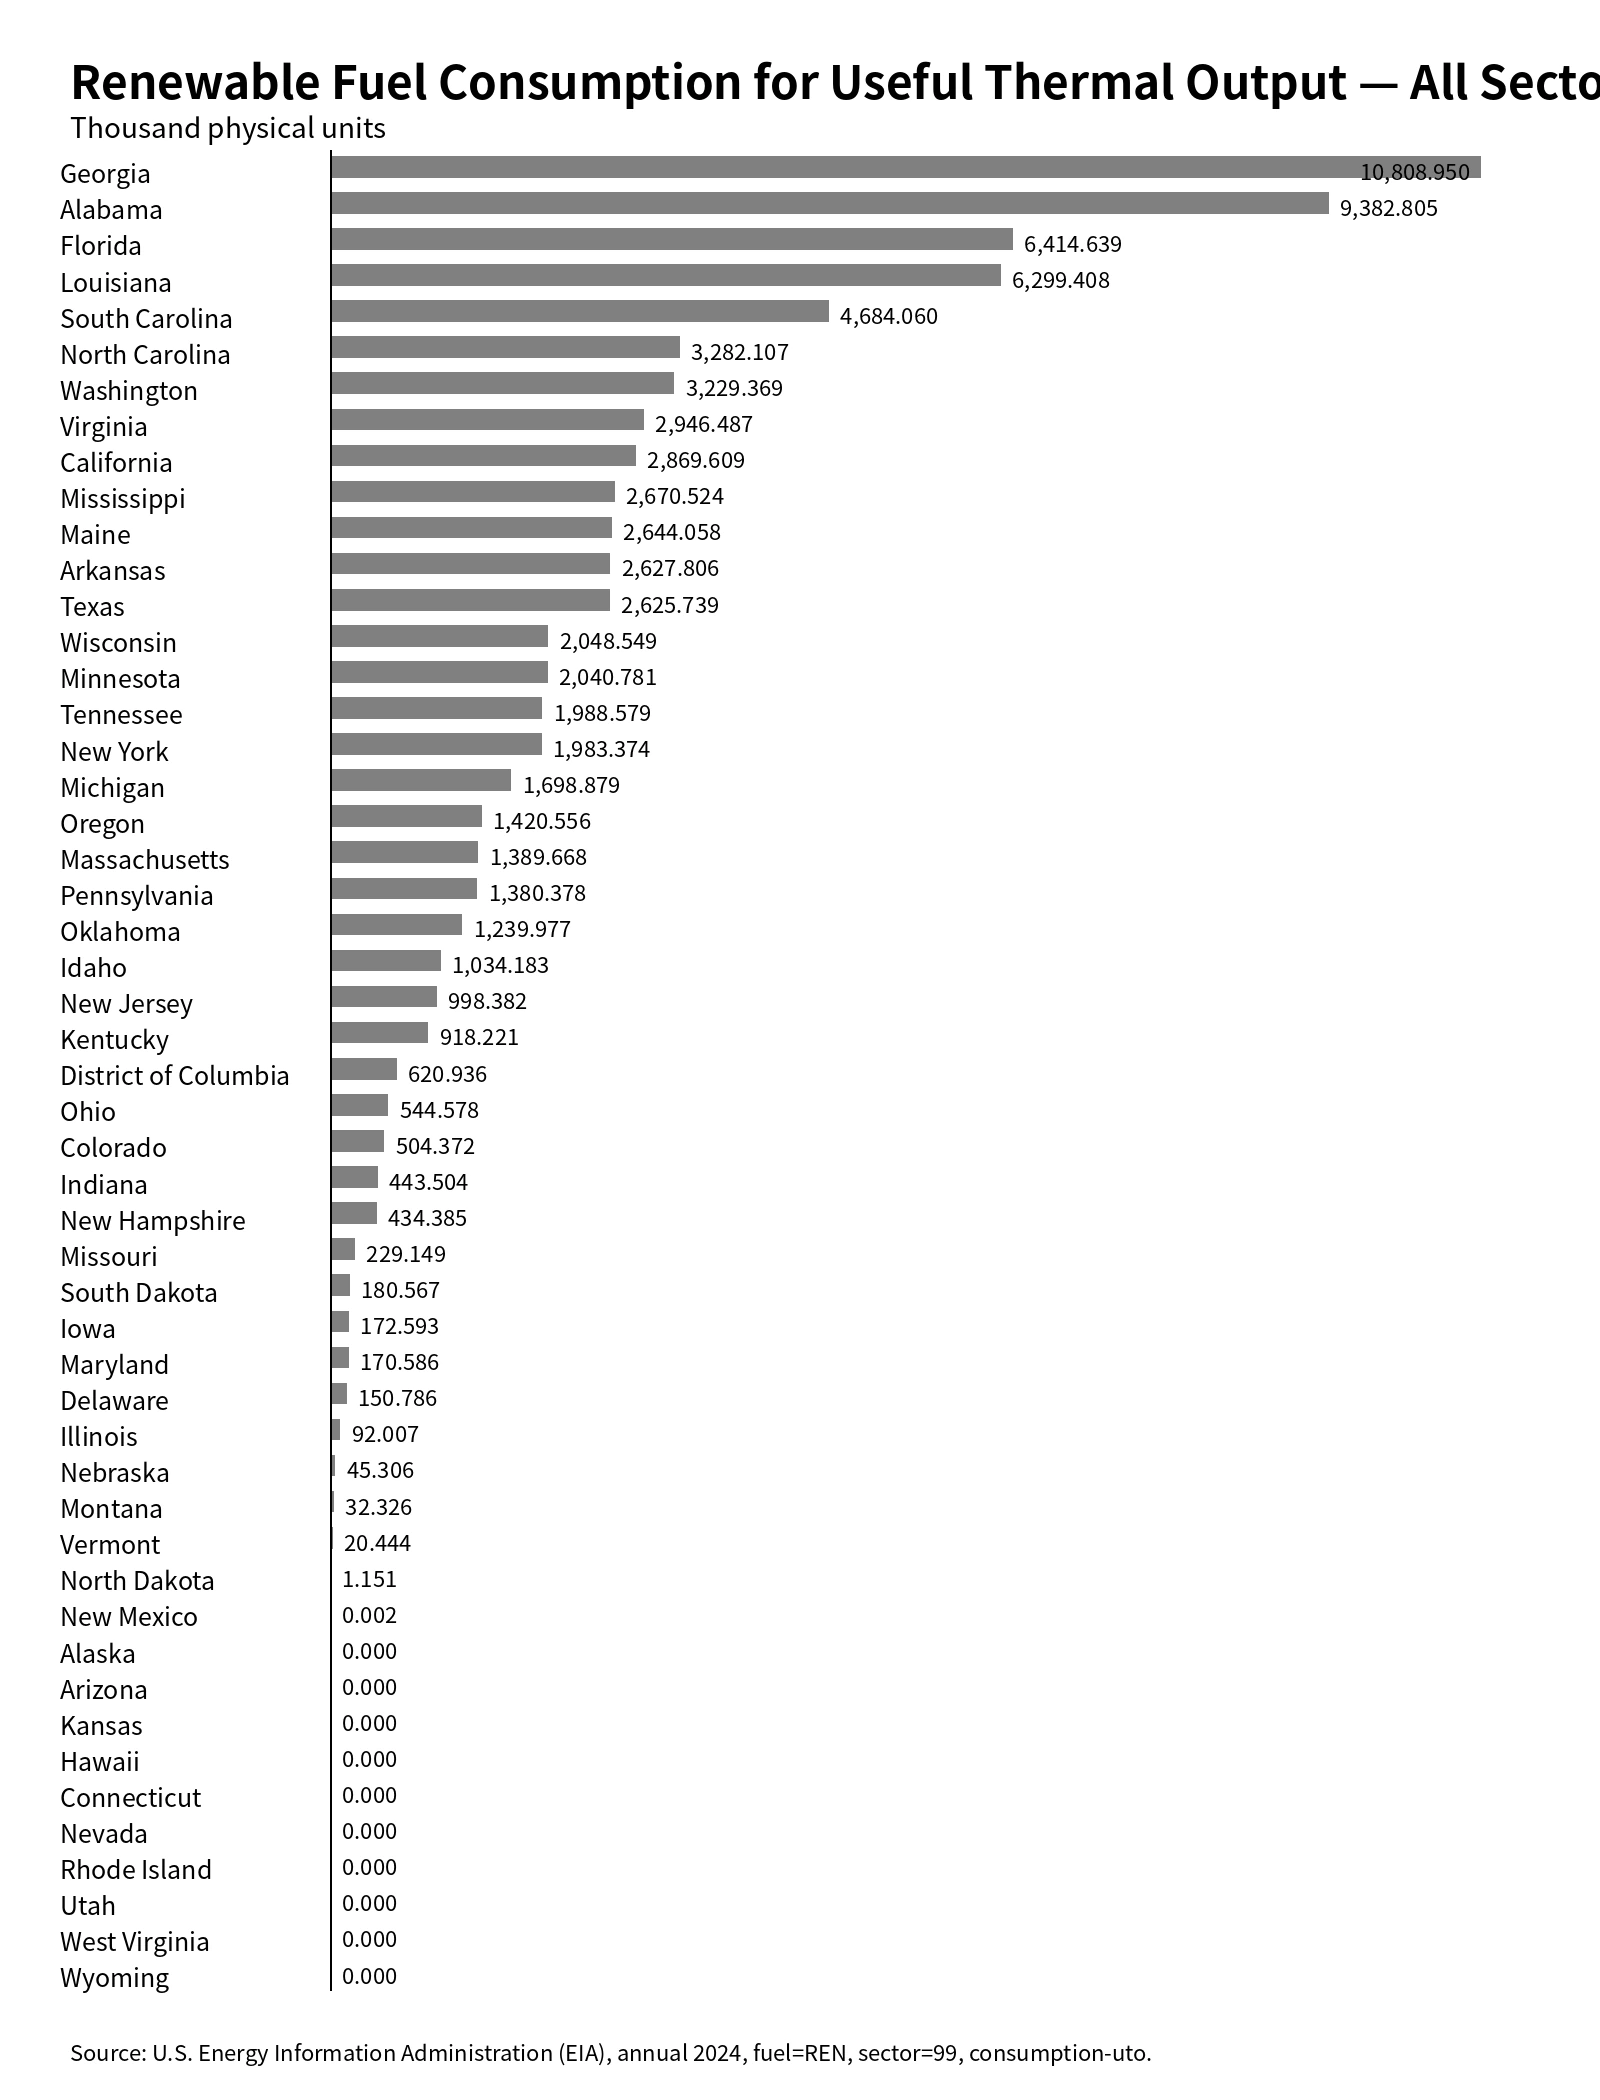
Table of Contents
Georgia and Alabama stand out at the top
The distribution is concentrated. Georgia alone accounts for 13.1% of the 51-observation sum. Georgia, Alabama and Florida together reach 32.3%. Adding Louisiana and South Carolina lifts the top-five share to 45.7%, while the ten largest observations account for 63.9%. This means a relatively small group of states represents a large part of the published physical-unit total.
A strong southern pattern is visible among the leaders. Georgia, Alabama, Florida and Louisiana together make up almost exactly 40.0% of the series sum. If South Carolina, North Carolina, Virginia and Mississippi are added, those eight states account for 56.5%. The dataset itself does not explain why this pattern occurs. Feedstock availability, biomass use, combined heat and power configurations, industrial activity and plant mix could matter, but none of those causal factors is identified in the 51-row state slice.
| Rank | State | Value (thousand physical units) | Share of 51-observation sum |
|---|---|---|---|
| 1 | Georgia | 10,808.950 | 13.1% |
| 2 | Alabama | 9,382.805 | 11.4% |
| 3 | Florida | 6,414.639 | 7.8% |
| 4 | Louisiana | 6,299.408 | 7.7% |
| 5 | South Carolina | 4,684.060 | 5.7% |
| 6 | North Carolina | 3,282.107 | 4.0% |
| 7 | Washington | 3,229.369 | 3.9% |
| 8 | Virginia | 2,946.487 | 3.6% |
| 9 | California | 2,869.609 | 3.5% |
| 10 | Mississippi | 2,670.524 | 3.2% |
The mean is much higher than the median
The arithmetic mean across the 51 observations is 1,613.133 thousand physical units, while the median is only 620.936. The mean is roughly 2.6 times the median because the upper tail contains several very large observations. The first quartile is 26.385 and the third quartile is 2,337.144, so half of the observations lie approximately within that interval. For describing a typical state, the median is therefore more informative than the mean by itself.
The lower end is also highly uneven. New Mexico reports 0.002 and North Dakota 1.151, while Vermont reports 20.444 and Montana 32.326. These are positive observations, not missing values. At the other end, Washington reaches 3,229.369, California 2,869.609 and Mississippi 2,670.524. The wide spread is one reason a simple national average can obscure the actual state distribution.
Ten published zeros are not missing data
Alaska, Arizona, Connecticut, Hawaii, Kansas, Nevada, Rhode Island, Utah, West Virginia and Wyoming are reported as 0.0 in the supplied EIA observations. Those ten zeros were retained exactly as published. No blank value was converted to zero, and no imputation was performed. A published zero and an unavailable observation are therefore treated as different conditions.
A zero in this particular series should not be generalized to mean that a state had no renewable-energy activity. The observation is specific to renewable fuel, useful thermal output, sector 99, annual 2024 data. A state can have nonzero values in electricity-generation consumption, Btu-converted consumption, net generation or a different producer sector even when this physical-unit useful-thermal-output series is zero.
Why “thousand physical units” requires caution
Physical units describe quantities of fuels, not a common energy content. Renewable fuel categories can include materials with different measurement conventions and different energy densities. For that reason, adding the state observations is useful as a descriptive total within this exact EIA series, but the result should not be labeled as total renewable energy input. A value that is twice as large in physical units does not necessarily contain exactly twice as much usable energy.
Btu-based series answer a different question because they convert fuels to a common energy basis. MWh measures electrical output, which is different again. Physical units can be helpful when examining the scale of fuel handling or reported fuel quantities, but they should not be substituted for Btu when the objective is to compare energy content. This distinction can also change state rankings between otherwise similar EIA series.
Sector 99 is the all-sectors aggregation
Sectorid=99 represents All Sectors in the EIA operational-data facet used here. That makes this dataset different from a series limited to independent power producers, electric utilities or another individual producer category. Similar-looking article titles can therefore refer to different slices even when the fuel, year and field are the same. Including the all-sectors scope in the title and metadata prevents this series from being confused with narrower sector-specific observations.
The all-sectors view is useful for seeing the broad state distribution, but it does not identify which producer category generated each state total. A high value in Georgia, for example, does not reveal how much came from utilities versus independent producers or other included categories. That decomposition would require the same fuel and field to be queried separately by sector.
Complete state ranking
The following table orders all 51 observations from largest to smallest. Values are the EIA-published 2024 annual physical-unit observations. They were not converted to Btu, MWh or another unit, and published zeros were preserved.
| Rank | State | Code | Value (thousand physical units) |
|---|---|---|---|
| 1 | Georgia | GA | 10,808.950 |
| 2 | Alabama | AL | 9,382.805 |
| 3 | Florida | FL | 6,414.639 |
| 4 | Louisiana | LA | 6,299.408 |
| 5 | South Carolina | SC | 4,684.060 |
| 6 | North Carolina | NC | 3,282.107 |
| 7 | Washington | WA | 3,229.369 |
| 8 | Virginia | VA | 2,946.487 |
| 9 | California | CA | 2,869.609 |
| 10 | Mississippi | MS | 2,670.524 |
| 11 | Maine | ME | 2,644.058 |
| 12 | Arkansas | AR | 2,627.806 |
| 13 | Texas | TX | 2,625.739 |
| 14 | Wisconsin | WI | 2,048.549 |
| 15 | Minnesota | MN | 2,040.781 |
| 16 | Tennessee | TN | 1,988.579 |
| 17 | New York | NY | 1,983.374 |
| 18 | Michigan | MI | 1,698.879 |
| 19 | Oregon | OR | 1,420.556 |
| 20 | Massachusetts | MA | 1,389.668 |
| 21 | Pennsylvania | PA | 1,380.378 |
| 22 | Oklahoma | OK | 1,239.977 |
| 23 | Idaho | ID | 1,034.183 |
| 24 | New Jersey | NJ | 998.382 |
| 25 | Kentucky | KY | 918.221 |
| 26 | District of Columbia | DC | 620.936 |
| 27 | Ohio | OH | 544.578 |
| 28 | Colorado | CO | 504.372 |
| 29 | Indiana | IN | 443.504 |
| 30 | New Hampshire | NH | 434.385 |
| 31 | Missouri | MO | 229.149 |
| 32 | South Dakota | SD | 180.567 |
| 33 | Iowa | IA | 172.593 |
| 34 | Maryland | MD | 170.586 |
| 35 | Delaware | DE | 150.786 |
| 36 | Illinois | IL | 92.007 |
| 37 | Nebraska | NE | 45.306 |
| 38 | Montana | MT | 32.326 |
| 39 | Vermont | VT | 20.444 |
| 40 | North Dakota | ND | 1.151 |
| 41 | New Mexico | NM | 0.002 |
| 42 | Alaska | AK | 0.000 |
| 43 | Arizona | AZ | 0.000 |
| 44 | Kansas | KS | 0.000 |
| 45 | Hawaii | HI | 0.000 |
| 46 | Connecticut | CT | 0.000 |
| 47 | Nevada | NV | 0.000 |
| 48 | Rhode Island | RI | 0.000 |
| 49 | Utah | UT | 0.000 |
| 50 | West Virginia | WV | 0.000 |
| 51 | Wyoming | WY | 0.000 |
What this series can and cannot tell us
- It can show which states have the largest and smallest 2024 observations in this exact renewable-fuel, useful-thermal-output, all-sectors physical-unit series.
- It can show concentration, the number of published zeros, the median, quartiles and the relative position of each state inside the 51-observation distribution.
- It cannot by itself measure renewable-energy content, net electricity generation, efficiency, cost, emissions or the detailed renewable-fuel mix.
- It cannot establish why one state is higher than another without additional plant, fuel, CHP, industrial and sector-level evidence.
The most defensible use of the series is therefore as a screening view. It identifies states worth examining more closely and provides a transparent state ranking for the published physical quantities. A deeper energy analysis should pair it with Btu-converted fuel consumption, generation output, producer-sector detail and, where available, individual fuel categories. That approach keeps the interpretation aligned with what the original measurement actually represents.
Source and calculation method
The source is the U.S. Energy Information Administration API v2, Electricity / Electric Power Operational Data. The query identity is annual 2024, data field consumption-uto, fueltypeid REN and sectorid 99. The geographic coverage is the 50 states plus the District of Columbia, producing 51 rows with a state code, state name, year and value.
All summary statistics in this article were calculated directly from those 51 observations. No missing value was zero-filled. The total of 82,269.780, the mean, median, quartiles and the top-state percentages are descriptive calculations from the supplied physical-unit series. Shares use the 51-observation sum as the denominator and should not be interpreted as energy-normalized renewable shares.
Frequently Asked Questions
Which state had the largest 2024 value?
Georgia led with 10,808.950 thousand physical units, followed by Alabama at 9,382.805 and Florida at 6,414.639.
Does Georgia’s 13.1% mean it used 13.1% of U.S. renewable energy for useful thermal output?
No. The 13.1% is Georgia’s share of the sum of this physical-unit series. It is not a Btu-normalized energy share.
Are the ten zero-valued states missing observations?
No. They are published as 0.0 in the supplied EIA data. Missing values were not replaced with zeros.
What does sector 99 mean?
It is the EIA All Sectors aggregation for this operational-data route, rather than a slice limited to one producer category.
Related Articles
Green Map creates custom-edited map images using open geographic data sources such as geoBoundaries, Natural Earth, OpenStreetMap, and government open data. These maps are edited visual materials, not raw data files, and are provided for education, documents, presentations, and graphic reference.