The share of males ages 10–14 differs sharply across countries and economies in 2025. Among 217 World Bank observations for indicator SP.POP.1014.MA.5Y, the Central African Republic has the highest value at 15.36%, while Qatar has the lowest at 3.25%. The median is 8.22%. A single five-year cohort can therefore occupy a very different share of the male population depending on the country or economy.
The denominator is the total male population, not the total population. A value of 10% means that about 10 of every 100 males are ages 10–14. Females are not included in the denominator, and males ages 5–9 or 15–19 are not included in the numerator. The indicator is therefore a measure of age composition within the male population rather than a count of school-age boys.
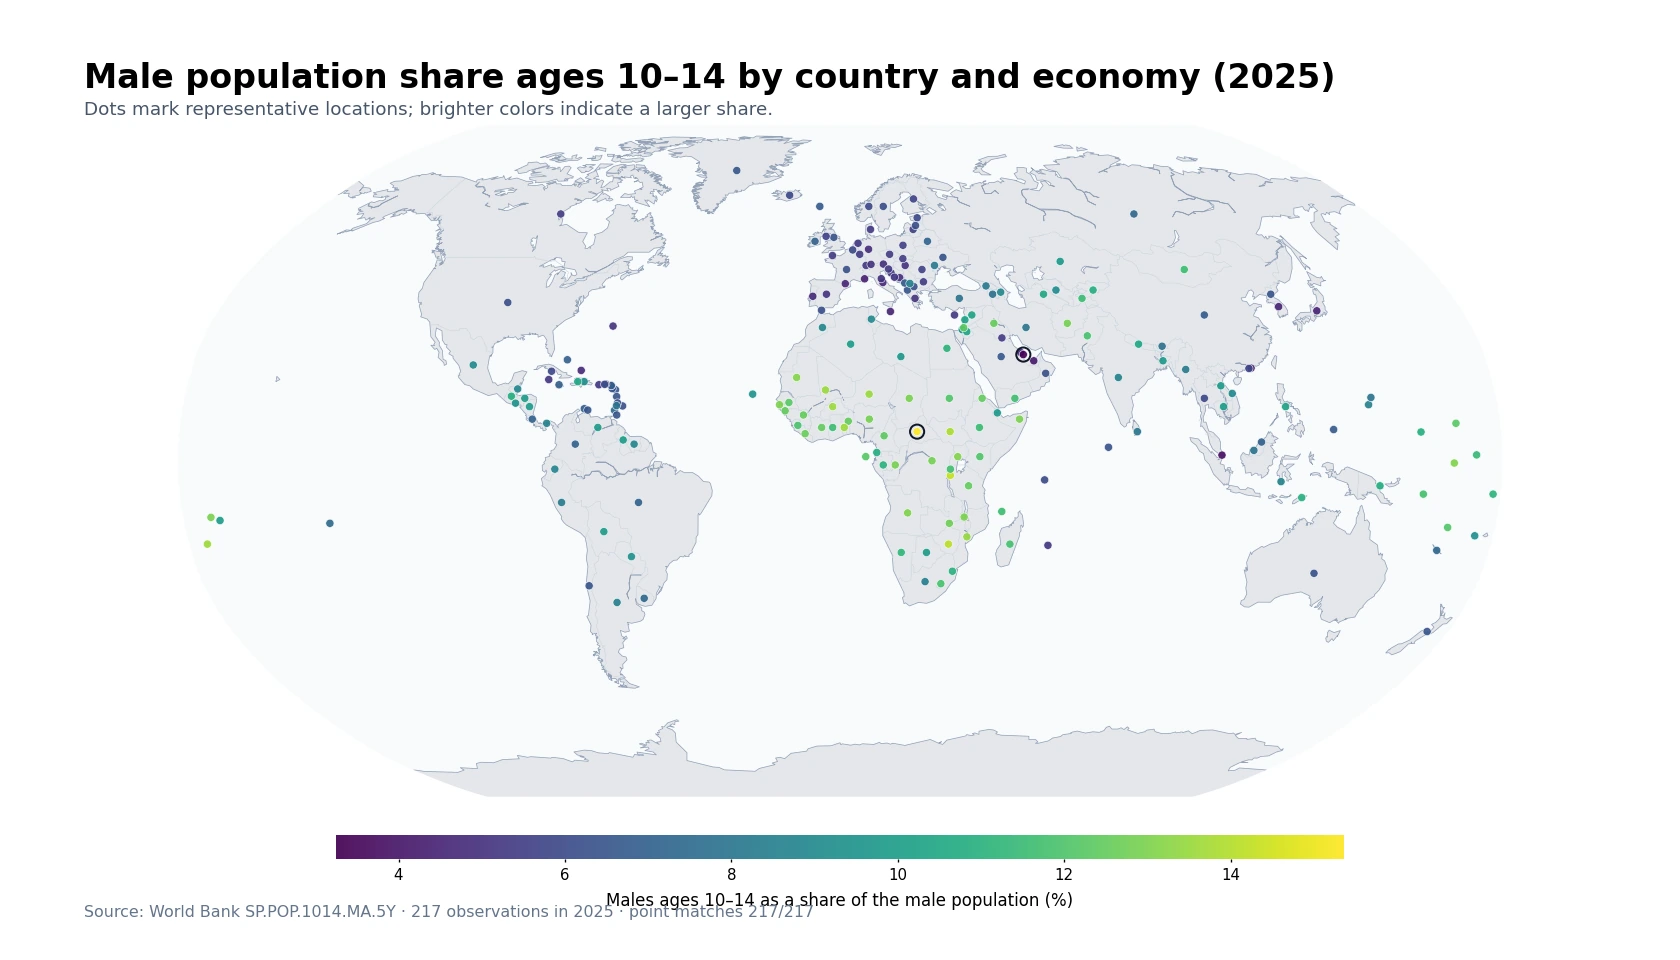
Table of Contents
High shares form a broad pattern across several parts of Africa
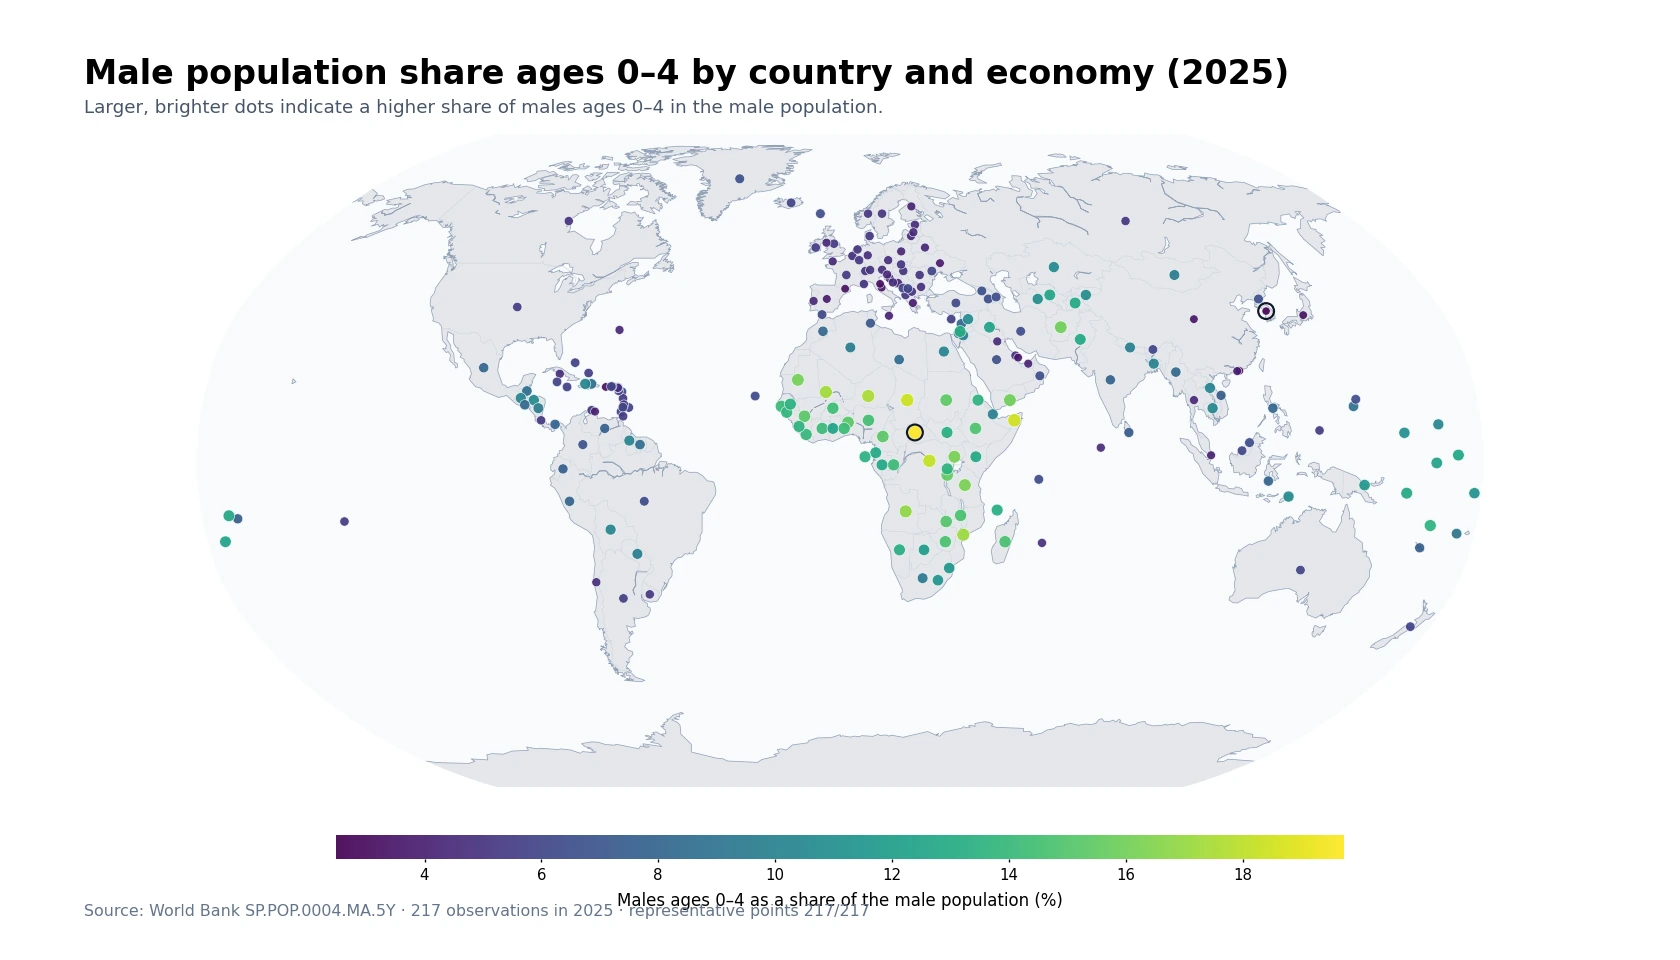
The strongest spatial pattern is the large number of high observations across Africa. The Central African Republic leads at 15.36%, followed by Burundi at 14.30%, Zimbabwe at 14.12%, South Sudan at 13.81%, Togo at 13.58%, Burkina Faso at 13.53%, Niger at 13.48%, Mali at 13.47%, and Mozambique at 13.42% among the top ten. High values appear across central, eastern, western, and southern Africa rather than being confined to one small subregion.
The Central African Republic is also surrounded by several comparatively high observations: South Sudan is at 13.81%, Chad 12.92%, the Democratic Republic of the Congo 12.82%, Cameroon 12.29%, and Sudan 12.04%. These countries are not identical, but each sits well above the global median of 8.22%. That neighborhood pattern helps explain why the map shows a broad high-share zone across parts of the continent rather than a single isolated outlier.
Pacific island economies are important exceptions near the top
The high-share group is not exclusively African. Tonga records 13.58%, making it the fifth-highest observation in the dataset. Nauru is at 13.08%, Samoa 12.95%, the Marshall Islands 12.27%, Vanuatu 12.07%, and the Solomon Islands 11.79%. These island economies can be difficult to see on a world map, but each is a distinct observation in the World Bank series and materially changes the geographic picture of the upper end.
A high percentage should not be confused with a large headcount. A small island economy with a 13% share may have far fewer boys ages 10–14 than a much larger country with an 8% or 9% share. The percentage answers a composition question: how large this age band is relative to all males. Planning school capacity, vaccination programs, or other services requires age-specific population counts as well as percentages.
Low values appear in parts of the Gulf, East Asia, and Europe
At the low end, Qatar records 3.25%, Singapore 3.75%, the United Arab Emirates 4.11%, Monaco 4.30%, Malta 4.44%, Japan 4.50%, Korea, Rep. 4.52%, Hong Kong SAR, China 4.56%, Andorra 4.59%, and Italy 4.66%. The bottom group therefore spans several distinct regions. It would be misleading to interpret the list as one coherent geographic bloc or as a performance ranking.
There is substantial variation even within the Gulf. Qatar is at 3.25% and the United Arab Emirates 4.11%, while Bahrain is at 5.07%, Kuwait 5.47%, Oman 6.26%, and Saudi Arabia 6.57%. In economies with large gender- and age-selective migration flows, the denominator can contain many working-age men, which may reduce the relative share of boys ages 10–14 even when the child population itself is not exceptionally small. The indicator alone cannot quantify how much of the difference is due to migration versus past birth patterns.
East Asia also shows wide differences within a relatively small area
East Asia and nearby economies do not move in one direction. Japan records 4.50% and Hong Kong SAR, China 4.56%, while China is at 6.73% and Macao SAR, China 5.80%. Mongolia is much higher at 11.59%. Geographic proximity therefore does not guarantee a similar male age structure. Past cohort size, survival, migration, and the size of older and younger male age groups all influence the ratio.
That variation is why a country-level map is useful. Regional averages can hide important differences between neighboring or nearby economies. At the same time, the metric should not be read as an education, health, or economic score. It describes population composition only. Additional indicators are needed to assess whether children in this age band have adequate access to schools, health services, or other resources.
The highest and lowest observations are separated by 12.11 percentage points
The gap between the Central African Republic at 15.36% and Qatar at 3.25% is 12.11 percentage points. The maximum is about 4.7 times the minimum. Put differently, males ages 10–14 account for close to one in six males at the high end, compared with roughly one in thirty-one at the low end.
| Top rank | Country or economy | Share | Bottom rank | Country or economy | Share |
|---|---|---|---|---|---|
| 1 | Central African Republic | 15.36% | 1 | Qatar | 3.25% |
| 2 | Burundi | 14.30% | 2 | Singapore | 3.75% |
| 3 | Zimbabwe | 14.12% | 3 | United Arab Emirates | 4.11% |
| 4 | South Sudan | 13.81% | 4 | Monaco | 4.30% |
| 5 | Tonga | 13.58% | 5 | Malta | 4.44% |
| 6 | Togo | 13.58% | 6 | Japan | 4.50% |
| 7 | Burkina Faso | 13.53% | 7 | Korea, Rep. | 4.52% |
| 8 | Niger | 13.48% | 8 | Hong Kong SAR, China | 4.56% |
| 9 | Mali | 13.47% | 9 | Andorra | 4.59% |
| 10 | Mozambique | 13.42% | 10 | Italy | 4.66% |
The ranking is not a ranking of absolute population. Large countries can contain many more boys ages 10–14 even when their percentage is only moderate, while small economies can rank near the top with a much smaller headcount. Any estimate of actual demand for classrooms, clinics, or youth services should therefore combine this composition measure with age-specific population totals and, where possible, subnational distribution.
The middle half of observations falls between 6.08% and 11.07%
Across all 217 observations, the mean is 8.58% and the median is 8.22%. The first quartile is 6.08% and the third quartile is 11.07%, so the middle 50% spans roughly 6.08% to 11.07%. The mean sits slightly above the median because a substantial group of observations reaches the 12% to 15% range.
| Share band | Countries and economies |
|---|---|
| Below 5% | 14 |
| 5% to <7% | 74 |
| 7% to <9% | 37 |
| 9% to <11% | 36 |
| 11% or more | 56 |
There are 14 observations below 5%, 74 from 5% to under 7%, 37 from 7% to under 9%, 36 from 9% to under 11%, and 56 at 11% or more. The 5% to under 7% band is the largest with 74 observations, yet 56 economies are at 11% or above. The distribution is therefore broad rather than tightly clustered around one global norm.
The 2025 percentage is not a direct measure of current fertility or future population growth
The size of the 10–14 cohort reflects births roughly a decade earlier, survival to these ages, migration, and the size of every other male age group in the denominator. A high 2025 share does not by itself prove that current fertility is high. Birth conditions today refer to a different cohort, and a changing denominator can raise or lower the percentage even when the number of boys ages 10–14 changes little.
A trend analysis would need multiple years of the same indicator and comparisons with adjacent age bands such as 5–9 and 15–19. Even then, interpreting the direction requires attention to migration and mortality as well as births. The cross-section used here is best suited to describing how male age structures differ in 2025, not to forecasting exactly how they will evolve.
The 217 observations are not the same as a sovereign-country count
The World Bank country-and-economy series includes sovereign states as well as separately reported territories and economies such as Hong Kong, Macao, and numerous islands. The figure of 217 should therefore not be interpreted as the number of sovereign countries in the world. It is the number of country/economy rows retained for this indicator after aggregate regional and income-group rows are excluded.
For the map, each observation is linked to a representative geographic point, with 217 of 217 successfully matched. Dots can overlap in dense areas and tiny islands, so the table and summary statistics remain the more precise way to read individual values. Map visibility does not determine whether an observation is included in the calculations.
Data source and calculation
The analysis uses 2025 observations from the World Bank API series SP.POP.1014.MA.5Y. The World Bank indicator page provides the definition and time series. The unit is males ages 10–14 as a percentage of the total male population.
Aggregate regional and income-group rows are excluded. All 217 country-and-economy rows contain a 2025 observation, so no missing value is replaced with zero and no earlier year is substituted. The maximum, minimum, rankings, mean, median, quartiles, range, and share-band counts are calculated directly from the same 217 values.
Frequently Asked Questions
What does a 12% share for males ages 10–14 mean?
It means about 12 of every 100 males in that country or economy are ages 10–14. It does not mean that 12% of the total population consists of boys in this age group.
Does a high 10–14 male share mean the country has more children in absolute numbers?
Not necessarily. This indicator is a percentage of the male population. Absolute numbers require a separate count of males ages 10–14.
Can the 2025 value show whether the share will rise or fall?
No. A trend requires multiple years of the same indicator plus context from adjacent age groups, births, migration, and changes in the total male population.
Related Maps
Green Map creates custom-edited map images using open geographic data sources such as geoBoundaries, Natural Earth, OpenStreetMap, and government open data.
These maps are edited visual materials, not raw data files, and are provided for education, documents, presentations, and graphic reference.