This dataset shows the official school-age population for early childhood educational development programmes. UNESCO Institute for Statistics indicator SAP.01 reports the number of people in the official age range for that level, both sexes combined. In plain language, it tells us how many children are in the age group associated with early childhood education.
The most important caution is that this is not enrolment. It is also not a participation rate, attendance rate or access indicator by itself. A large number does not mean a country performs better in early childhood education. In most cases it mainly reflects population size and age structure.
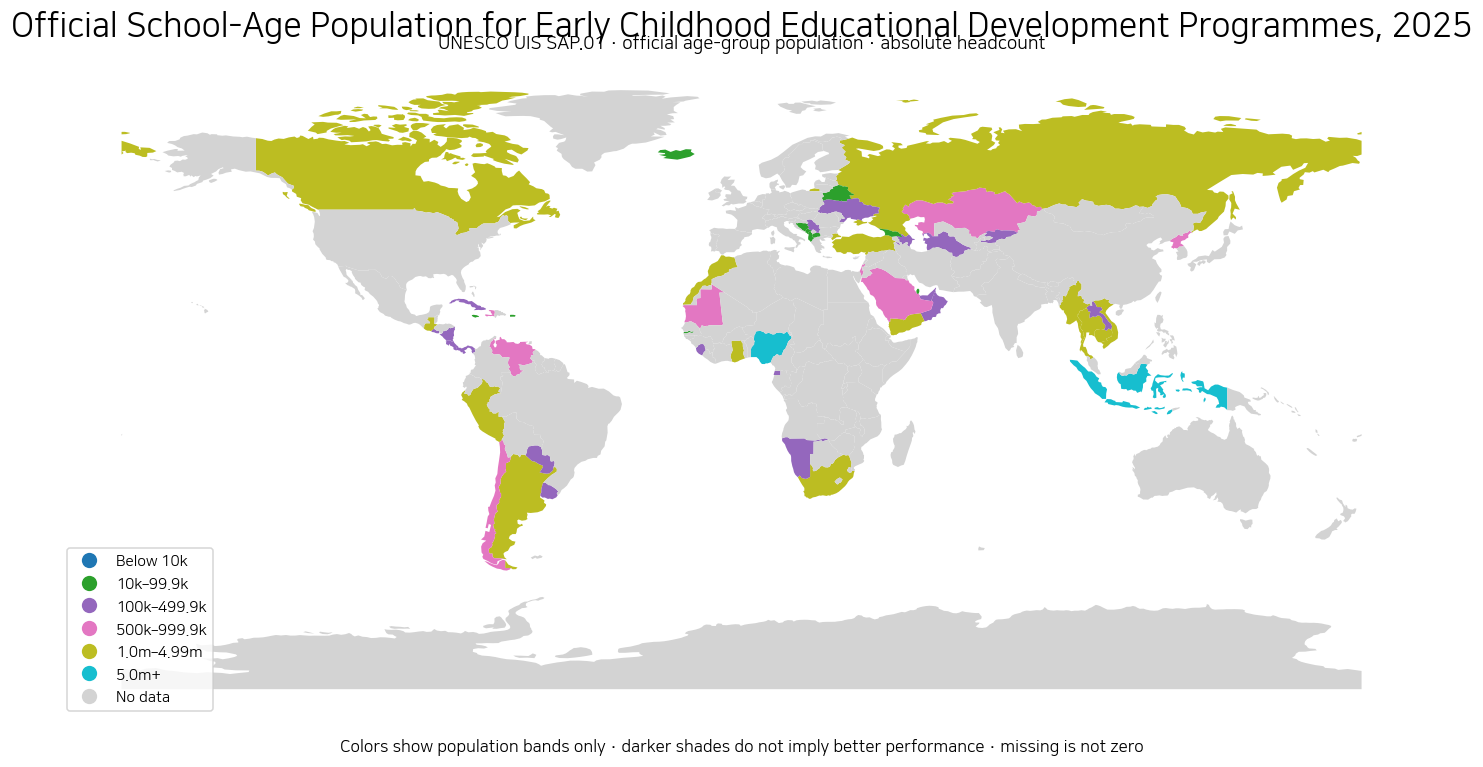
Table of Contents
This is the school-age population, not the number enrolled
Because the indicator name contains ‘school-age population’, the first task is to separate it from enrolment. A school-age population indicator counts the people who fall within the official age range for the education level. It does not automatically count how many are actually participating in programmes.
So if SAP.01 is 2 million, that does not mean 2 million children are enrolled in early childhood programmes. To measure actual participation, we would need an enrolment count, a participation rate or another access indicator. This distinction matters because absolute age-group size and participation intensity answer different policy questions.
A country with a large official early-childhood school-age population can still have low participation if only a fraction of that population is enrolled. Conversely, a small country can have a small absolute population but still achieve high coverage. SAP.01 is therefore best read as a scale-of-demand indicator rather than a performance measure.
The 2025 same-year extract covers 75 countries and areas
The current extract contains 75 observations, all dated 2025. That same-year alignment is helpful, but the dataset is far from universal. Several familiar large economies, including Korea, the United States, China, Japan, Germany and France, are absent from this 2025 set.
Blank map areas should therefore be interpreted as missing observations, not as zero children. Likewise, the ranking is only a comparison among the 75 available 2025 observations rather than a complete world ranking.
Sixteen observations exceed 1 million, but only two exceed 10 million
Among the 75 observations, 16 are at or above 1 million. Only 2 exceed 10 million, and 18 are below 10 thousand. The median is 239,745 and the mean is 1,242,153.
The sum of the 75 reported observations is about 93,161,531. But that total should not be mistaken for a complete global figure because many countries are not in this same-year extract.
Nigeria and Indonesia are above 20 million
Nigeria has the largest reported population at 26,829,458, followed by Indonesia at 22,160,700. Viet Nam is around 4.09 million, Yemen about 4.00 million, South Africa 3.48 million, Türkiye 3.15 million, Myanmar 2.62 million and the Russian Federation 2.57 million.
Those leading values mainly reflect demographic scale. Countries with large child populations or relatively young age structures will tend to appear near the top. It would be a mistake to present this ordering as a ranking of early-childhood-education quality or achievement.
| Rank | Country or area | ISO3 | 2025 population |
|---|---|---|---|
| 1 | Nigeria | NGA | 26,829,458 |
| 2 | Indonesia | IDN | 22,160,700 |
| 3 | Viet Nam | VNM | 4,093,599 |
| 4 | Yemen | YEM | 3,999,637 |
| 5 | South Africa | ZAF | 3,479,460 |
| 6 | Türkiye | TUR | 3,148,953 |
| 7 | Myanmar | MMR | 2,617,289 |
| 8 | Russian Federation | RUS | 2,570,035 |
| 9 | Ghana | GHA | 2,555,415 |
| 10 | Morocco | MAR | 1,874,052 |
| 11 | Peru | PER | 1,604,451 |
| 12 | Argentina | ARG | 1,493,569 |
| 13 | Guatemala | GTM | 1,479,000 |
| 14 | Thailand | THA | 1,356,944 |
| 15 | Canada | CAN | 1,097,406 |
Canada is above 1 million, while some small territories are in the thousands
Canada records 1,097,406 and ranks 15th in this extract. At the low end, Niue has 74, the Cayman Islands 1,791, Liechtenstein 1,867 and Dominica 2,125. The difference between the largest and smallest observations is so large that banded mapping is more informative than trying to visually compare every raw value on one continuous scale.
That is why the map groups observations into readable categories such as below 10 thousand, 10 thousand to 99.9 thousand, 100 thousand to 499.9 thousand, 500 thousand to 999.9 thousand, 1 million to 4.99 million and 5 million or more.
| Lowest-rank side | Country or area | ISO3 | 2025 population |
|---|---|---|---|
| 1 | Niue | NIU | 74 |
| 2 | Montserrat | MSR | 120 |
| 3 | Nauru | NRU | 308 |
| 4 | San Marino | SMR | 592 |
| 5 | Gibraltar | GIB | 966 |
| 6 | British Virgin Islands | VGB | 994 |
| 7 | Saint Kitts and Nevis | KNA | 1,092 |
| 8 | Sint Maarten (Dutch part) | SXM | 1,223 |
| 9 | Cayman Islands | CYM | 1,791 |
| 10 | Liechtenstein | LIE | 1,867 |
| 11 | Dominica | DMA | 2,125 |
| 12 | Marshall Islands | MHL | 2,440 |
A large absolute population does not mean high participation
SAP.01 is closely related to the denominator of participation statistics. If one country has 4 million children in the official age range and another has 400 thousand, their resource needs can differ greatly even if both target the same participation rate.
But the indicator alone cannot tell us whether those children are actually attending early childhood programmes. To evaluate participation or access, we need enrolment or rate-based indicators. This is why the article avoids language that equates a large SAP.01 value with better educational provision.
The indicator is useful for understanding policy demand
Although it is not a performance metric, the school-age population is still highly useful. A country with a target of 80% participation needs very different numbers of classrooms, teachers and budget resources depending on whether the target population is 200 thousand, 2 million or 20 million.
The value becomes even more informative when read together with other indicators. Combined with enrolment, it can show what share of the relevant age group participates. Combined with pupil-teacher ratios, it can help readers think about the scale of staffing needs.
The mean is not a ‘global average early-childhood population’
The simple mean is 1,242,153, the median 239,745, the first quartile 11,997 and the third quartile 722,424. These are unweighted summaries across the 75 rows.
They do not represent the average size of the early-childhood school-age population for the whole world. A tiny territory and a populous country count as one row each, and many countries are missing from the extract. The summaries describe the distribution of the reported 2025 observations only.
Korea is absent from this 2025 set
The Republic of Korea does not have a row in the supplied 2025 dataset. That absence should not be interpreted as zero. The article keeps missing and zero distinct rather than filling gaps with older or guessed values.
That principle also improves the map. A blank area may look less satisfying than a fully colored world, but it is more honest and analytically safer than inventing a number. This is one of the visual-quality rules being applied more carefully.
A plain-language reading of the long indicator name
The official name ‘School age population, early childhood educational development programmes, both sexes (number)’ is accurate but cumbersome. For public reading, it helps to restate it as the number of children in the official age range for early childhood education.
The article therefore keeps the full official meaning in the explanatory sections while using a simpler public title. That way the title stays accessible without sacrificing definition accuracy.
Data source and interpretation
The country values come from the UNESCO UIS Data Browser for SAP.01, using the 2025 observations. The source metadata stored the unit generically as “value”, but this article clarifies the public meaning as a population headcount.
The internal provider tag in the source package named the World Bank, but the actual official authority is UNESCO Institute for Statistics, so the provider tag is corrected to UNESCO UIS. The map uses population bands only and does not imply that darker colors indicate higher educational success.
Frequently Asked Questions
Is the early-childhood school-age population the same as enrolment?
No. It counts the people in the official age range for early childhood educational development programmes. It does not show how many are actually enrolled or participating.
How many countries and areas exceed 1 million?
Sixteen of the 75 reported 2025 observations are at or above 1 million, while only two exceed 10 million.
Does a large value mean better early childhood education?
No. Large values mainly reflect demographic scale and age structure. Participation, enrolment and access need separate indicators.
Why is Korea missing from the table?
The supplied 2025 SAP.01 extract does not include a Korea observation. Missing data are not treated as zero and are not replaced with another year's value.
Related Articles
- Children per Trained Pre-Primary Teacher
- Out-of-School Rates for School-Age Children and Youth
- Post-Secondary Attainment for Adults 25+
Green Map creates custom-edited map images using open geographic data sources such as geoBoundaries, Natural Earth, OpenStreetMap, and government open data.
These maps are edited visual materials, not raw data files, and are provided for education, documents, presentations, and graphic reference.