Maine had the highest 2025 average heat content for petroleum liquids in the EIA Electric Power Sector Non-CHP state series, at 6.3617 MMBtu per barrel. Hawaii followed at 6.1155, while Massachusetts and New Hampshire were almost tied just above 6.01. Alaska was the lowest state at 5.0321. The comparison holds the U.S. Energy Information Administration filters fixed at annual 2025, heat-content, fueltypeid=PEL and sectorid=90, producing one observation for each of the 50 states.
This metric describes energy per barrel, not the number of barrels burned. It therefore answers a different question from petroleum consumption, net generation, or power-plant efficiency. A state can have a relatively high heat-content value while using little petroleum, and another state can consume more barrels while having a lower average heat content. The safest interpretation is as a state-level fuel conversion characteristic within this specific EIA sector and fuel definition.
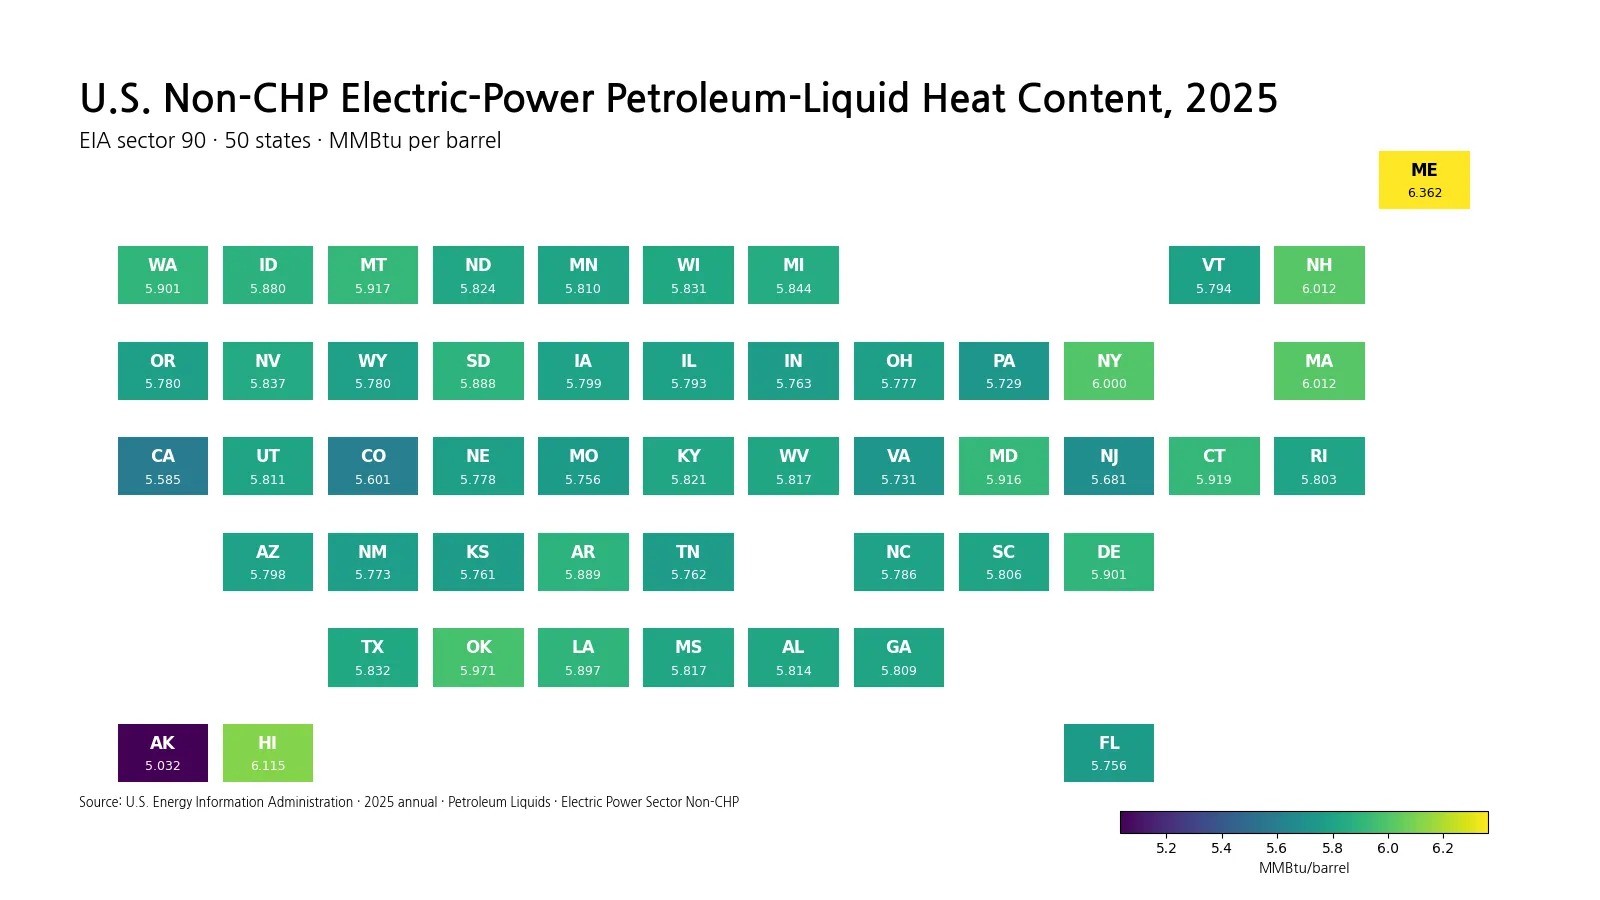
Table of Contents
Maine stood clearly above the rest of the 2025 distribution
At 6.3617 MMBtu per barrel, Maine was 0.2462 above second-place Hawaii. Massachusetts at 6.0121 and New Hampshire at 6.0118 were nearly identical, and New York was just below the 6.0 line at 5.9999. Only four states were at or above 6.0. That makes Maine the most visible high-end observation, but it does not mean the state led the country in petroleum use.
The median of the 50 state averages was 5.8103 MMBtu per barrel and the simple mean was 5.8214. Those two measures are close, which is consistent with a distribution in which most observations cluster near the center. Maine raises the upper end, while Alaska extends the lower tail. Looking at the middle of the distribution is therefore more informative than treating the maximum-to-minimum range as typical variation.
This is not a duplicate of the existing 2025 electric-power heat-content series
A related Green Map article already covers 2025 petroleum heat content for the broader Electric Power sector. The current dataset is distinct. The earlier article uses EIA fueltypeid=PET and sectorid=98, whereas this #14255 series uses fueltypeid=PEL for Petroleum Liquids and sectorid=90, labeled Electric Power Sector Non-CHP. The year alone is not enough to establish that two series are the same.
The numerical results confirm the distinction. In the sector 98 article, Ohio appears as the highest state, but Ohio is only 5.7767 MMBtu per barrel in this sector 90 series. Maine is highest here. When two EIA electricity series have similar names, the field, fuel facet, sector facet, unit and year all need to match before values are compared or merged.
The 10 highest states were concentrated around 5.9 to 6.1 MMBtu per barrel
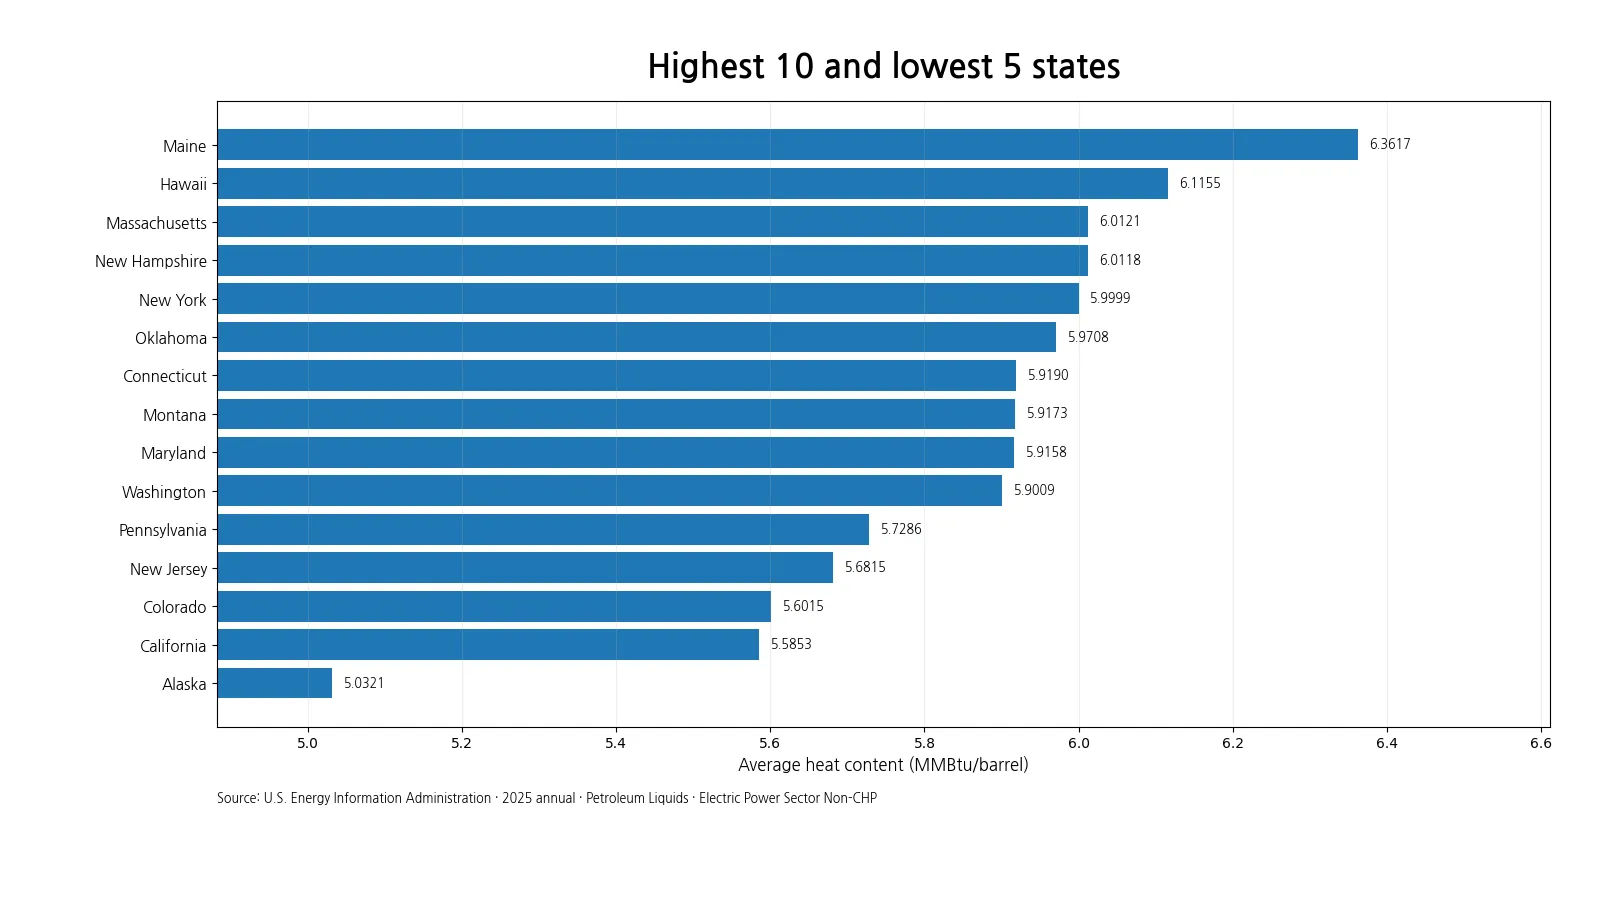
Below Maine, the upper group was comparatively tight. Hawaii, Massachusetts and New Hampshire were above 6.01; New York was 5.9999; Oklahoma was 5.9708. Connecticut, Montana and Maryland were between 5.9158 and 5.9190. Washington at 5.9009 narrowly held the tenth position, with Delaware only 0.0001 lower. The tiny gaps among several states are a reminder not to overstate rank differences when the underlying values are nearly the same.
| State | Average heat content (MMBtu/barrel) |
|---|---|
| Maine | 6.3617 |
| Hawaii | 6.1155 |
| Massachusetts | 6.0121 |
| New Hampshire | 6.0118 |
| New York | 5.9999 |
| Oklahoma | 5.9708 |
| Connecticut | 5.9190 |
| Montana | 5.9173 |
| Maryland | 5.9158 |
| Washington | 5.9009 |
Most states sat inside a narrow central band
Forty-five of the 50 states were between 5.5 and 6.0 MMBtu per barrel. Forty-seven were within plus or minus 5% of the median. The first quartile was 5.7770 and the third quartile was 5.8889, giving an interquartile range of only 0.1119. Half of all states therefore occupied a band only about eleven hundredths of an MMBtu per barrel wide.
The sample standard deviation of the 50 state values was about 0.1667 MMBtu per barrel, equal to roughly 2.86% of the mean. That is useful as a descriptive measure of dispersion, but it should not be turned into a claim that petroleum products were chemically identical across states. The dataset contains state-level averages and does not expose the product mix, plant-level weights, or operating conditions that produced each average.
Alaska widened the lower tail more than any other state
Alaska was lowest at 5.0321 MMBtu per barrel. California was next at 5.5853, followed by Colorado at 5.6015, New Jersey at 5.6815 and Pennsylvania at 5.7286. The full Maine-to-Alaska range was 1.3296 MMBtu per barrel. Once Alaska is set aside, the lower end moves back toward the main group quickly, so a large part of the total range comes from a single low observation.
| State | Average heat content (MMBtu/barrel) |
|---|---|
| Alaska | 5.0321 |
| California | 5.5853 |
| Colorado | 5.6015 |
| New Jersey | 5.6815 |
| Pennsylvania | 5.7286 |
Nothing in that low ranking indicates that Alaska consumed the least petroleum or generated the least electricity. Heat content is an intensity-like conversion factor expressed per barrel. To compare quantities of fuel, analysts need a consumption series in barrels or an energy-consumption series. To compare output, they need generation data. Keeping those denominators separate is essential when reading state rankings.
Heat content should not be used as a proxy for consumption or efficiency
A simple example shows why the distinction matters. If two states each consumed 1,000 barrels, a 6.0 MMBtu-per-barrel fuel average would correspond to more input energy than a 5.6 MMBtu-per-barrel average. But if the second state consumed twice as many barrels, its total energy input could still be much larger. Heat content tells us the energy density of the average barrel; it does not supply the quantity of barrels.
The same separation applies to efficiency. Power-plant efficiency requires a relationship between energy input and electricity output, commonly expressed through measures such as heat rate. A state heat-content factor alone has no generation denominator, so it cannot show how efficiently the fuel was converted into electricity. A higher MMBtu-per-barrel number is not a performance score.
The simple mean of the 50 state averages, 5.8214, also should not be interpreted as a consumption-weighted national average. States consume very different petroleum volumes. A national weighted measure would require those volumes or a published national EIA aggregate. The mean used here is only a descriptive summary of the 50 state observations.
The state values show outcomes, not the cause of the differences
Differences in average heat content can be influenced by the mix of petroleum products consumed, which facilities used them, and the way activity was distributed during the year. However, the state slice does not contain the product-level composition or plant-level weights needed to identify a cause. It would therefore be speculative to attribute Maine’s high value or Alaska’s low value to a specific fuel product without additional EIA detail.
For analytical work, this series can still be useful when paired carefully with a matching petroleum-consumption dataset. State-specific heat-content factors can matter when physical quantities are converted to energy quantities. The key condition is identity matching: the same year, fuel definition, sector definition and geographic scope should be used. Combining sector 90 heat-content factors with a different sector’s consumption values would mix populations.
What the 2025 state slice cannot establish
- It does not measure the number of petroleum barrels consumed in each state.
- It does not rank electricity generation or power-plant efficiency.
- It does not explain which petroleum products or plant-level operations caused a state value to be high or low.
- It does not support a 2024-to-2025 trend calculation because the verified file used here contains only 2025.
- It covers the 50 states and does not include a District of Columbia observation.
Source and calculation notes
The source is the U.S. Energy Information Administration Open Data system, specifically the Electric Power Operational Data route. The filters are annual frequency, 2025, heat-content, Petroleum Liquids (PEL), and Electric Power Sector Non-CHP (sector 90). The cleaned state slice contains 50 observations. Missing values were not replaced with zeros.
All rankings and descriptive statistics in this article were calculated directly from those same 50 values. The petroleum heat-content values are presented on the familiar EIA scale of million Btu per barrel, written here as MMBtu/barrel. The tile visualization and the extreme-state bar chart were generated from the state values rather than copied from an external chart.
The main 2025 pattern is straightforward: Maine and Alaska define unusually wide ends of the distribution, while the typical state is much closer to about 5.8 MMBtu per barrel. Reading the series as average energy content per barrel—not as fuel volume, generation, or efficiency—keeps the comparison aligned with what the EIA field actually measures.
Frequently Asked Questions
Which state had the highest non-CHP electric-power petroleum-liquid heat content in 2025?
Maine was highest at 6.3617 MMBtu per barrel, followed by Hawaii at 6.1155 and Massachusetts at 6.0121.
Which state had the lowest value?
Alaska was lowest at 5.0321 MMBtu per barrel. California was second-lowest at 5.5853.
Is this the same dataset as the existing 2025 Electric Power sector heat-content article?
No. This series uses fueltypeid=PEL and sectorid=90, Electric Power Sector Non-CHP. The related broader electric-power article uses fueltypeid=PET and sectorid=98.
Does a higher heat-content value mean more petroleum consumption or better efficiency?
No. Heat content is energy per barrel. Consumption requires a quantity series, and efficiency requires both energy input and electricity output.
Related Articles
Green Map creates custom-edited map images using open geographic data sources such as geoBoundaries, Natural Earth, OpenStreetMap, and government open data. These maps are edited visual materials, not raw data files, and are provided for education, documents, presentations, and graphic reference.