GDP per capita can look very different depending on how currencies are converted. This article uses World Bank indicator NY.GDP.PCAP.PP.CD: GDP per capita, PPP, in current international dollars. Purchasing power parity adjusts for differences in price levels across countries, so the measure is designed for cross-country comparisons of output per person after accounting for what currencies can buy domestically.
The latest-available dataset contains 203 countries and areas. 185 observations are from 2025, while 18 use an earlier latest-available year. The map colors every observation by PPP GDP per capita and adds a dark outline marker where the latest year is earlier than 2025. Older values are not treated as 2025 observations and nothing is filled or imputed.
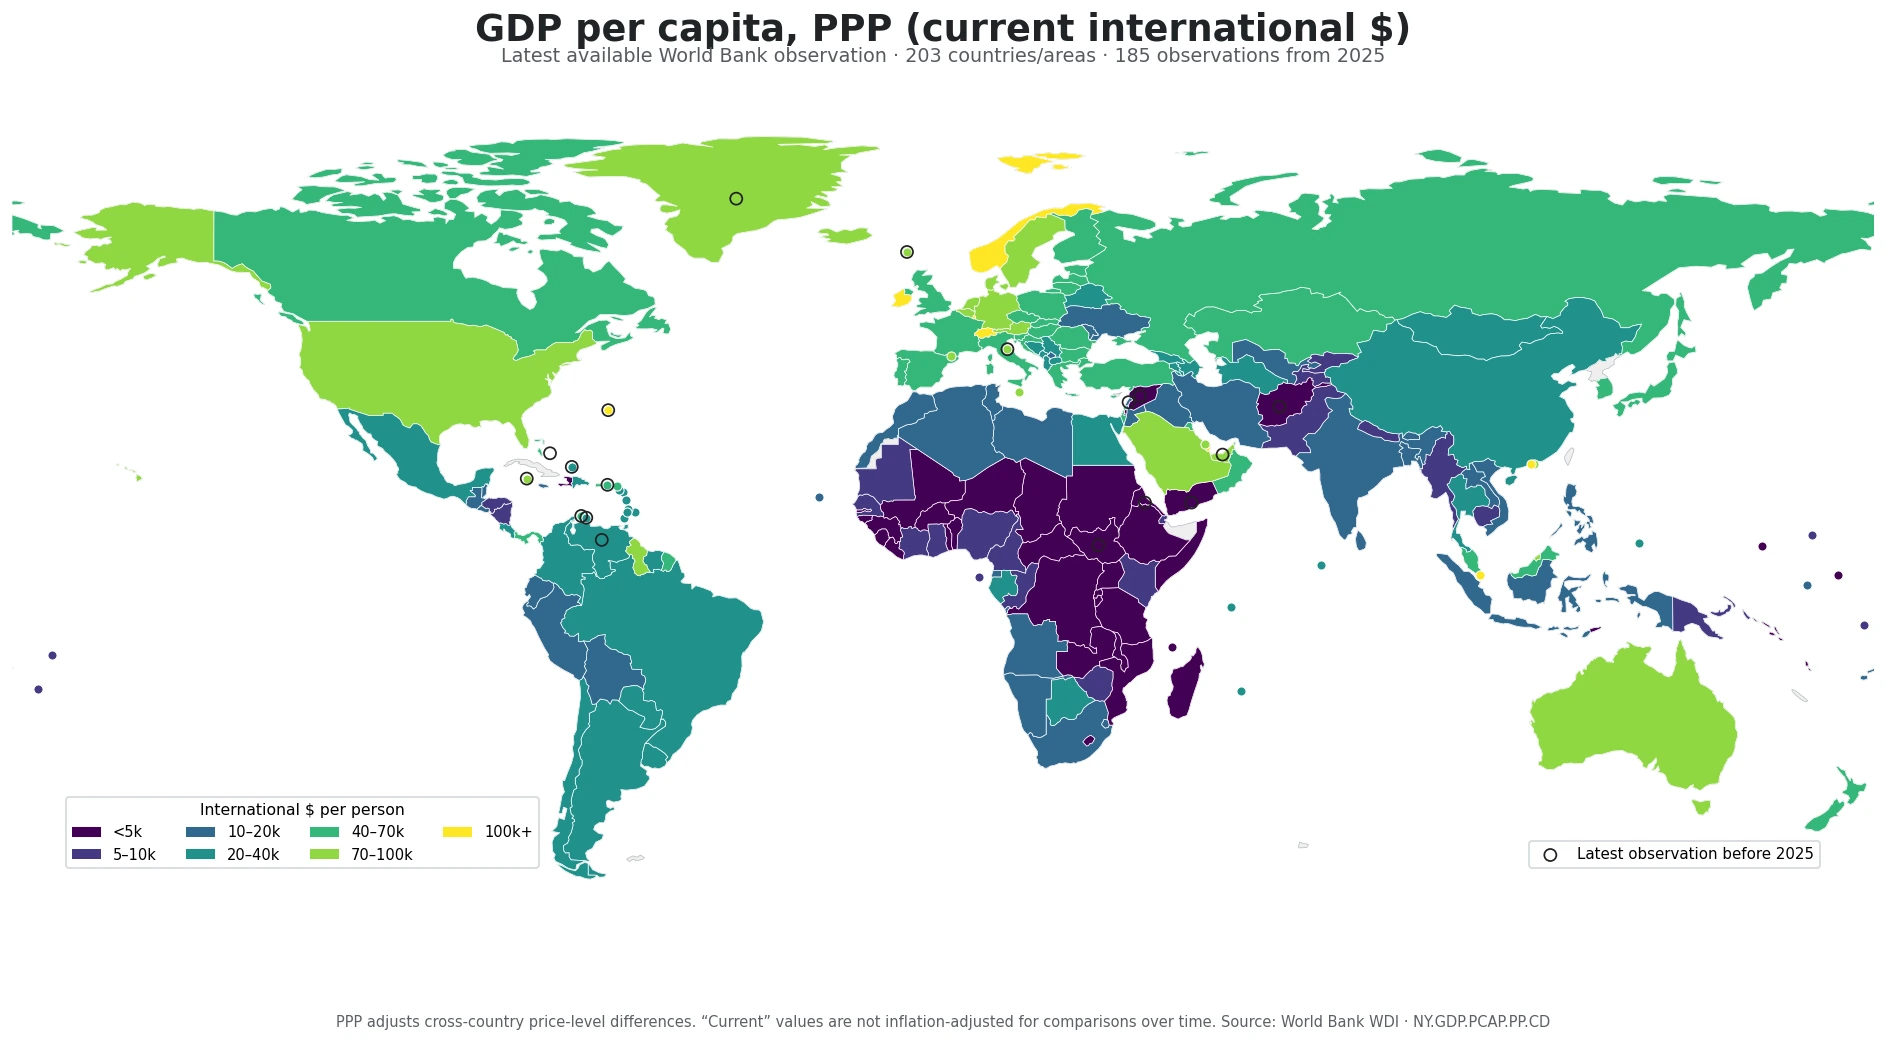
Table of Contents
What GDP per capita at PPP measures
GDP measures the value added generated by final goods and services within an economy. Dividing by population creates a per-capita average. PPP conversion then adjusts currencies for differences in national price levels and expresses the result in a common international-dollar unit. That makes the measure more suitable than a simple market-exchange-rate conversion when the goal is to compare the volume of output per person across countries with very different price levels.
The indicator is still an economy-wide average, not household income. It does not show how income is distributed, how much output accrues to households, or the quality of public services. The word current is also important: these values are not a constant-price time series. They are useful for same-period cross-country comparisons, but real growth over time is better evaluated with a constant-price or growth measure.
The 2025 cross-section covers 185 countries and areas
Across the 185 observations dated 2025, the median is 20,204 international dollars and the mean is 31,817. The first quartile is 7,871 and the third quartile is 49,568. The mean is far above the median because a relatively small group of very high values pulls the average upward.
| PPP GDP per capita range | 2025 countries/areas |
|---|---|
| Below 5,000 | 33 |
| 5,000–9,999 | 24 |
| 10,000–19,999 | 34 |
| 20,000–39,999 | 38 |
| 40,000–69,999 | 33 |
| 70,000–99,999 | 16 |
| 100,000 or more | 7 |
The geography is visible on the map. Higher bands are common across much of Western and Northern Europe, North America, several Gulf economies, and parts of East Asia. Lower bands form a broad cluster across many countries in Sub-Saharan Africa. Southeast Asia and Latin America contain a mix of color bands, showing why a regional label alone is not a reliable substitute for country-level values.
The highest 2025 values are concentrated in several small high-income economies
Singapore has the highest 2025 observation at 163,354 international dollars per person, followed by Luxembourg at 156,542, Ireland at 155,089, Macao SAR at 137,031, and Qatar at 128,883. Several of the leaders are small countries or territories, so the ranking should not be reinterpreted as a ranking of typical household income or individual living standards.
| Country/area | 2025 GDP per capita, PPP |
|---|---|
| Singapore | 163,354 |
| Luxembourg | 156,542 |
| Ireland | 155,089 |
| Macao SAR, China | 137,031 |
| Qatar | 128,883 |
| Norway | 104,044 |
| Switzerland | 102,513 |
| Guyana | 97,899 |
| Brunei Darussalam | 92,430 |
| United States | 90,027 |
The United States is also in a high band at about 90,027 international dollars, while Norway and Switzerland exceed 100,000. This indicator alone does not explain why a country is high. Industry structure, population, labor-market conditions, corporate activity, and cross-border income flows can all matter, but those mechanisms require separate evidence. The map is best used to identify the spatial pattern before turning to causal explanations.
The lowest 2025 band forms a broad Sub-Saharan African cluster
The bottom of the 2025 distribution includes Burundi, the Central African Republic, Somalia, Mozambique, Malawi, the Democratic Republic of the Congo, Madagascar, and Liberia. Burundi is about 1,248 international dollars per person, the Central African Republic about 1,314, and Somalia about 1,643. Several neighboring countries occupy the same lowest color bands, producing one of the clearest geographic clusters on the map.
| Country/area | 2025 GDP per capita, PPP |
|---|---|
| Burundi | 1,248 |
| Central African Republic | 1,314 |
| Somalia, Fed. Rep. | 1,643 |
| Mozambique | 1,698 |
| Malawi | 1,899 |
| Congo, Dem. Rep. | 1,920 |
| Madagascar | 1,952 |
| Liberia | 1,981 |
| Niger | 2,177 |
| Sudan | 2,192 |
A low PPP GDP-per-capita value is not identical to a poverty rate or personal income measure. It is an average of economy-wide output divided by population. A fuller assessment of material conditions would need household income or consumption, poverty, health, education, and distributional indicators in addition to GDP per person.
Large differences exist within the same region
North America shows a wide 2025 spread: the United States is about 90,027 international dollars, Canada 66,746, and Mexico 25,868. In East Asia, Japan is 55,422, China 29,333, and Mongolia 20,798. Southeast Asia spans an even larger range, from Singapore at 163,354 to Malaysia at 41,498, Thailand at 26,250, Viet Nam at 18,088, Indonesia at 17,660, and the Philippines at 12,577.
South Asia also spans several bands: Sri Lanka is 17,065, India 11,748, Bangladesh 10,154, Pakistan 6,573, and Nepal 6,175. Among Gulf economies with 2025 observations, Qatar is 128,883, Saudi Arabia 73,784, Bahrain 70,997, Kuwait 56,468, and Oman 42,295. These contrasts show why the country-level map is more informative than assuming that neighboring economies sit at similar levels.
Why PPP and current-US-dollar GDP per capita differ
GDP per capita in current U.S. dollars converts national currencies using market exchange rates. PPP conversion instead adjusts for differences in domestic price levels. In an economy where non-traded goods and services are relatively inexpensive, the same domestic output can translate into a much higher international-dollar value under PPP than under a market-rate conversion. In high-price economies the gap may be smaller or take a different pattern.
Neither conversion is universally “better.” Market-rate values are often more direct for questions involving international financial transactions or purchasing imported goods at prevailing exchange rates. PPP values are useful when the question is how much output per person corresponds to domestic purchasing power across countries. The unit should therefore be checked before comparing any two GDP-per-capita maps.
Eighteen observations predate 2025
Of the 203 latest-available observations, 18 are not dated 2025. Ten are from 2024, two from 2023, two from 2022, South Sudan is from 2015, Yemen from 2013, and Eritrea and Venezuela from 2011. Those places are outlined on the map so that an older observation is not visually mistaken for a 2025 reading.
| Country/area | Latest year | GDP per capita, PPP |
|---|---|---|
| Eritrea | 2011 | 1,742 |
| Venezuela, RB | 2011 | 21,283 |
| Yemen, Rep. | 2013 | 3,164 |
| South Sudan | 2015 | 1,155 |
| Syrian Arab Republic | 2022 | 4,905 |
| Virgin Islands (U.S.) | 2022 | 49,785 |
| Greenland | 2023 | 78,906 |
| San Marino | 2023 | 78,810 |
| Afghanistan | 2024 | 2,236 |
| Aruba | 2024 | 51,712 |
| Bahamas, The | 2024 | 41,258 |
| Bermuda | 2024 | 118,728 |
| Cayman Islands | 2024 | 92,201 |
| Curacao | 2024 | 32,741 |
| Faroe Islands | 2024 | 82,089 |
| Lebanon | 2024 | 11,917 |
| Turks and Caicos Islands | 2024 | 38,010 |
| United Arab Emirates | 2024 | 79,344 |
For current-country rankings, the observation year should be checked before the value itself. This is why the top and bottom tables above use only 2025 observations. Older latest-available values are still useful for coverage, but they should not be treated as a synchronized 2025 cross-section.
Three rules for reading the map
- PPP adjusts cross-country price-level differences, but GDP per capita is not household income and does not describe distribution.
- Current international dollars are not a constant-price time series, so they should not be used by themselves as a measure of real long-run growth.
- The map includes the latest available observation for coverage and separately marks values from before 2025; use the 2025 subset for the cleanest same-year comparison.
The source is the World Bank World Development Indicators series NY.GDP.PCAP.PP.CD. The tables and map classifications are calculated directly from the supplied official observations, with the reported year preserved for every country or area.
Frequently Asked Questions
How is PPP GDP per capita different from GDP per capita in current U.S. dollars?
Current-U.S.-dollar GDP uses market exchange rates, while PPP GDP adjusts for differences in national price levels and expresses output in international dollars.
Why does a 2025 map include some older observations?
The dataset contains 203 latest-available observations. 185 are from 2025 and 18 come from an earlier latest year; the map marks those older observations separately.
Does a high PPP GDP per capita mean the typical household earns that amount?
No. GDP per capita is total economic output divided by population. It is not median household income and does not describe how income is distributed.
Related Articles
Green Map creates custom-edited map images using open geographic data sources such as geoBoundaries, Natural Earth, OpenStreetMap, and government open data.
These maps are edited visual materials, not raw data files, and are provided for education, documents, presentations, and graphic reference.