In 2023, the share of merchandise exports going to high-income economies varies from almost zero to nearly 98% across 205 countries and areas in the World Bank data. The median is 65.68% and the simple unweighted mean is 60.91%. The middle half of observations runs from 43.90% to 82.37%. These numbers describe export destinations: they do not rank countries by the amount they export, the size of their economies, or whether they run a trade surplus.
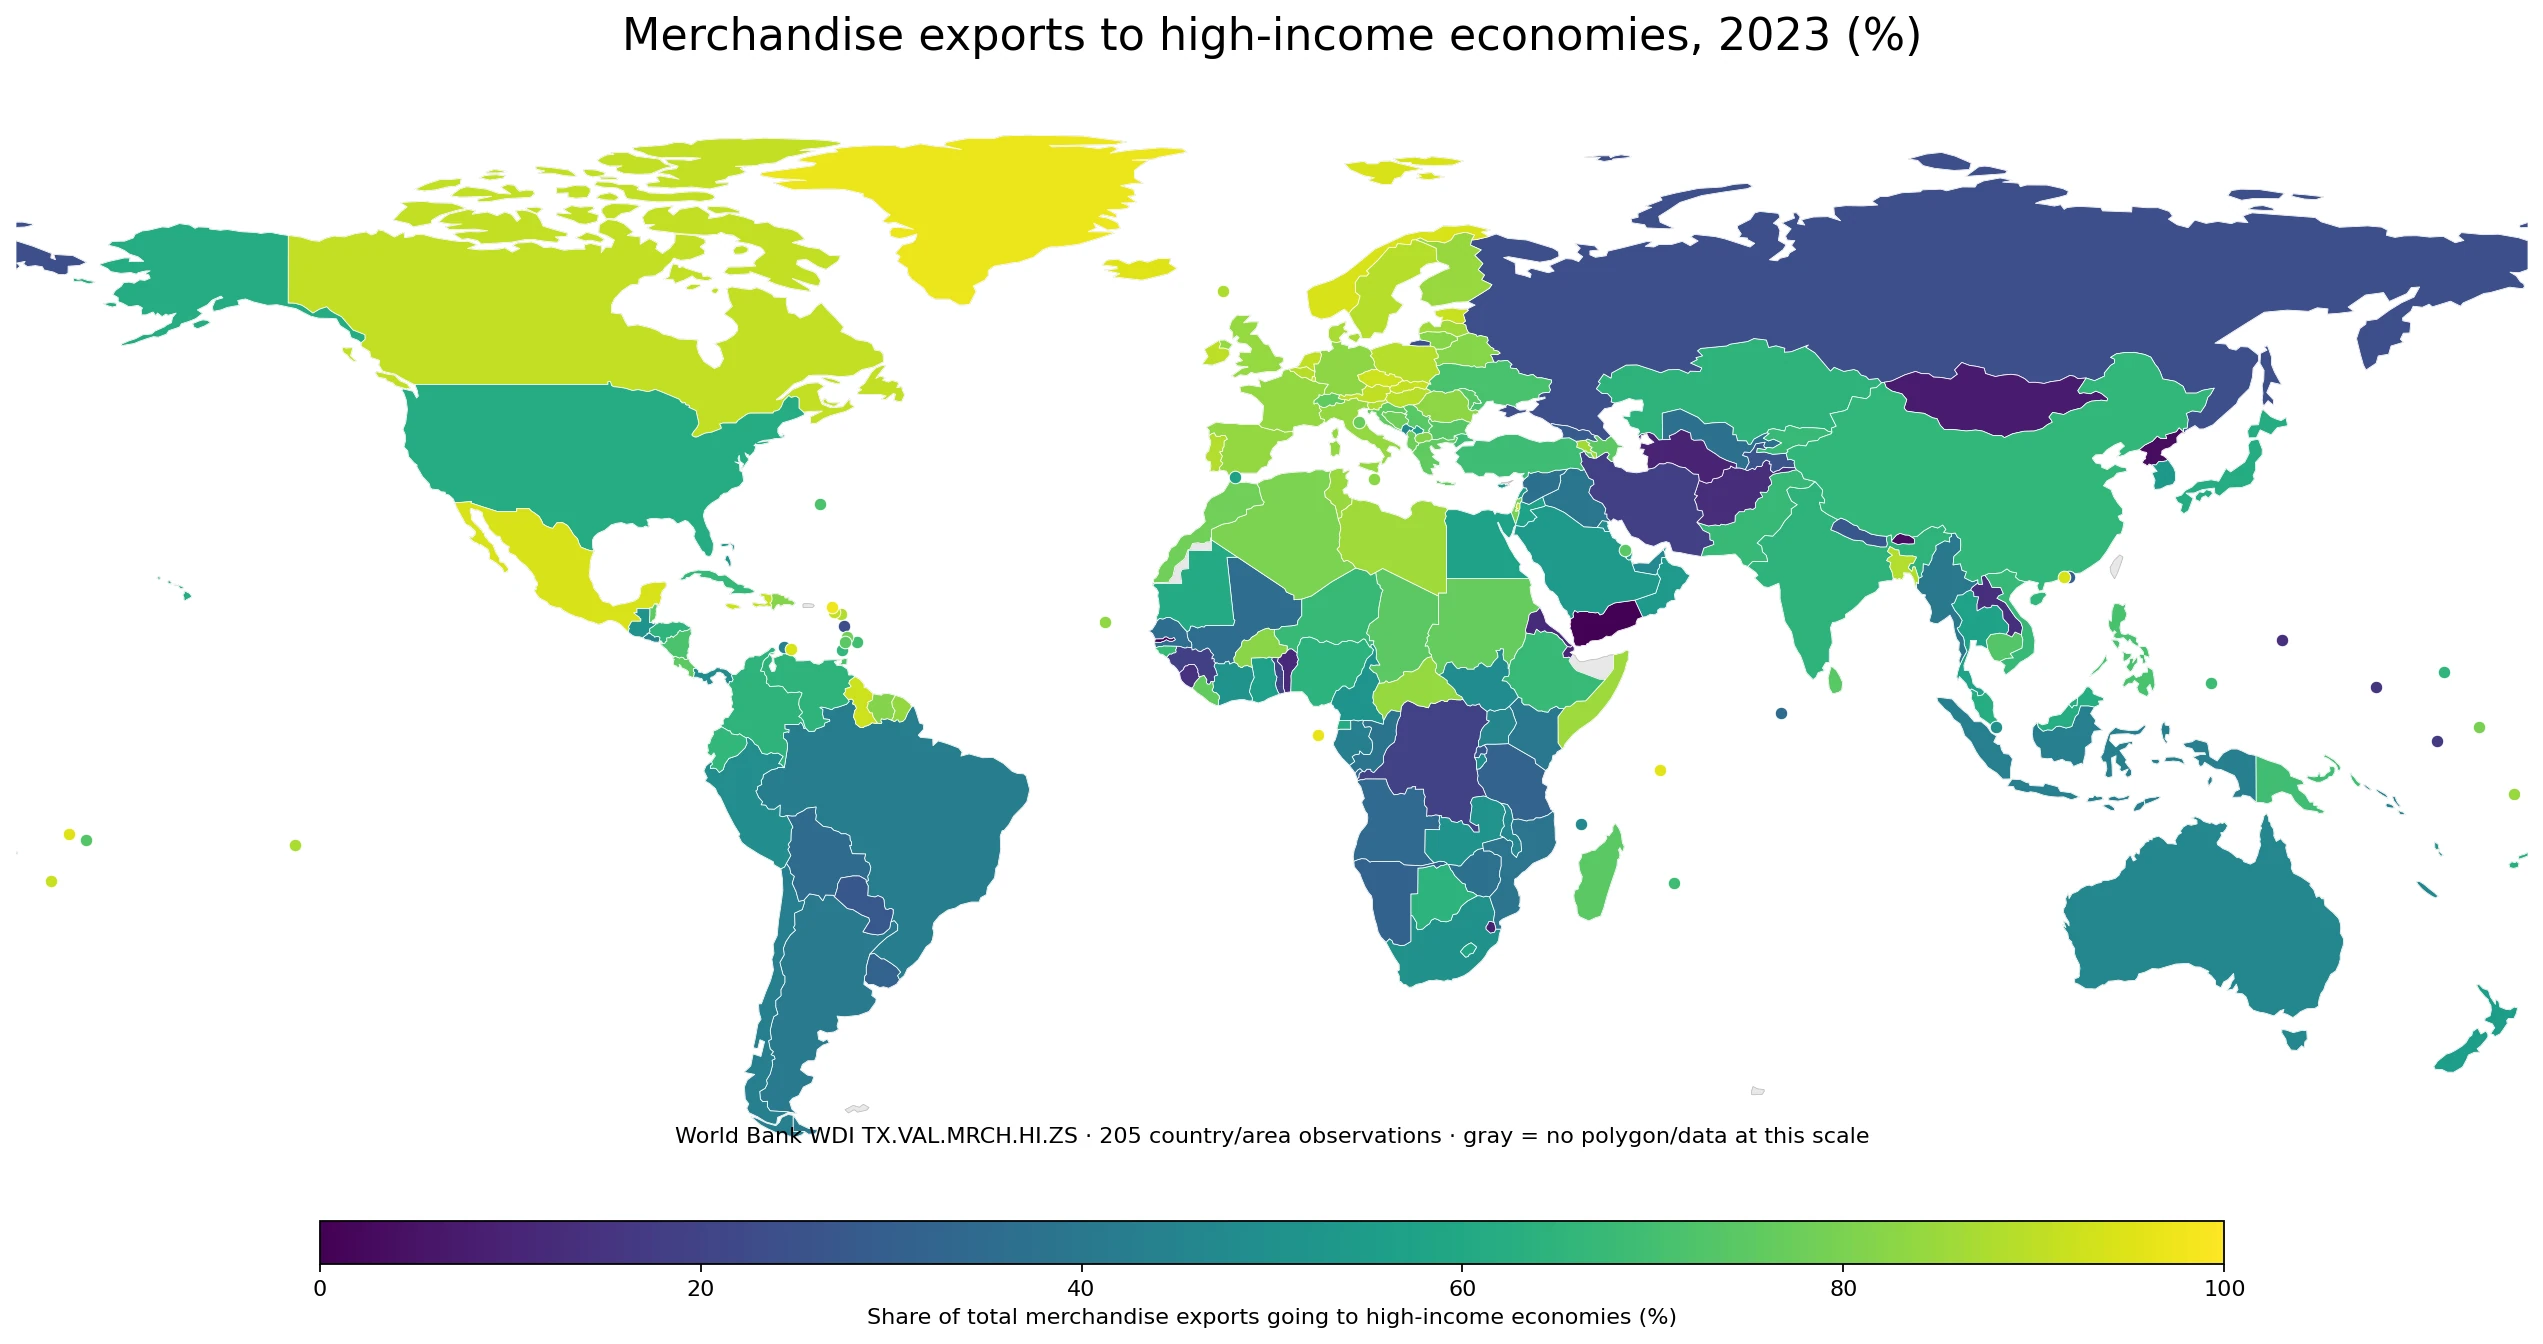
Table of Contents
What the indicator measures
World Bank series TX.VAL.MRCH.HI.ZS measures merchandise exports from a reporting economy to high-income economies as a percentage of that reporting economy’s total merchandise exports. The partner group is defined by the World Bank income classification. A value of 70% therefore means that roughly seven-tenths of recorded merchandise exports went to partners classified as high income.
The World Bank data page identifies the series as World Bank staff estimates based on the IMF Direction of Trade database. The accompanying definition states that the group measure is computed only when at least half of the economies in the relevant partner group have non-missing data. That rule matters because this is a partner-group trade share, not an arbitrary sum of whichever bilateral observations happen to be available.
The denominator is total merchandise exports. Services are not included, and GDP is not part of the calculation. The indicator also says nothing about the absolute dollar value of exports. A small exporter can record a very high share if most of its goods are shipped to high-income markets, while a very large exporter can have a lower share if a substantial part of its trade goes to middle- or low-income partners.
All 205 observations refer to 2023
This dataset is unusually clean for a cross-country snapshot because every retained observation is dated 2023. There is no need to combine one country’s 2019 value with another country’s 2023 value. The median across the 205 country-level percentages is 65.68%, the mean is 60.91%, the first quartile is 43.90%, and the third quartile is 82.37%. The mean sits below the median because a group of very low shares stretches the lower tail.
| 2023 share of merchandise exports to high-income economies | Countries/areas |
|---|---|
| Below 20% | 19 |
| 20% to <40% | 24 |
| 40% to <60% | 44 |
| 60% to <80% | 60 |
| 80% to 100% | 58 |
The largest band is 60% to below 80%, containing 60 observations. Another 58 are at or above 80%, while 19 are below 20%. In other words, high-income markets account for most merchandise exports in a large part of the dataset, but the pattern is far from universal. The map is useful precisely because a single global average hides these large differences in destination structure.
The highest shares include several small countries and territories
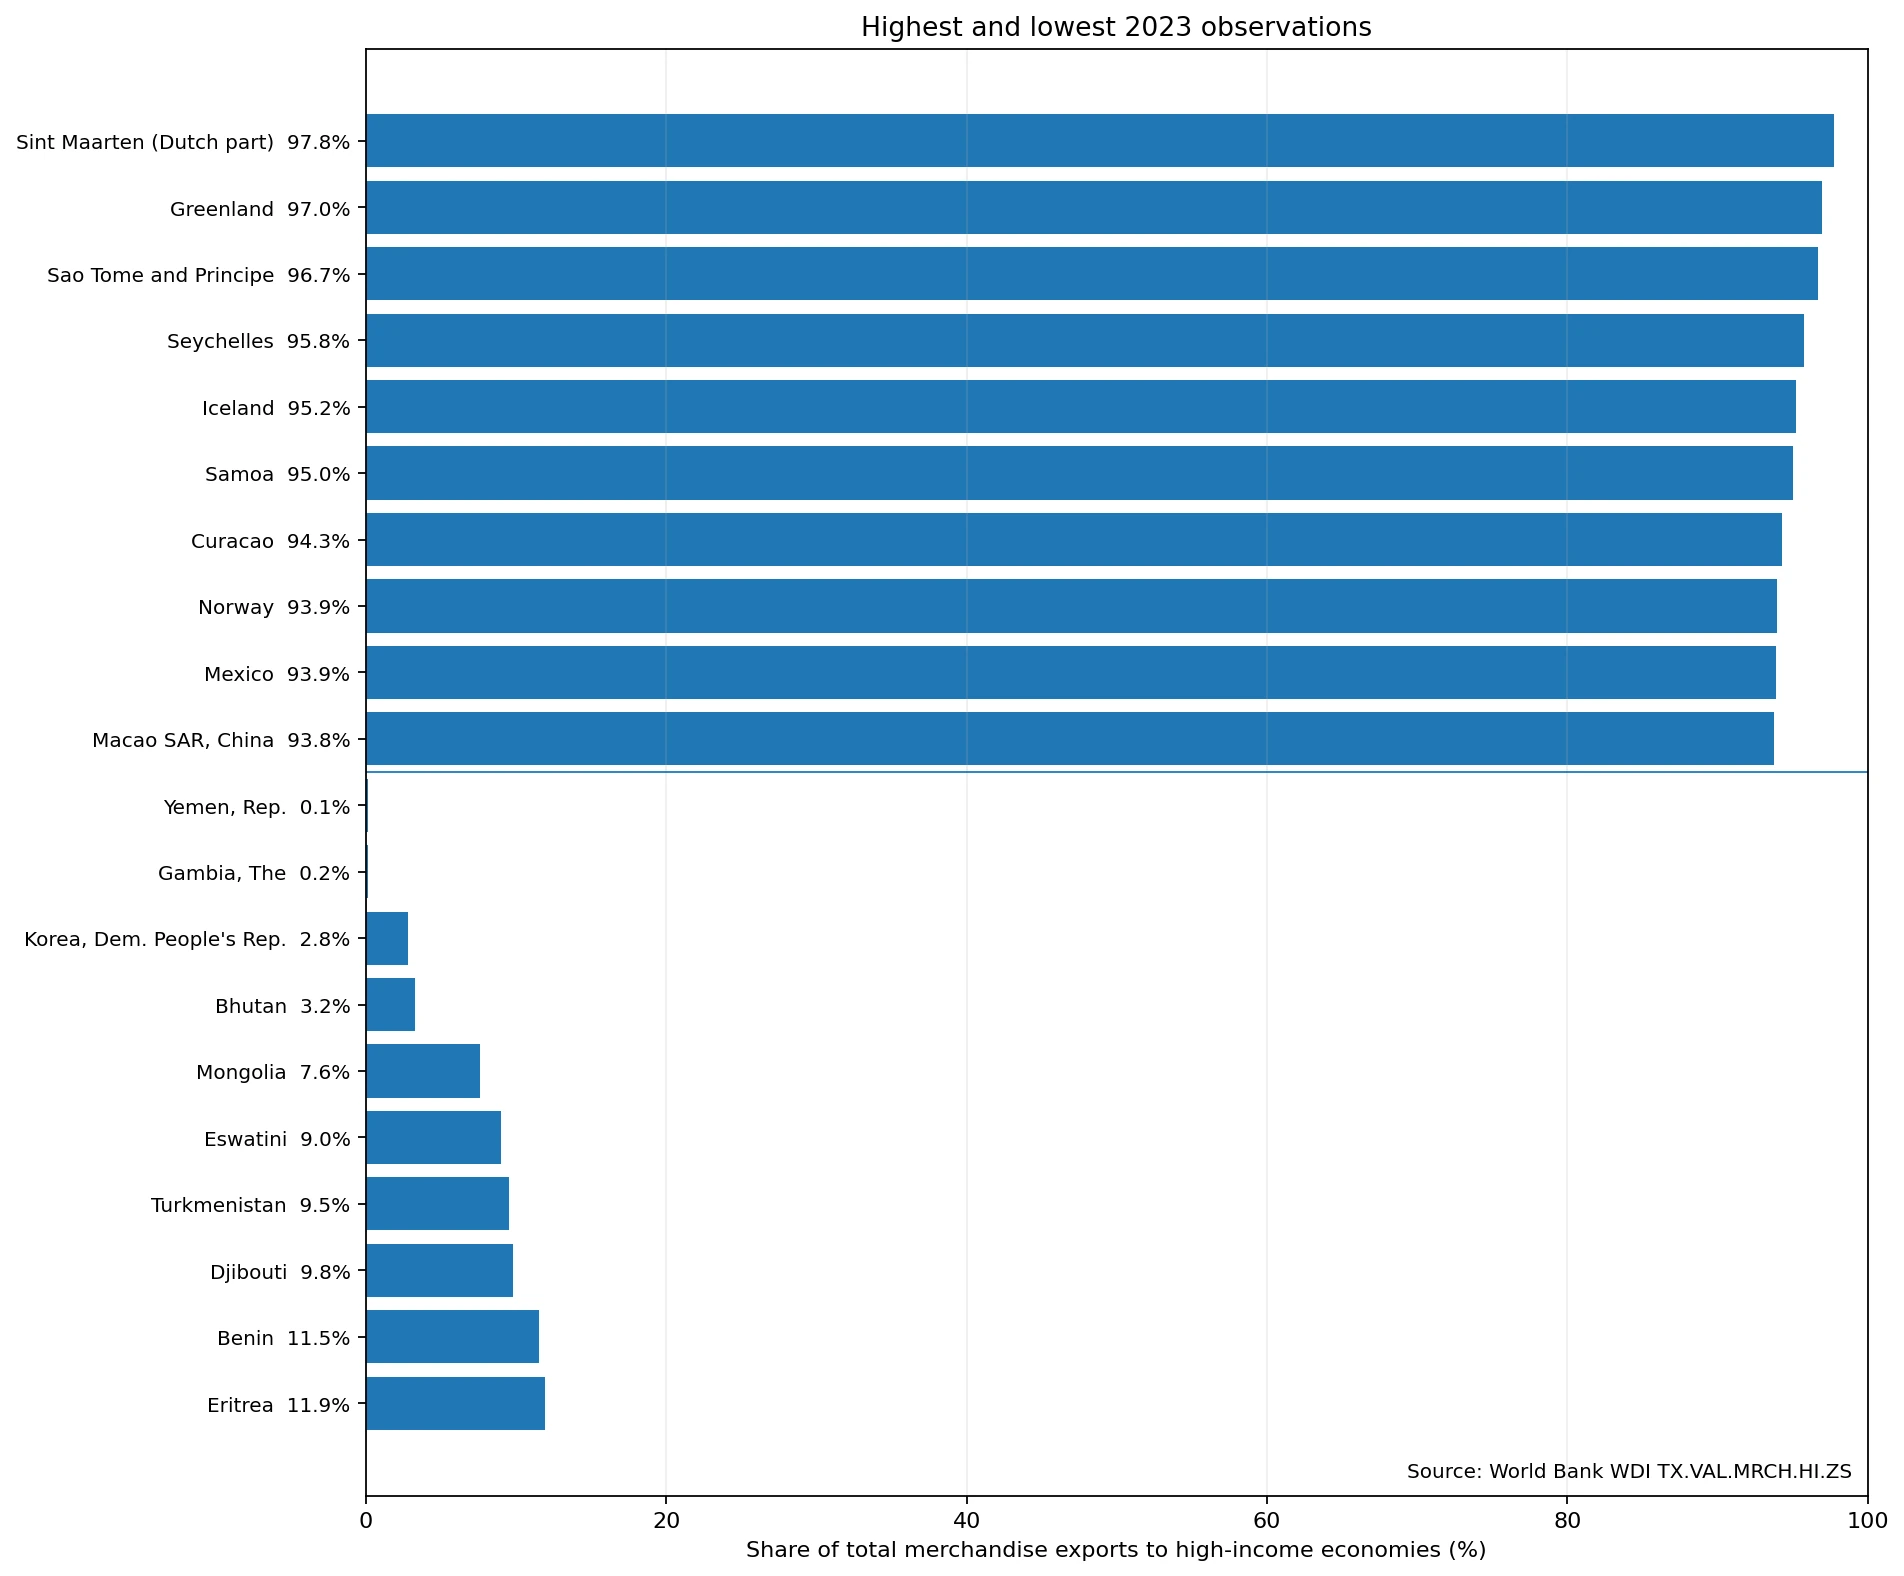
Sint Maarten (Dutch part) has the highest observation at 97.77%, followed by Greenland at 96.96%, Sao Tome and Principe at 96.73%, Seychelles at 95.78%, and Iceland at 95.24%. Samoa is 95.05%, Curacao 94.29%, Norway 93.93%, Mexico 93.89%, and Macao SAR, China 93.78%. The strong presence of small islands and territories near the top is a useful reminder that the ratio measures where exports go, not how much is exported.
A 95% share does not mean an economy exports more goods than an economy at 70%, and it does not reveal whether exports are diversified by product. It only says that a larger fraction of merchandise exports is directed to high-income partners. Export growth, export sophistication, concentration by product, and the trade balance require different data.
At the low end, shares fall below 1%
Yemen has the lowest 2023 observation at 0.12%, followed by The Gambia at 0.15%. The Democratic People’s Republic of Korea is 2.81% and Bhutan 3.23%. Mongolia is 7.57%, Eswatini 8.99%, Turkmenistan 9.51%, Djibouti 9.76%, Benin 11.55%, and Eritrea 11.89%. Eight observations are below 10%.
A low share does not mean that merchandise exports are necessarily small. It means that high-income destinations make up a small part of the export total. A country may instead sell a large share of its goods to middle-income or lower-income partners. To assess export scale or performance, the relevant companion measures would include total merchandise exports, export growth, product composition, and balances with trading partners.
Europe forms a broad high-share cluster, but neighboring patterns can diverge
A large part of Europe appears in the upper bands. The Netherlands is 90.55%, Poland 88.85%, Sweden 88.69%, Portugal 88.41%, Denmark 87.07%, Finland 84.72%, Italy 83.95%, Spain 83.85%, France 83.68%, and Germany 83.07%. The Russian Federation is much lower at 23.57%. The map therefore shows a broad European cluster without implying that geography alone determines the destination mix.
North America also contains a striking internal contrast: Mexico is 93.89% and Canada 90.65%, compared with 61.01% for the United States. Asia is even more heterogeneous. China is 65.68%, India 64.76%, and Japan 61.71%, while Bangladesh reaches 88.53%, Bhutan is 3.23%, and Mongolia 7.57%. These neighboring differences are one of the main reasons the geographic view adds information beyond a global summary statistic.
Selected major economies span more than 70 percentage points
Among selected large economies, Mexico and Canada are above 90%, while the United Kingdom, France, and Germany are in the 80s. China, India, Japan, and the United States are around the low-to-mid 60s. Brazil and Indonesia are in the low 40s, and the Russian Federation is 23.57%. Korea, Rep. is 53.47%, below the 205-observation median of 65.68%. Again, these are destination shares rather than measures of total export capacity.
| Country/area | 2023 share to high-income economies |
|---|---|
| Mexico | 93.89% |
| Canada | 90.65% |
| United Kingdom | 84.20% |
| France | 83.68% |
| Germany | 83.07% |
| China | 65.68% |
| India | 64.76% |
| Japan | 61.71% |
| United States | 61.01% |
| Saudi Arabia | 53.69% |
| Korea, Rep. | 53.47% |
| South Africa | 50.13% |
| Singapore | 49.79% |
| United Arab Emirates | 46.78% |
| Australia | 45.93% |
| Indonesia | 42.67% |
| Brazil | 42.56% |
| Russian Federation | 23.57% |
The table should not be read as an export-performance league table. If a country’s merchandise exports grow mainly toward middle-income partners, its total exports can increase while this share declines. Conversely, the share can rise even when total exports fall if shipments to high-income partners decline less than shipments elsewhere. Both the numerator and denominator are trade-flow quantities, so composition matters.
This is different from exports as a share of GDP or the trade balance
Exports of goods and services as a percentage of GDP asks how large exports are relative to the domestic economy. TX.VAL.MRCH.HI.ZS asks where merchandise exports are going. A country can therefore have a high export-to-GDP ratio but a moderate high-income-destination share, or the reverse. The two indicators answer different questions and use different denominators.
The trade balance is different again because it subtracts imports from exports. Imports do not enter this destination-share indicator, so a 90% value cannot tell whether a country has a trade surplus or deficit. Nor does a high share by itself establish that exports are more resilient, diversified, or profitable. Those questions require additional measures of product concentration, partner concentration, prices, volumes, and import flows.
Source and mapping method
The statistical source is World Bank World Development Indicators series TX.VAL.MRCH.HI.ZS. The World Bank describes it as merchandise exports to high-income economies as a percentage of total merchandise exports and lists World Bank staff estimates and the IMF Direction of Trade database as the source basis. The 205 numeric observations supplied for this analysis are all dated 2023; means, medians, quartiles, distribution bands, and rankings are calculated directly from those values.
The map joins ISO-3 country codes to a low-resolution world boundary layer. Of the 205 statistical rows, 169 are rendered as country polygons and 36 small or separately reported countries and areas are added as point markers. Missing geometry is not converted to a zero value, and the color scale is fixed to the indicator’s 0–100% percentage range. The map is designed to show geographic differences in export-destination composition, not to infer why a particular country has a high or low share.
Frequently Asked Questions
What does an 80% share of merchandise exports to high-income economies mean?
It means about 80% of the reporting economy’s merchandise export value went to partner economies classified as high income by the World Bank. It is not the value of exports as a share of GDP.
Does a higher share mean stronger export competitiveness?
Not necessarily. The indicator measures destination composition. Export value, growth, product sophistication, and the trade balance require separate indicators.
Are the 205 country observations from different years?
No. All 205 observations used in this comparison are dated 2023, so the map and rankings use a common reference year.
Does the indicator include services exports?
No. It covers merchandise exports, meaning trade in goods. Cross-border services exports are not included.
Related Articles
Exports of goods and services as a share of GDP compares the scale of exports with the domestic economy rather than dividing merchandise exports by destination.
Trade as a share of GDP adds exports and imports of goods and services and compares the total with GDP.
Services trade as a share of GDP focuses on cross-border services exports and imports rather than merchandise trade destinations.
Green Map creates custom-edited map images using open geographic data sources such as geoBoundaries, Natural Earth, OpenStreetMap, and government open data.
These maps are edited visual materials, not raw data files, and are provided for education, documents, presentations, and graphic reference.