Census 2021 shows an extraordinary spread in population density across the 331 lower-tier local authorities of England and Wales. In the latest Office for National Statistics TS006 release, Tower Hamlets records 15,702.9 usual residents per square kilometre, while Eden records 25.5. The highest value is more than six hundred times the lowest. This is not simply a ranking of places with large populations. Density measures how many usual residents occupy a given land area, so compact urban boroughs can rank far above geographically large authorities even when their total populations are not the largest.
The observations refer to Census Day, 21 March 2021, and cover 309 lower-tier local authorities in England plus 22 in Wales. Every one of the 331 rows has a numeric value. The geography is important: these are the local-authority boundaries used for Census 2021, not a 2026 council list. Local-government reorganisations since the census mean that names such as Eden and Ryedale belong to the 2021 statistical geography even though the present-day administrative structure has changed in some places.
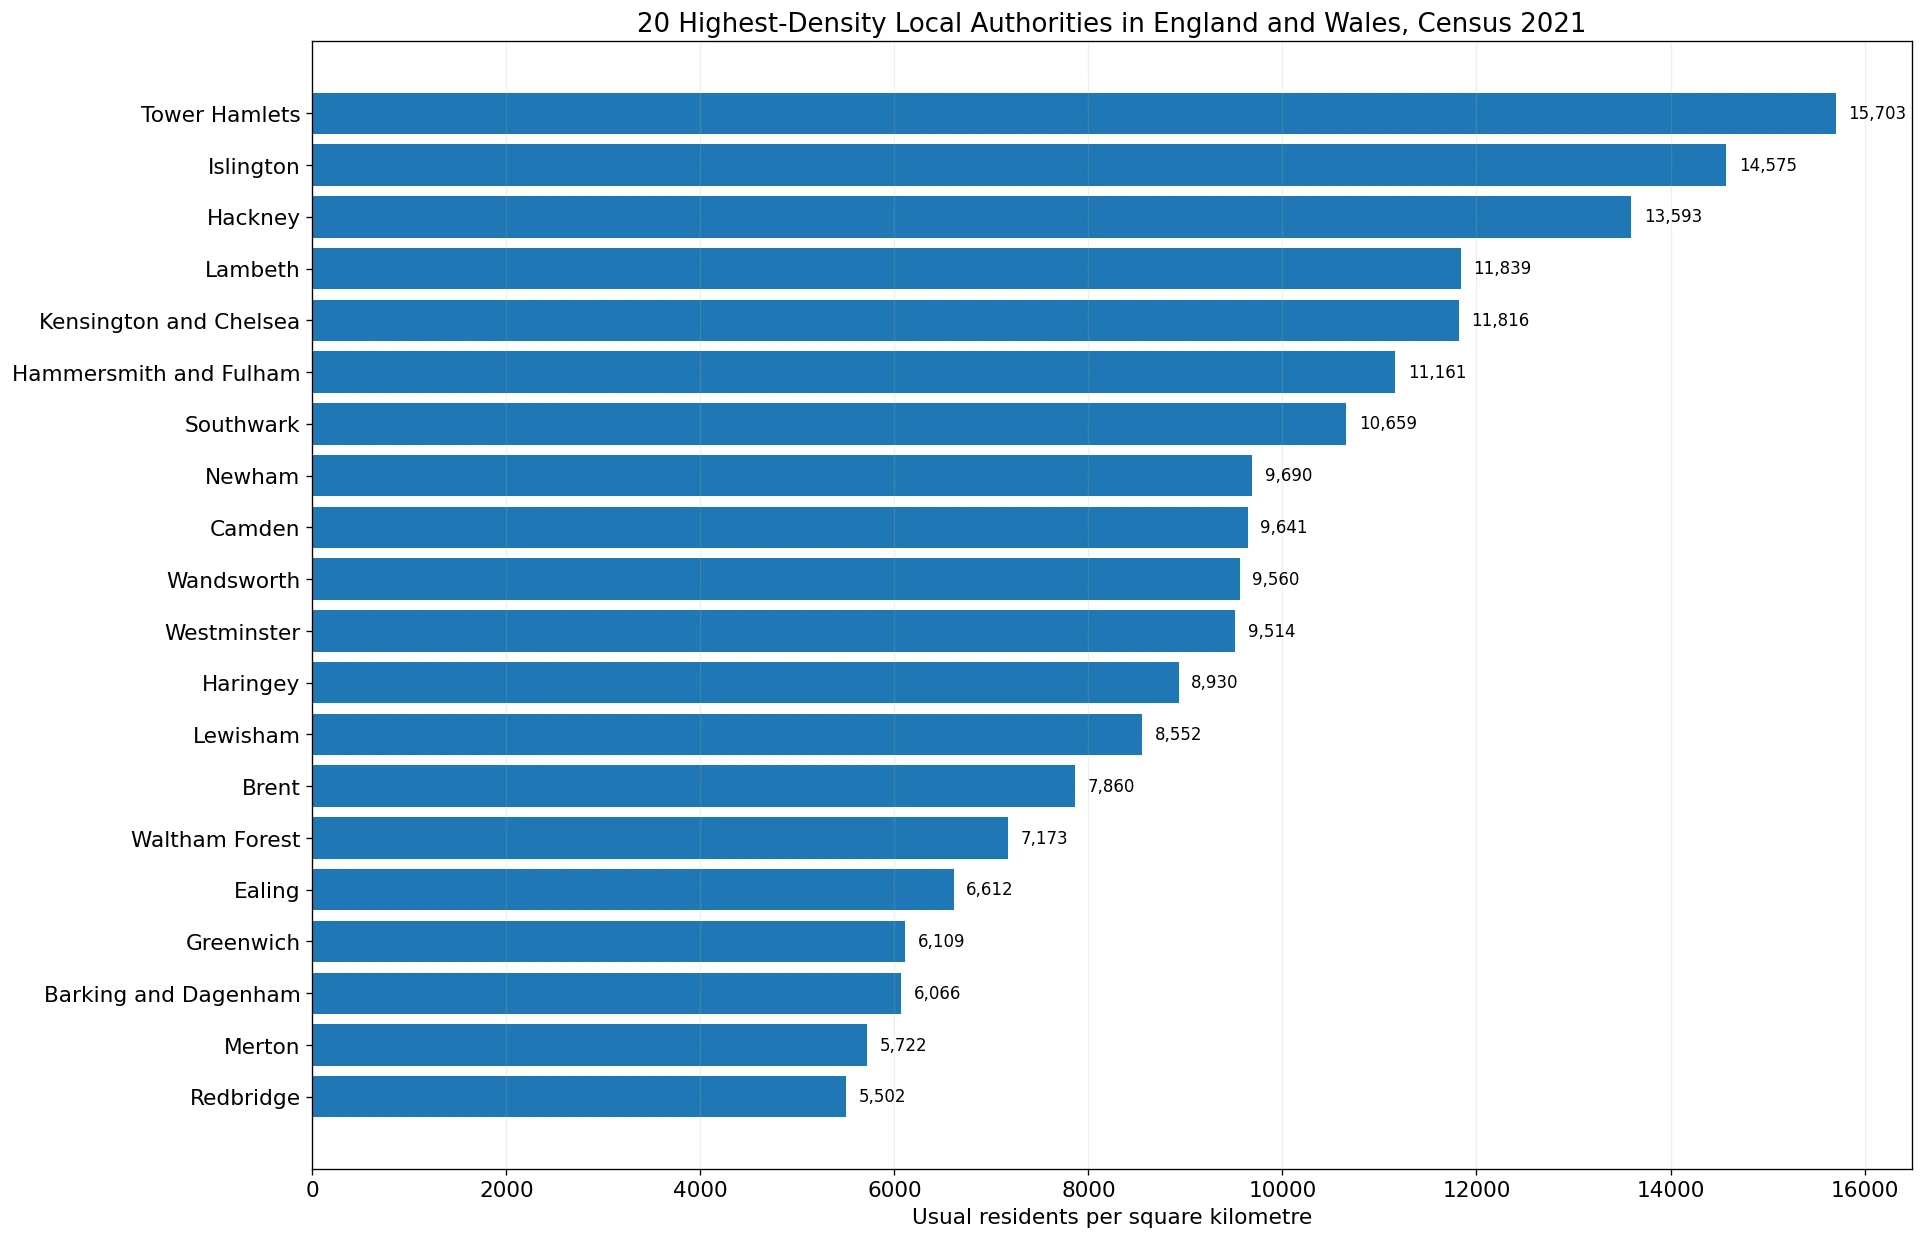
Table of Contents
The entire top 20 consists of London boroughs
The upper end of the ranking is dominated by London. Tower Hamlets leads at 15,702.9 people per square kilometre, followed by Islington at 14,574.9 and Hackney at 13,593.3. Lambeth records 11,839.1, Kensington and Chelsea 11,816.5, and Hammersmith and Fulham 11,161.1. Seven local authorities in the full dataset are at or above 10,000 people per square kilometre, and all seven are London boroughs.
The concentration continues well beyond the first few places. The first non-London authority is Luton, which appears only at rank 21 with 5,196.0 people per square kilometre. The median across London’s 33 boroughs is 6,108.6, almost ten times the 331-authority median of 615.1. London itself is not uniform: Bromley, the least dense of the 33 boroughs in this dataset, is 2,197.7 people per square kilometre, while Tower Hamlets is more than seven times that level. A single “London density” figure therefore hides substantial internal variation.
| Rank | Local authority | People per km² |
|---|---|---|
| 1 | Tower Hamlets | 15,702.9 |
| 2 | Islington | 14,574.9 |
| 3 | Hackney | 13,593.3 |
| 4 | Lambeth | 11,839.1 |
| 5 | Kensington and Chelsea | 11,816.5 |
| 6 | Hammersmith and Fulham | 11,161.1 |
| 7 | Southwark | 10,659.0 |
| 8 | Newham | 9,690.1 |
| 9 | Camden | 9,640.9 |
| 10 | Wandsworth | 9,560.0 |
| 11 | Westminster | 9,514.2 |
| 12 | Haringey | 8,930.2 |
| 13 | Lewisham | 8,551.5 |
| 14 | Brent | 7,859.6 |
| 15 | Waltham Forest | 7,173.3 |
ONS’s national census bulletin provides useful context. London region as a whole was reported at 5,598 people per square kilometre, more than fourteen times the 395 people per square kilometre for England and Wales combined. That national 395 figure should not be compared as though it were the same statistic as the unweighted mean of the 331 local-authority observations. The national figure divides total population by total land area. An unweighted authority mean gives a small London borough the same statistical weight as a very large rural authority, so it answers a different question.
Cardiff stands out in Wales, but the Welsh range is very different from inner London
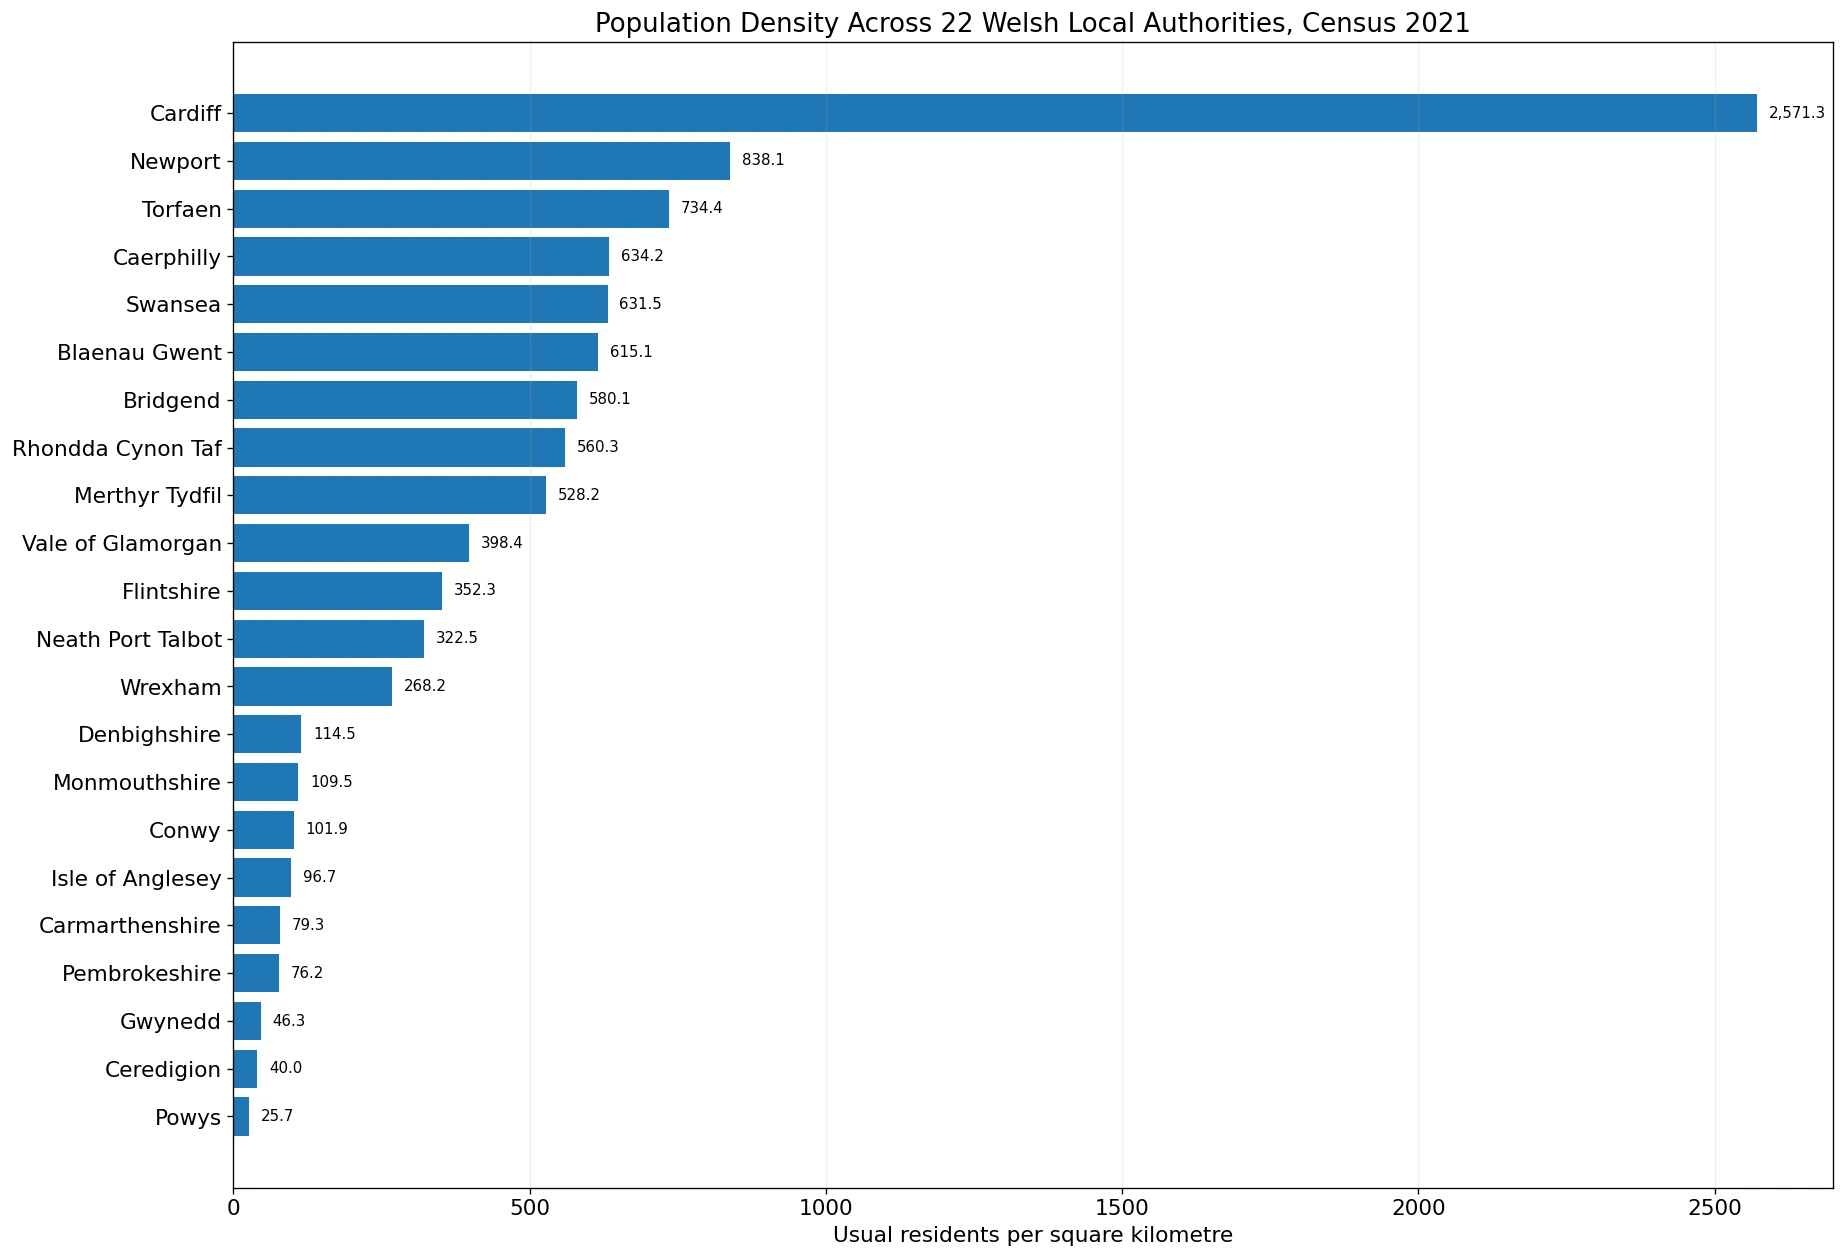
Among the 22 Welsh local authorities, Cardiff is clearly the highest at 2,571.3 people per square kilometre. Newport follows at 838.1, then Torfaen at 734.4, Caerphilly at 634.2, and Swansea at 631.5. Cardiff is an obvious high-density outlier within Wales, yet it ranks only 73rd across the combined England-and-Wales table. The comparison illustrates how far the upper end of the London distribution sits above even the densest Welsh authority.
At the other end, Powys records 25.7 people per square kilometre, the second-lowest value in the entire 331-authority dataset. Ceredigion is 40.0, Gwynedd 46.3, Pembrokeshire 76.2, and Carmarthenshire 79.3. ONS reports Wales as a whole at 150 people per square kilometre, compared with 434 in England. The national contrast reflects the coexistence of compact urban authorities such as Cardiff and large rural or upland areas with much lower settlement density.
Eden and Powys sit at the low-density extreme
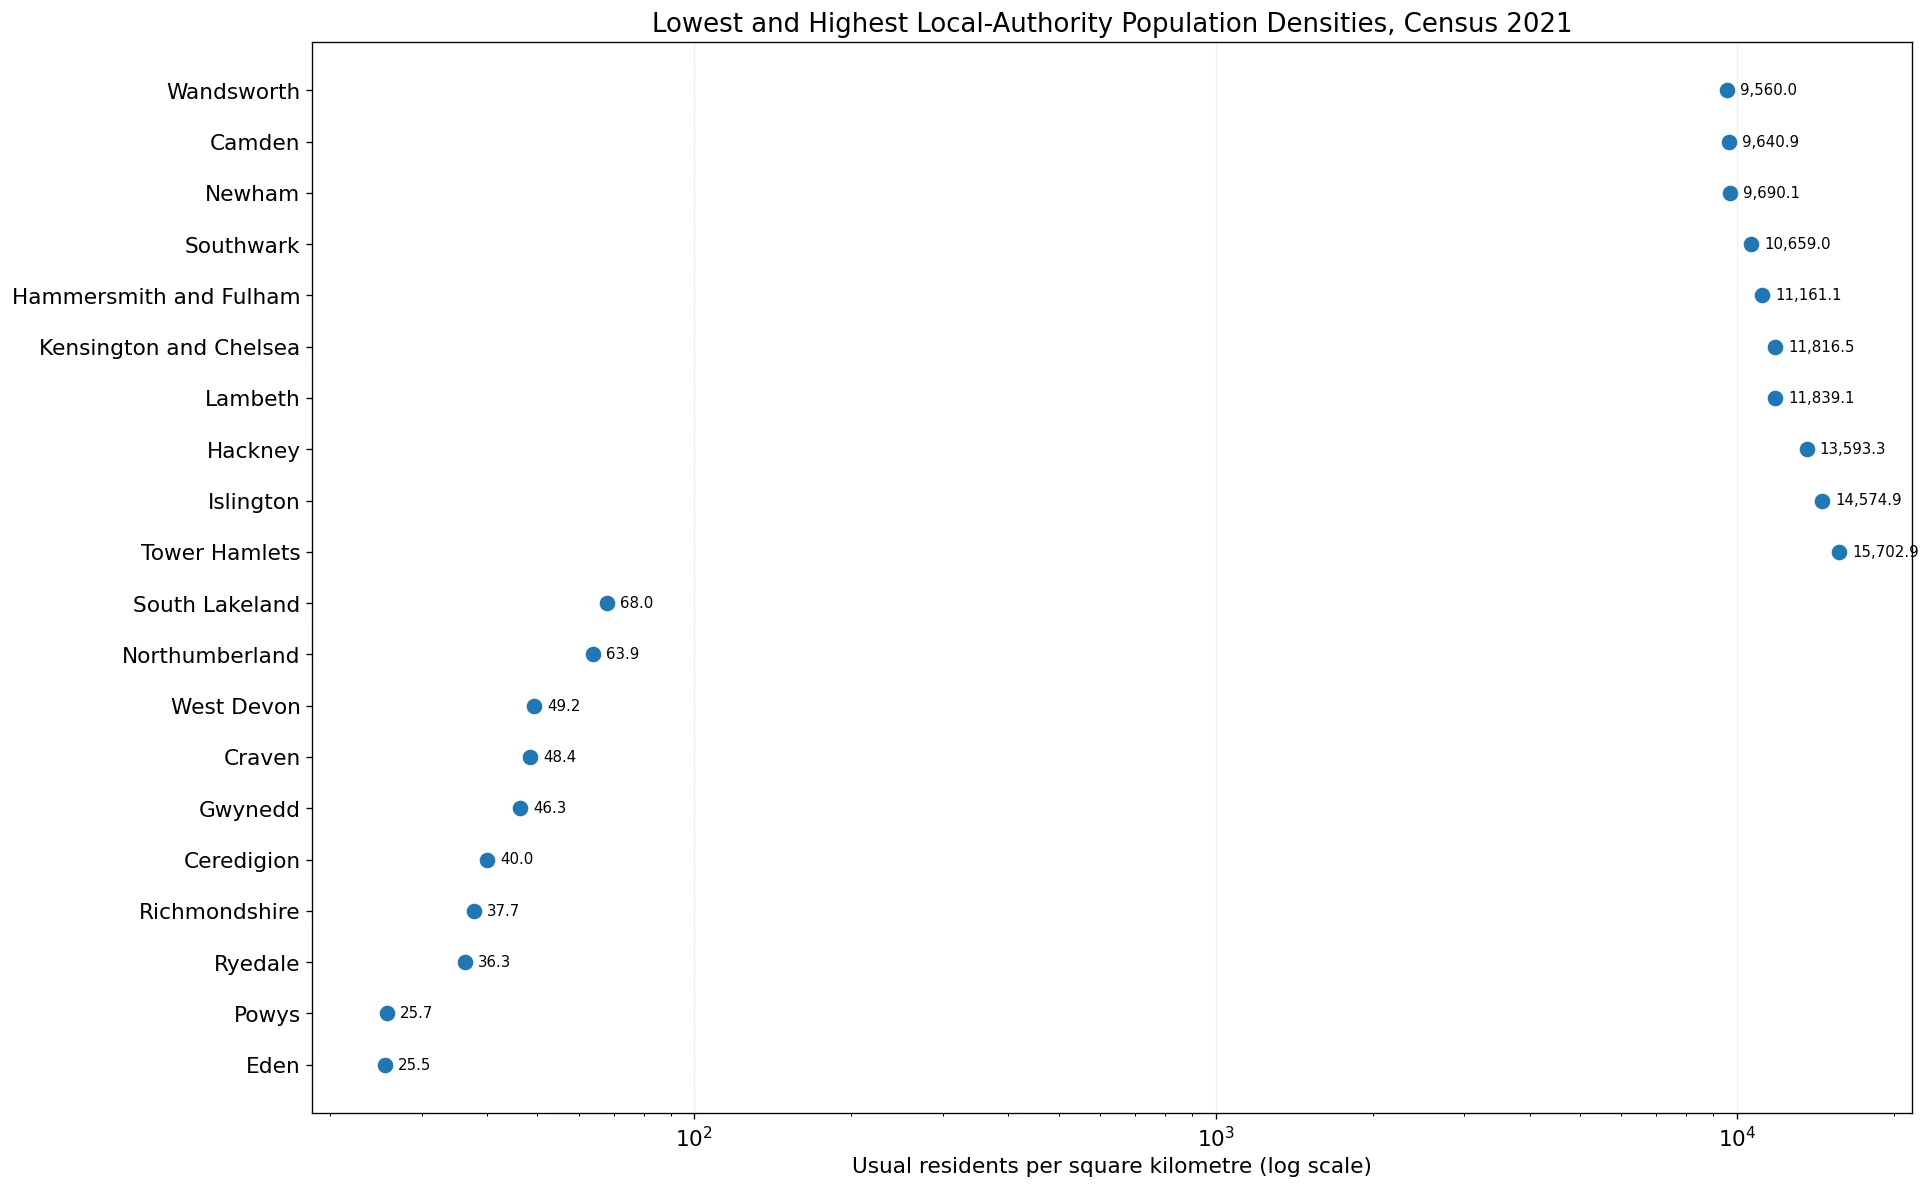
The lowest observation in the full table is Eden at 25.5 people per square kilometre, with Powys almost identical at 25.7. Ryedale follows at 36.3, Richmondshire at 37.7, Ceredigion at 40.0, and Gwynedd at 46.3. Craven at 48.4 and West Devon at 49.2 bring the number of authorities below 50 people per square kilometre to eight. On a conventional linear chart these values are visually compressed because the most densely populated authorities exceed 10,000.
Low density should not be read as a synonym for low population. Density is population divided by land area. A geographically large authority can contain many residents and still have a low density, while a small urban authority may have fewer residents in total but a much higher number per square kilometre. Questions about “where most people live” therefore require total population counts, whereas this dataset answers the different question of how tightly residents are distributed across administrative land areas.
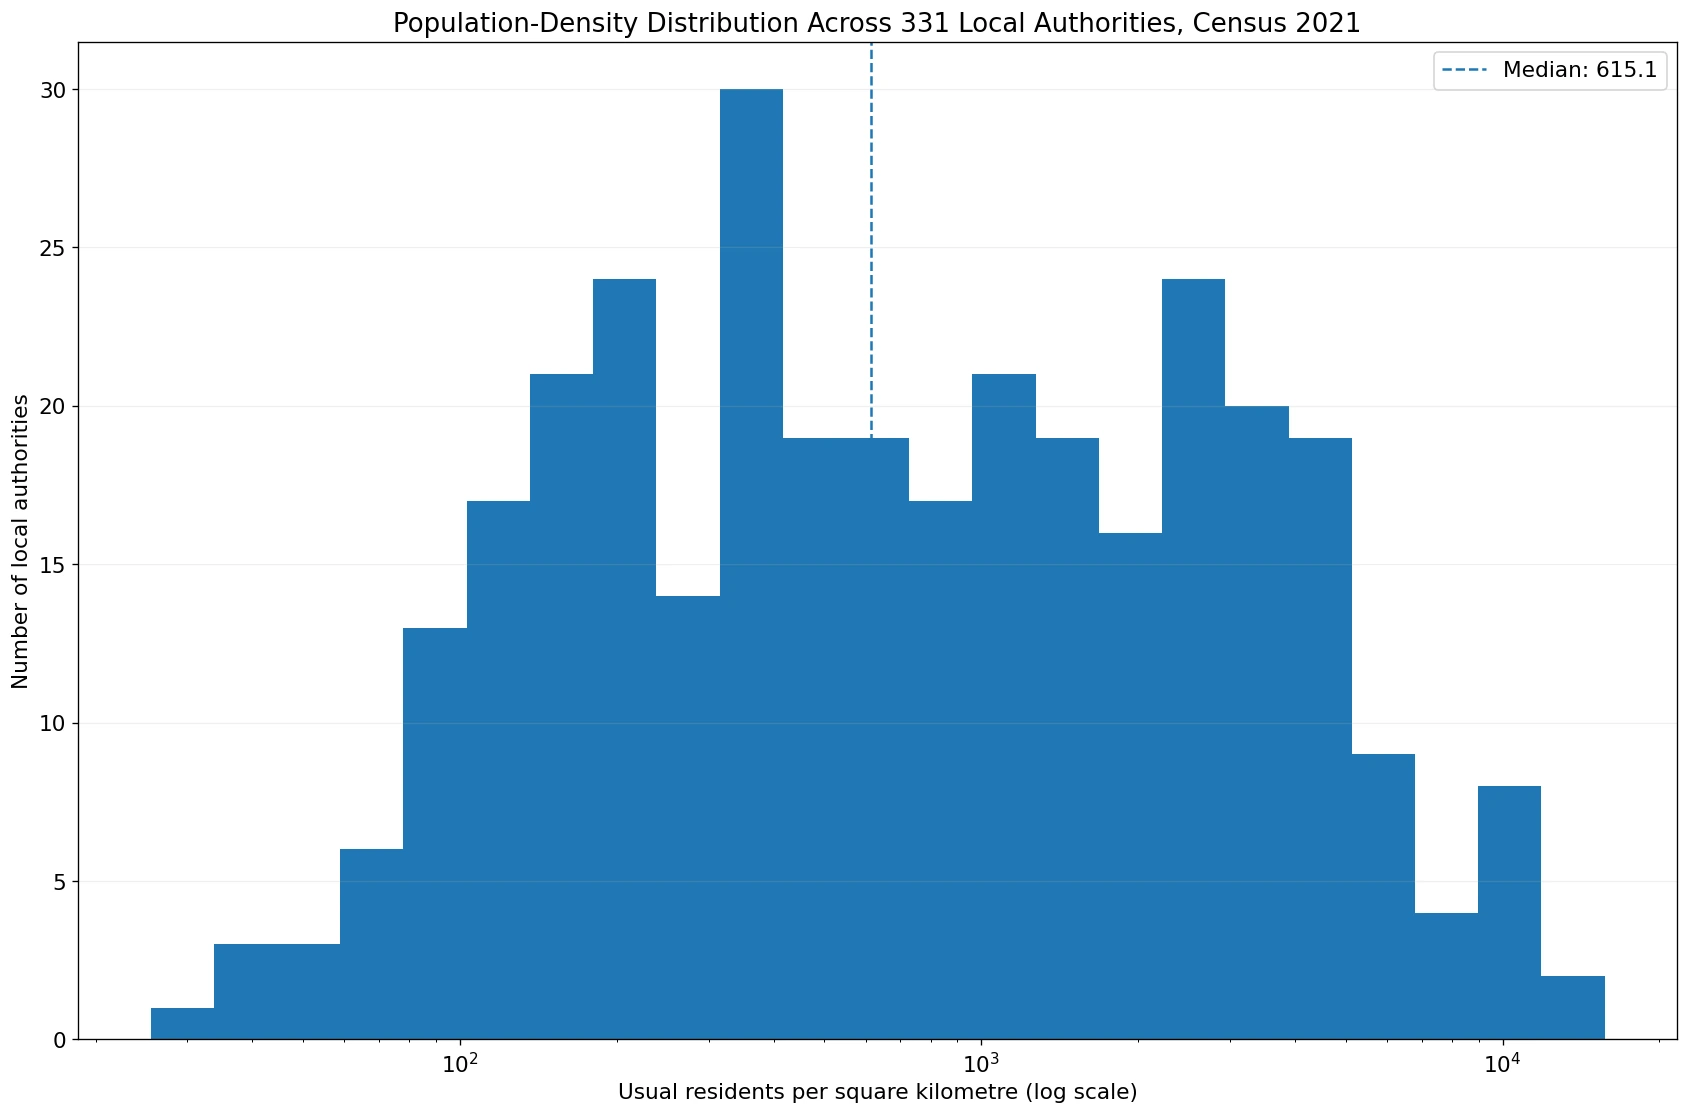
The median is 615.1 people per km² and the distribution is heavily right-skewed
Across all 331 local authorities, the median density is 615.1 people per square kilometre. The first quartile is 228.7 and the third quartile is 2,298.4, so the middle half of authorities lies between roughly 229 and 2,298. The unweighted arithmetic mean is much higher at 1,713.8 because a relatively small number of very dense London authorities pull the average upward. For describing a typical local authority, the median and quartiles are therefore more informative than the mean alone.
Threshold counts make the shape easier to see. There are 139 authorities at or above 1,000 people per square kilometre, 25 at or above 5,000, and only seven at or above 10,000. At the other extreme, 24 authorities are below 100 people per square kilometre. The result is a long upper tail associated with dense metropolitan districts and a substantial low-density group made up largely of broad rural authorities. This is why the distribution chart uses a logarithmic horizontal scale.
National density and an average of local-authority densities are not interchangeable
ONS reports 395 people per square kilometre for England and Wales combined in 2021, with England at 434 and Wales at 150. Those are aggregate densities calculated from national population and land area. The simple average of the 331 local-authority values is 1,713.8, but it is not an alternative national-density estimate. It gives every authority equal weight regardless of physical size. A compact London borough and a large rural authority each contribute one observation, which is why the unweighted mean is pushed far above the population-per-land-area figure for the two nations as a whole.
There is also a small difference between some headline figures in the original census bulletin and the latest TS006 dataset. The bulletin described Tower Hamlets at about 15,695 people per square kilometre and Islington at 14,578, while TS006 Version 4 gives 15,702.9 and 14,574.9. ONS notes that the bulletin’s 2021 density calculations used population estimates rounded to the nearest hundred, and the TS006 dataset subsequently went through several revisions before Version 4 was released on 16 February 2023. The ranking table here therefore uses the latest published TS006 values.
What population density can—and cannot—tell us
Density is a useful first measure of urban concentration, but it is not a direct measure of how crowded daily life feels. Two authorities with the same residents-per-square-kilometre figure may have very different housing forms, green-space shares, industrial land, transport networks, or distributions of development. Large parks, ports, water areas, and non-residential land can affect an administrative-area average. Density should therefore not be treated as a standalone measure of housing quality, congestion, affordability, or access to services.
Local-authority averages also hide neighbourhood variation. A single authority can contain dense town centres, suburban districts, and sparsely settled fringes. ONS publishes Census 2021 statistics for smaller geographies such as MSOAs, LSOAs, and output areas, which are more suitable for analysing local patterns within a council area. Conversely, national or regional planning questions may be better served by aggregate density measures that weight land and population directly rather than by an equal-weight average of administrative units.
The 2021 geography matters when comparing with current councils or later years
The dataset follows the Census 2021 lower-tier local-authority geography. At that time England had 309 lower-tier authorities, comprising non-metropolitan districts, unitary authorities, metropolitan districts, and 33 London boroughs including the City of London. Wales had 22 unitary local authorities. Subsequent local-government restructuring means that a present-day council list does not perfectly match these 331 rows.
This matters especially for time-series work. A change in boundaries can alter both the population and land area assigned to an authority, producing a different density even before any real demographic change is considered. A robust comparison across years should use consistent boundaries where possible or explicitly account for reorganisations. This article does not claim a 2011-to-2021 or 2021-to-present trend; it describes the spatial pattern at the Census 2021 reference date.
Data source and calculation method
The primary source is the Office for National Statistics Census 2021 Population density dataset (TS006), latest Version 4. The metric is the number of usual residents per square kilometre as at 21 March 2021. The analysis file contains 331 distinct geography codes and names: 309 in England and 22 in Wales. There are no missing or zero observations. Rankings, quartiles, the median, and threshold counts are calculated directly from those 331 published values.
For national context, the ONS Population and household estimates, England and Wales: Census 2021 bulletin is used for the 395 people-per-km² England-and-Wales figure, England’s 434, Wales’s 150, and London region’s 5,598. The visuals use the TS006 local-authority values only. No current-boundary choropleth is substituted for the 2021 geography, because doing so would create a false spatial join for authorities affected by later reorganisations.
Frequently Asked Questions
Which local authority had the highest population density in England and Wales in 2021?
Tower Hamlets had the highest value in the latest ONS TS006 Version 4 dataset at 15,702.9 usual residents per square kilometre.
Which Welsh local authority had the highest population density?
Cardiff was highest in Wales at 2,571.3 people per square kilometre. Powys was lowest at 25.7.
Is the average of 331 local-authority densities the same as national population density?
No. An unweighted authority average gives each local authority equal weight, while national density divides total population by total land area. ONS reports 395 people per km² for England and Wales combined in 2021.
Do these 331 rows match the current local-government structure?
Not exactly. They use the Census 2021 lower-tier local-authority geography, and some authorities were reorganised after 2021.
Related Maps
Green Map creates custom-edited map images using open geographic data sources such as geoBoundaries, Natural Earth, OpenStreetMap, and government open data.
These maps are edited visual materials, not raw data files, and are provided for education, documents, presentations, and graphic reference.