The share of firms reporting that a gift or informal payment was expected or requested during dealings with tax officials is one narrow window into the business environment. World Bank World Development Indicators series IC.TAX.GIFT.ZS is derived from Enterprise Surveys. Because the latest-value extract mixes survey years, this article uses the 62 observations actually dated 2025 as the main synchronized comparison instead of treating all 181 latest values as a single current ranking.
Across those 62 same-year observations, the median is 4.08% and the simple country mean is 6.77%. The first quartile is 0.51% and the third quartile is 11.00%, so the middle half lies between roughly 0.5% and 11.0%. Zimbabwe has the highest 2025 value at 48.75%. These are unweighted summaries of country-level percentages, not a firm-weighted global rate.
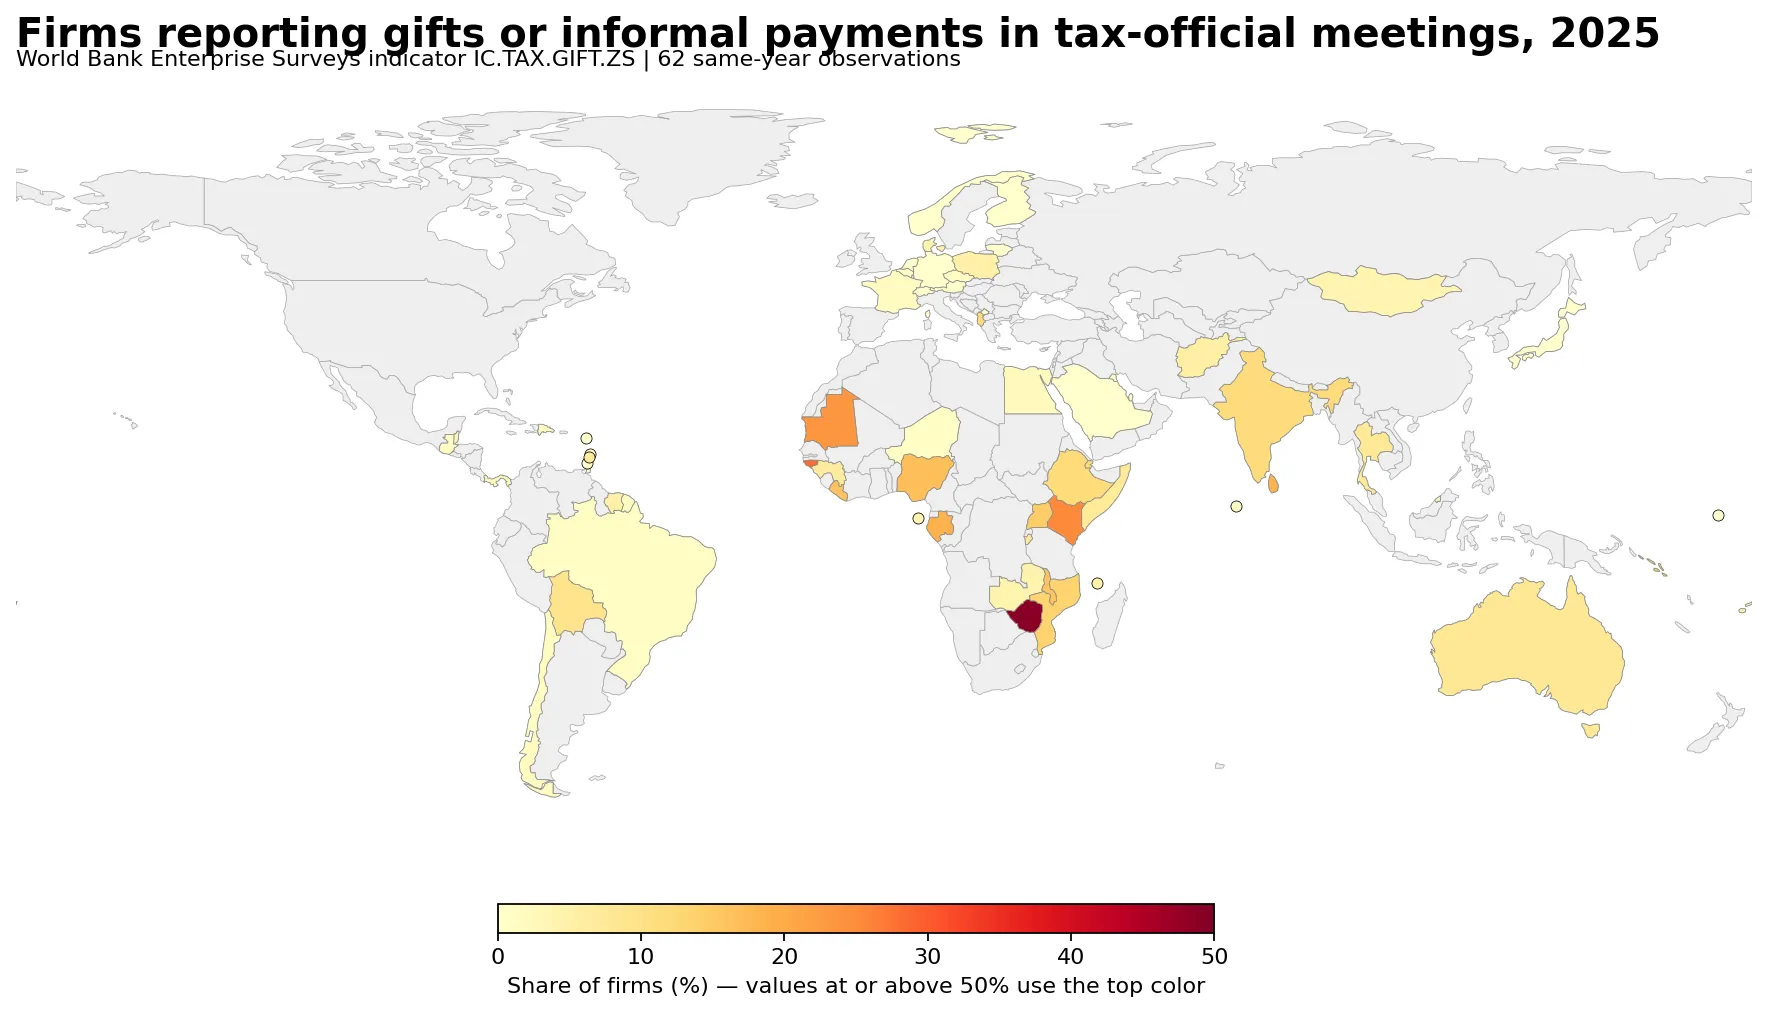
Table of Contents
What the survey question actually asks
The World Bank defines this indicator as the percentage of firms expected to give gifts or informal payments during meetings with tax officials. In the Enterprise Surveys questionnaire, establishments are first asked whether they were visited or inspected by tax officials or required to meet with them during the previous year. The follow-up item asks whether, in any of those inspections or meetings, a gift or informal payment was expected or requested. The percentage therefore comes from a specific firm-government interaction question, not from a survey of the general population or a count of all tax officials.
The wording also does not measure the monetary size of any payment. It records whether a gift or informal payment was expected or requested in the relevant interaction; it does not by itself show how much was paid, whether payment actually occurred, what tax or administrative procedure was involved, or who initiated the expectation. A high value can motivate closer investigation, but the indicator alone cannot establish the cause of the result or summarize corruption across an entire society.
The 2025 distribution has a long upper tail
The 2025 mean of 6.77% is above the median of 4.08% because a relatively small group of higher observations pulls the average upward. Of the 62 countries and areas, 16 are at or above 10% and 4 are at or above 20%. Eighteen are below 1%. The median and the distribution bands therefore describe a typical observation better than the mean alone.
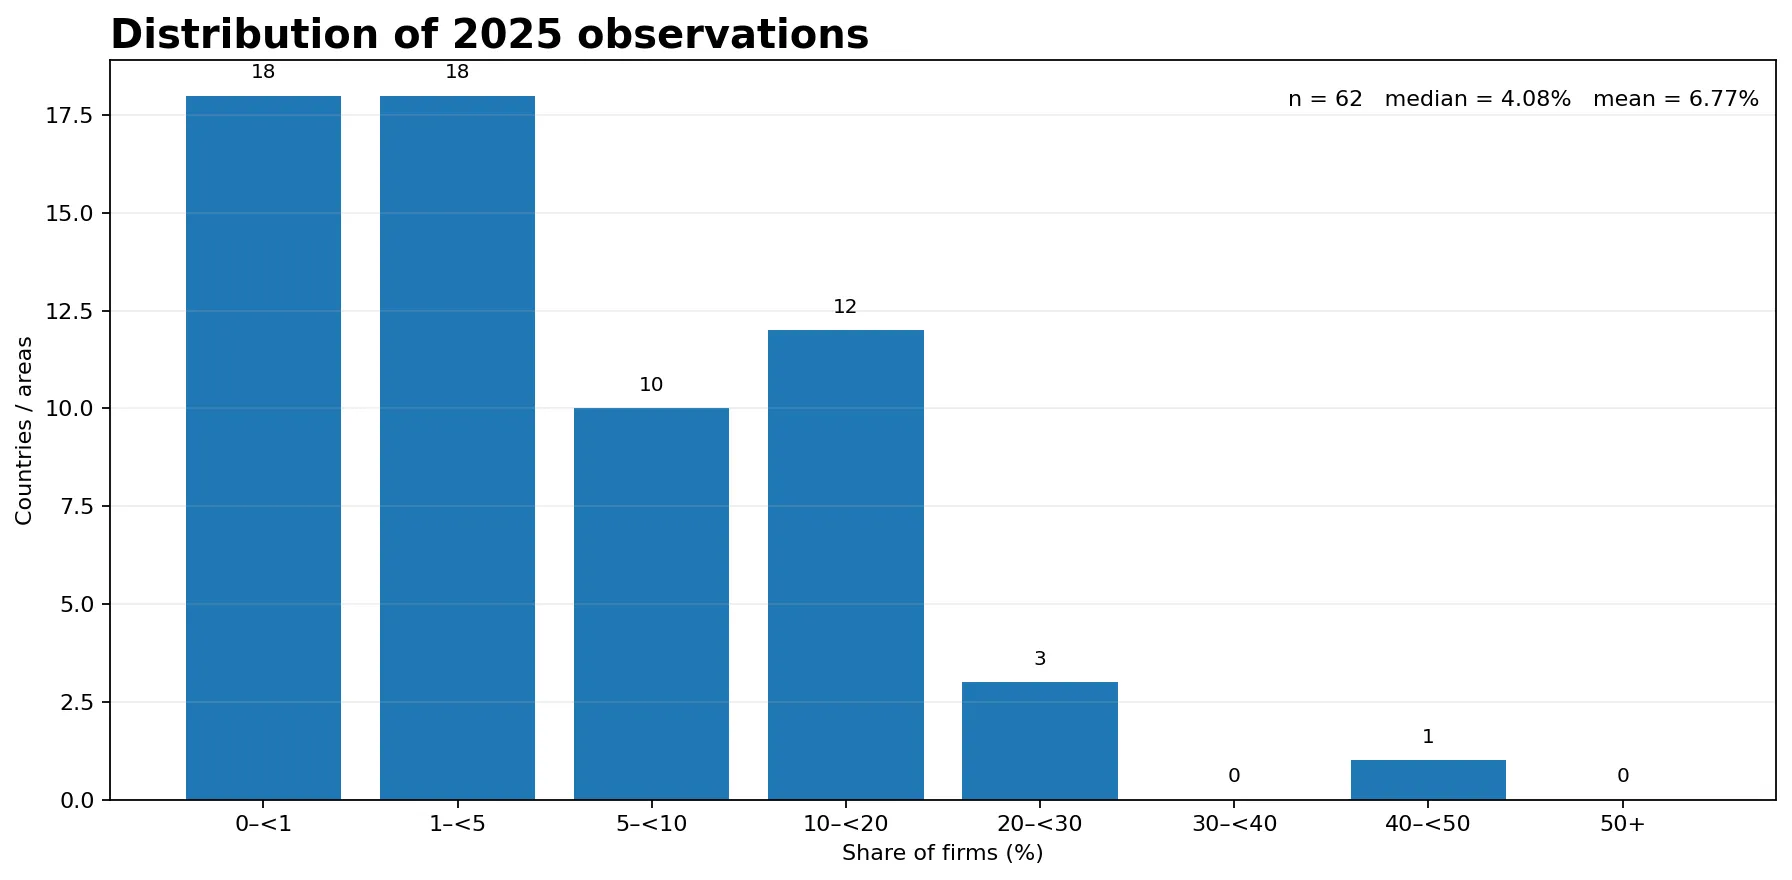
More than half of the synchronized observations are below 5%, while a small upper group reaches double digits and one observation approaches 50%. That is a substantial spread, but it should not be converted into a league table of institutional quality without examining each survey. Sector composition, firm-size strata, geographic coverage, the frequency of tax-official contact and country-specific survey conditions can all matter for interpretation.
Zimbabwe has the highest 2025 observation at 48.75%
Zimbabwe is highest in the 2025 subset at 48.75%, followed by Guinea-Bissau at 28.60%, Kenya at 25.37%, Mauritania at 23.45%, Gabon at 18.86% and Sri Lanka at 18.72%. Nigeria, Liberia, Malawi and Uganda complete the top ten. Nine of those ten observations are in Africa, with Sri Lanka the exception. That is a visible geographic pattern within the available 2025 sample, but the indicator does not identify a shared causal mechanism behind it.
| Country or area | 2025 share of firms |
|---|---|
| Zimbabwe | 48.75% |
| Guinea-Bissau | 28.60% |
| Kenya | 25.37% |
| Mauritania | 23.45% |
| Gabon | 18.86% |
| Sri Lanka | 18.72% |
| Nigeria | 16.85% |
| Liberia | 16.38% |
| Malawi | 16.18% |
| Uganda | 14.58% |
| Mozambique | 13.51% |
| Solomon Islands | 13.41% |
| Djibouti | 11.94% |
| Albania | 11.87% |
| Ethiopia | 11.73% |
Regional concentration should therefore be treated as a descriptive finding rather than an explanation. Differences could be associated with the way firms interact with tax administration, the composition of the formal private sector, business size, sector mix, digital filing, enforcement practices, local institutions or other factors that are not measured by IC.TAX.GIFT.ZS. Testing any of those explanations would require additional variables aligned to the same survey year and set of economies.
A reported 0.0% is not the same thing as missing data
Twelve of the 62 observations dated 2025 are reported as exactly 0.0%: Antigua and Barbuda, Finland, Grenada, Japan, Kiribati, St. Lucia, Lithuania, the Netherlands, Norway, Qatar, Saudi Arabia, and Trinidad and Tobago. These are numeric zero observations in the supplied World Bank series. By contrast, gray areas on the 2025 map have no 2025 value in this synchronized subset and were not filled with zero.
The recorded zeros should also be interpreted within the survey design. A 0.0% country estimate means the indicator reports zero for that survey and question; it does not prove that no informal payment of any kind occurs anywhere in the country. Enterprise Surveys cover a defined formal-private-sector universe and the tax-official item concerns a particular type of inspection or meeting. A true recorded zero and an unavailable observation are therefore distinct statistical states.
The 181 latest available values span 2007–2025
Keeping the most recent non-missing observation for every country or area yields 181 rows, but their survey years are not aligned. Sixty-two are from 2025, 48 from 2024 and 45 from 2023. That places 155 observations in 2023–2025, while the remaining 26 are from 2022 or earlier. The extract is useful for data availability and broad context, but it is not a single-year world snapshot.
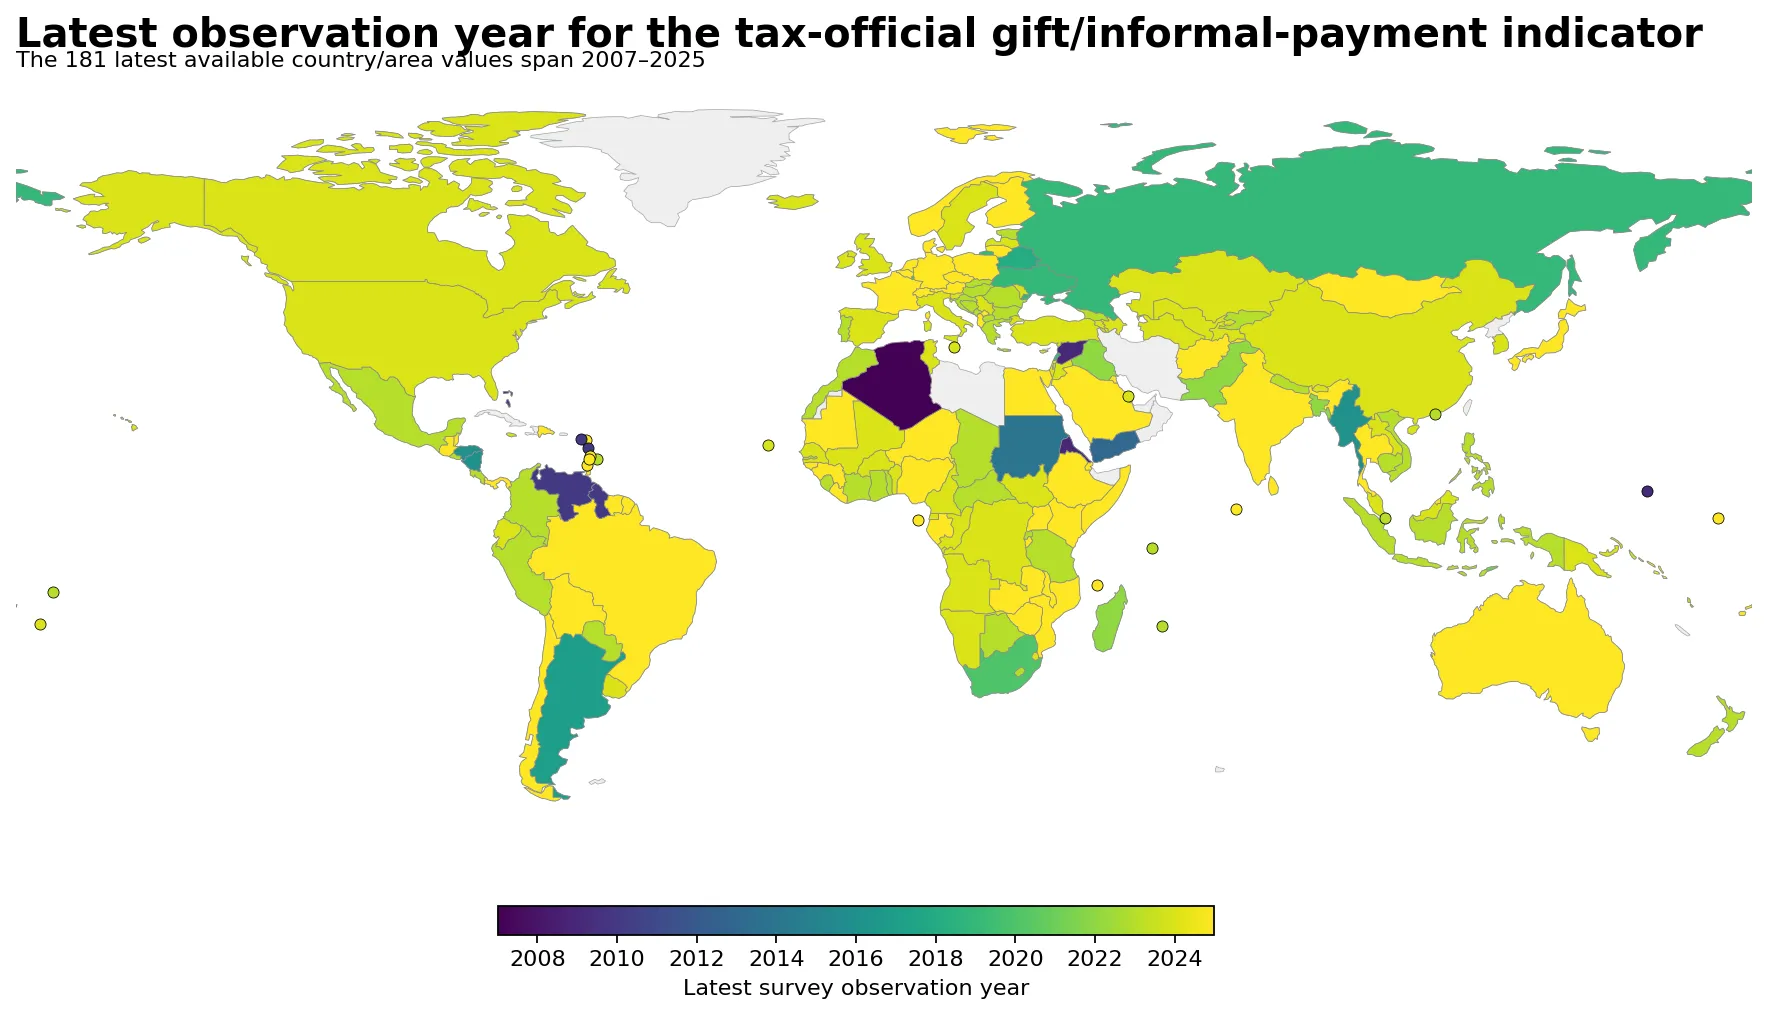
The danger of a mixed-year ranking is clearest at the top. Yemen has the highest numeric latest value at 62.56%, but that observation is from 2013. The Syrian Arab Republic is at 61.00% from 2009, Iraq at 51.23% from 2022, and Zimbabwe at 48.75% from 2025. Sorting those rows without displaying the year would make very different business environments and survey periods look directly comparable. That is why the 2025 subset is the primary comparison here.
Across all 181 mixed-year latest values, the median is 4.63% and the simple mean is 8.26%. Those numbers summarize the distribution of latest retained observations; they are not estimates of a 2025 global firm-level rate. An older last observation can still be useful as a historical data-availability marker, but a current country assessment should first check whether a newer Enterprise Survey has been released.
Major economies show why the survey year should travel with the value
Within the synchronized 2025 subset, India is at 11.62%, Australia 7.91%, Brazil 1.02%, France 1.38%, Germany 0.13%, Japan 0.00%, Nigeria 16.85%, and Saudi Arabia 0.00%. Other major economies have their latest retained observation in a different year: the United States is 2.34% in 2024, Canada 1.63% in 2024, China 0.003% in 2024, Mexico 6.95% in 2023, the Russian Federation 31.72% in 2019, and South Africa 1.71% in 2020. Korea, Rep. is 0.17% in 2024 and is therefore not inserted into the 2025 ranking.
| Country or area | Latest observation year | Share of firms |
|---|---|---|
| United States | 2024 | 2.34% |
| Canada | 2024 | 1.63% |
| Mexico | 2023 | 6.95% |
| Brazil | 2025 | 1.02% |
| France | 2025 | 1.38% |
| Germany | 2025 | 0.13% |
| United Kingdom | 2024 | 0.00% |
| Italy | 2024 | 0.34% |
| Spain | 2024 | 0.00% |
| Korea, Rep. | 2024 | 0.17% |
| China | 2024 | 0.00% |
| Japan | 2025 | 0.00% |
| India | 2025 | 11.62% |
| Indonesia | 2023 | 14.30% |
| Australia | 2025 | 7.91% |
| South Africa | 2020 | 1.71% |
| Nigeria | 2025 | 16.85% |
| Russian Federation | 2019 | 31.72% |
| Saudi Arabia | 2025 | 0.00% |
The table is best read as a reminder about timing rather than as one current ranking. Adjacent survey years such as 2024 and 2025 may provide useful context, but gaps of several years can incorporate changes in tax administration, economic conditions and the composition of surveyed firms. A trend analysis should instead link multiple survey rounds for the same economy and keep questionnaire and methodology changes in view.
This is not a national corruption rate, tax rate, or bribe-amount measure
IC.TAX.GIFT.ZS does not measure personal or corporate tax rates, the number of tax inspections, the value of bribes, criminal cases, or the experience of the general population. It is one percentage derived from a specific Enterprise Surveys question. It can therefore contribute to an assessment of the business environment, but it should not be treated as a complete corruption index or a direct score of tax-administration quality.
The indicator also cannot explain why countries differ. The frequency of face-to-face contact with tax officials, the use of digital filing, sector and firm-size composition, the degree of formalization, survey geography, enforcement practices and many other characteristics may influence the context in which the question is answered. Establishing causation would require additional same-year data and an explicit research design rather than a visual correlation on this map.
Survey coverage and source documentation matter
The World Bank WDI metadata defines IC.TAX.GIFT.ZS as the percentage of firms expected to give gifts or informal payments during meetings with tax officials and identifies World Bank Enterprise Surveys as the source. The Enterprise Surveys indicator description links the measure to survey variable J.5, which asks whether a gift or informal payment was expected or requested in tax inspections or meetings. Country values can be checked on the World Bank indicator page.
World Bank methodology describes Enterprise Surveys as firm-level surveys designed to represent a defined private-sector universe, primarily formal manufacturing and service establishments. The standard universe generally includes privately owned or partly privately owned establishments with five or more employees and uses stratification by firm size, sector and geographic location. That makes these estimates different from administrative counts covering every registered entity, and it also means informal microenterprises and fully state-owned firms may fall outside the standard survey universe.
The 2025 map joins ISO-3 country codes to Natural Earth low-resolution boundaries. Fifty-four of the 62 same-year observations match visible polygons directly and eight small economies are plotted with representative point markers. The observation-year map covers all 181 statistical rows using 160 polygons plus 21 point markers. Missing geography is never converted to zero. Means, medians, quartiles and band counts are calculated directly from the supplied country-level values.
Frequently Asked Questions
What does this indicator measure?
It measures the percentage of firms reporting that a gift or informal payment was expected or requested during relevant inspections or meetings with tax officials. It does not measure the amount paid or a national corruption rate.
Why focus on 62 observations from 2025 instead of all 181 latest values?
The 181 latest values span survey years from 2007 to 2025. Using the 62 observations actually dated 2025 provides a cleaner same-year country comparison.
Does gray on the map mean 0%?
No. Gray means there is no 2025 observation in the synchronized subset. Twelve separate country observations are explicitly reported as 0.0% and are treated as valid numeric values.
Does a higher percentage prove that overall corruption is higher?
No. The measure is limited to one Enterprise Surveys question about tax-official interactions. Broader conclusions about corruption or causation require other evidence and aligned survey years.
Related Maps
Green Map creates custom-edited map images using open geographic data sources such as geoBoundaries, Natural Earth, OpenStreetMap, and government open data.
These maps are edited visual materials, not raw data files, and are provided for education, documents, presentations, and graphic reference.