Kentucky’s statewide average density looks moderate, but the map set shows a much sharper contrast between a few major urban concentrations and large areas of lightly settled territory. The 2024 ACS 5-year estimates give Kentucky a population of 4,534,824 across about 39,485 square miles of land, or roughly 115 people per square mile. Louisville in Jefferson County, Lexington in Fayette County, and the northern Kentucky counties adjoining Cincinnati stand out immediately. Bowling Green, Owensboro, Elizabethtown, Richmond, Paducah, and several other regional centers create smaller clusters. Much of eastern Kentucky and several western counties remain far less dense at county scale.
The maps answer different questions, so their symbols should not be mixed. The census-tract map shows residents per square mile in small statistical areas. The major-cities map uses proportional circles for census-place population. The county population map also uses circle area, but there the circles compare all residents in each county. The county-density map measures population per square mile, and the 2010–2020 change map compares Decennial Census counts over a decade. Jefferson County can therefore rank first in current population and current density while Scott County ranks first in percentage growth from 2010 to 2020. Those are different measurements, not contradictory results.
Table of Contents
Tract-level density concentrates around Louisville, Lexington, and northern Kentucky
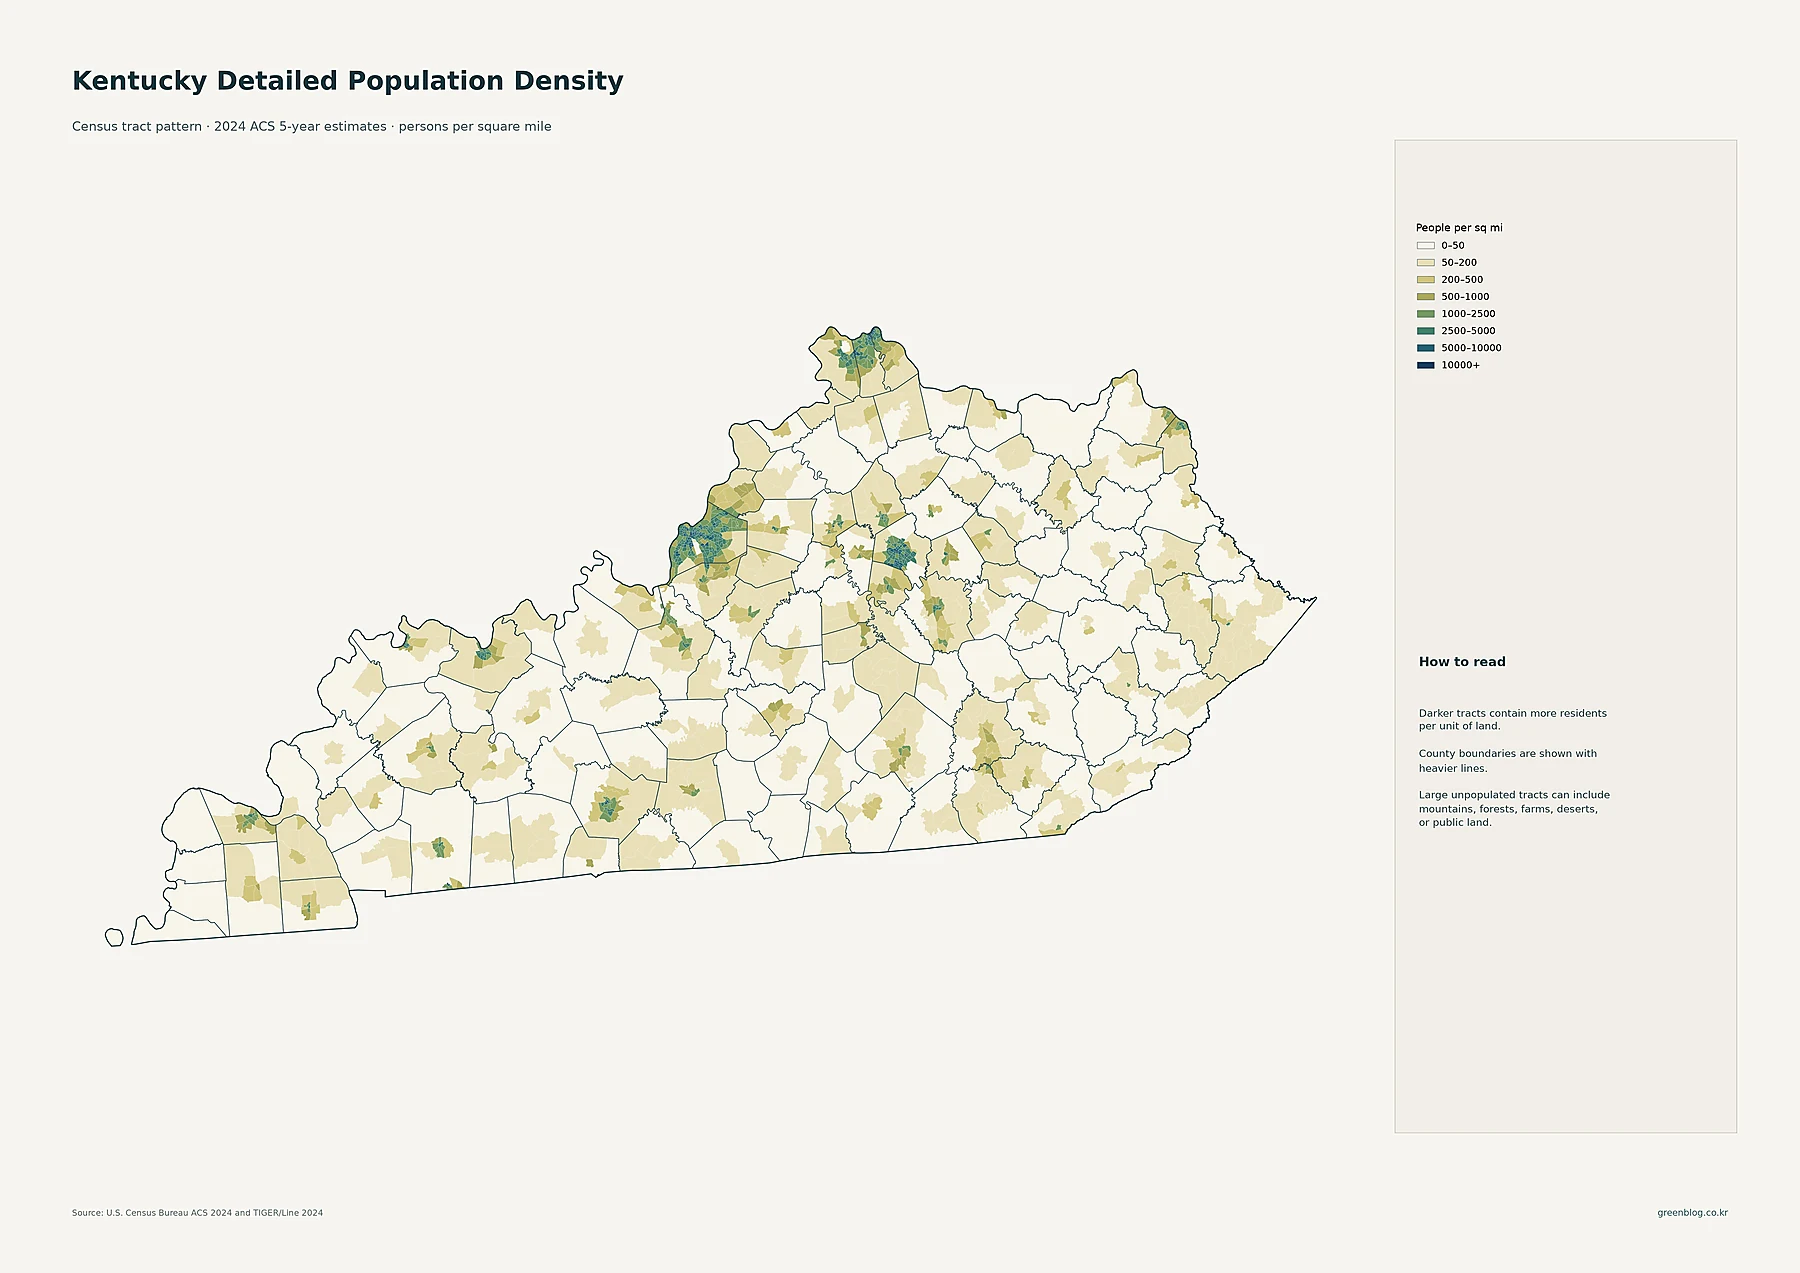
The detailed map makes Louisville the broadest high-density cluster in the state. Numerous darker tracts occupy Jefferson County, and developed tracts continue toward Bullitt County to the south and Oldham and Shelby counties to the east. Lexington-Fayette forms another large, distinct concentration in north-central Kentucky. Smaller but clearly visible clusters around Georgetown in Scott County, Nicholasville in Jessamine County, and Richmond in Madison County sit close enough to make central Kentucky look much more continuously settled than the surrounding rural counties.
At Kentucky’s northern edge, Boone, Kenton, and Campbell counties contain a tight collection of dense tracts next to the Cincinnati metropolitan area. Florence, Erlanger, Covington, and Independence are packed into a relatively small area along and near the Ohio River. Western Kentucky shows separate centers around Owensboro, Henderson, and Paducah, while Bowling Green creates a substantial south-central cluster. Ashland appears in the northeast, but most eastern counties contain only small population centers separated by extensive low-density land. The tract map is therefore the best view for seeing settlement inside counties rather than assigning one average value to an entire county.
Louisville and Lexington dominate place population, but regional centers are spread across the state
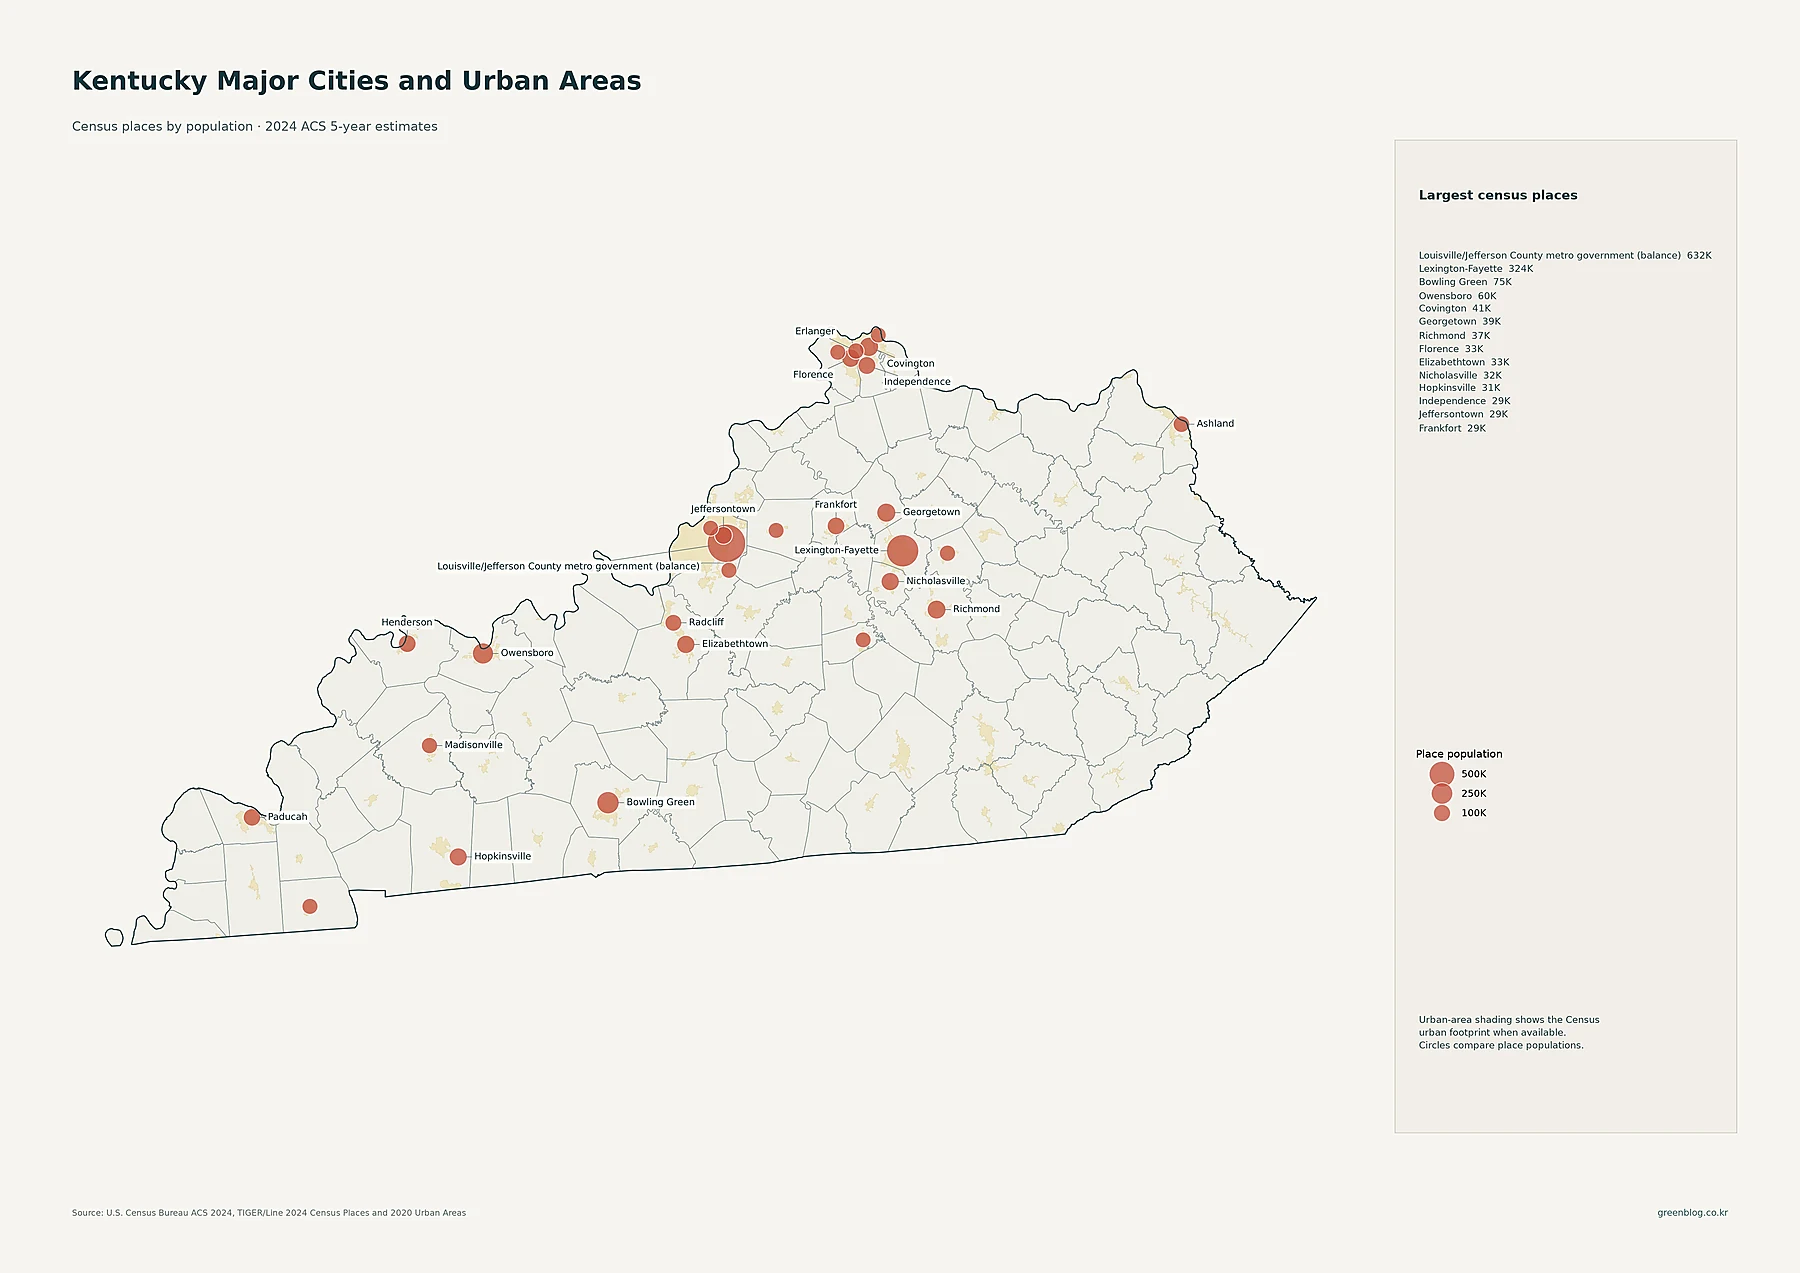
Louisville/Jefferson County metro government (balance) is the largest census place in the supplied dataset at 631,818 residents. Lexington-Fayette follows at 323,725. The gap to the next tier is substantial: Bowling Green has 75,388 residents and Owensboro 60,302. Covington has 41,110, Georgetown 39,117, Richmond 37,111, Florence 32,803, Elizabethtown 32,576, and Nicholasville 32,197. Hopkinsville has 30,906, Independence 29,392, Jeffersontown 29,199, Frankfort 28,503, Henderson 27,852, and Paducah 26,845.
The pattern is more informative than a simple ranking. Louisville and Lexington are two large centers separated across north-central Kentucky. In the far north, Covington, Florence, Independence, Erlanger, and nearby places form a closely spaced group on the Kentucky side of the Cincinnati area. Bowling Green anchors south-central Kentucky, Owensboro and Henderson sit farther west along the Ohio River, Paducah marks the far west, and Hopkinsville is a visible southwestern center. The circle sizes represent total place population rather than land-area density, so this map should be paired with the tract map when the question is how tightly people are concentrated.
Jefferson County has by far the largest population, with Fayette and northern counties forming the next tier
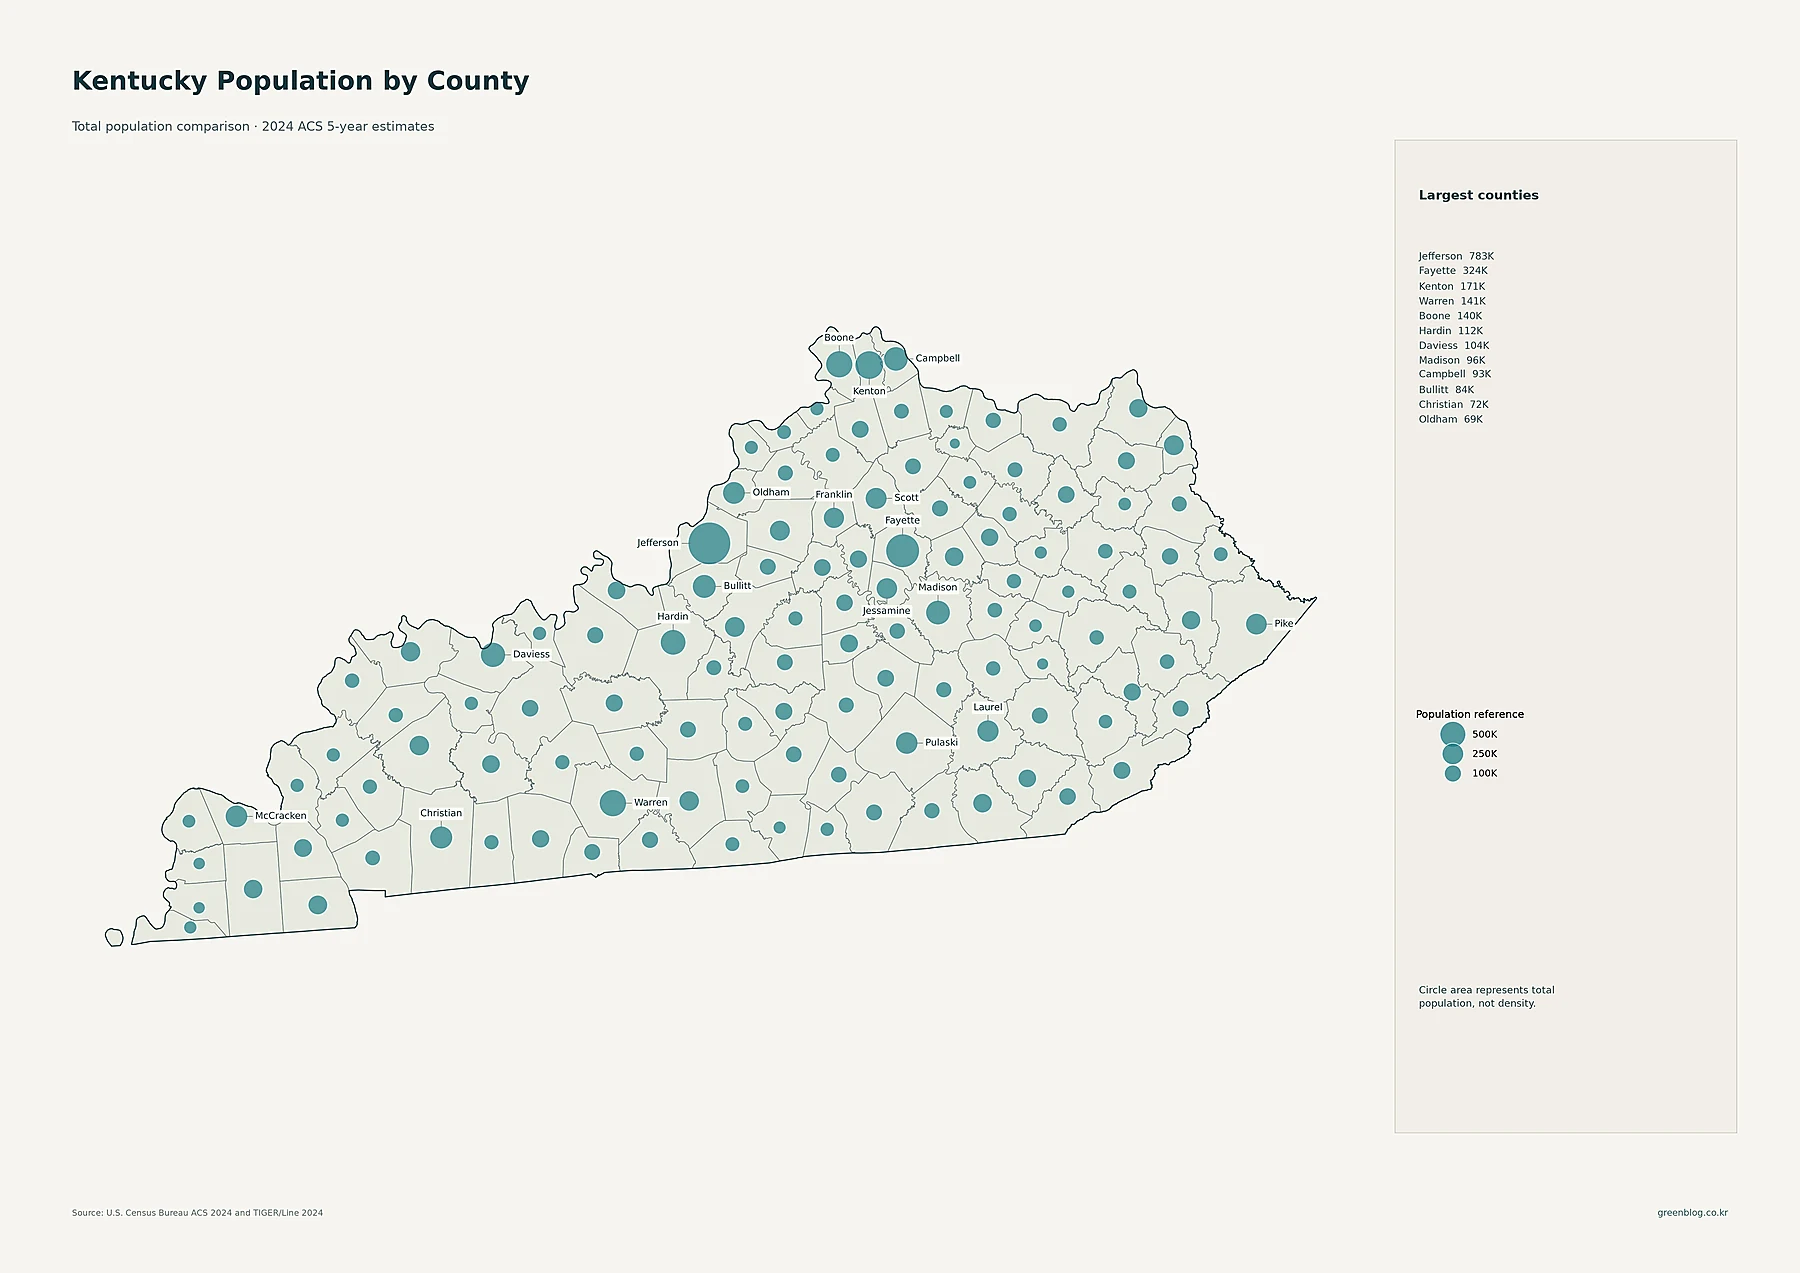
Jefferson County has 783,022 residents, making its circle much larger than any other county. Fayette County is second at 323,725, followed by Kenton at 171,288, Warren at 140,918, and Boone at 139,841. Hardin County has 111,942 residents, Daviess 103,648, Madison 95,769, Campbell 93,426, and Bullitt 84,027. Christian County has 72,069, Oldham 69,257, McCracken 67,564, Pulaski 65,897, Laurel 62,983, and Scott 59,536. The largest circles are concentrated around Louisville, Lexington, northern Kentucky, Bowling Green, and several regional centers.
County population should also be distinguished from place population. Jefferson County’s total of 783,022 is larger than the 631,818 shown for Louisville/Jefferson County metro government (balance) because the county and census-place geographies are not identical. Warren County’s circle includes Bowling Green plus the rest of the county, and Daviess includes Owensboro and surrounding residents. Pike County, with 56,727 residents, is one of the larger eastern counties by total population, yet its broad land area means it does not rank near the top in density. This is exactly why proportional population circles and density shading should be interpreted separately.
Jefferson, Fayette, and Kenton exceed 1,000 people per square mile at county scale
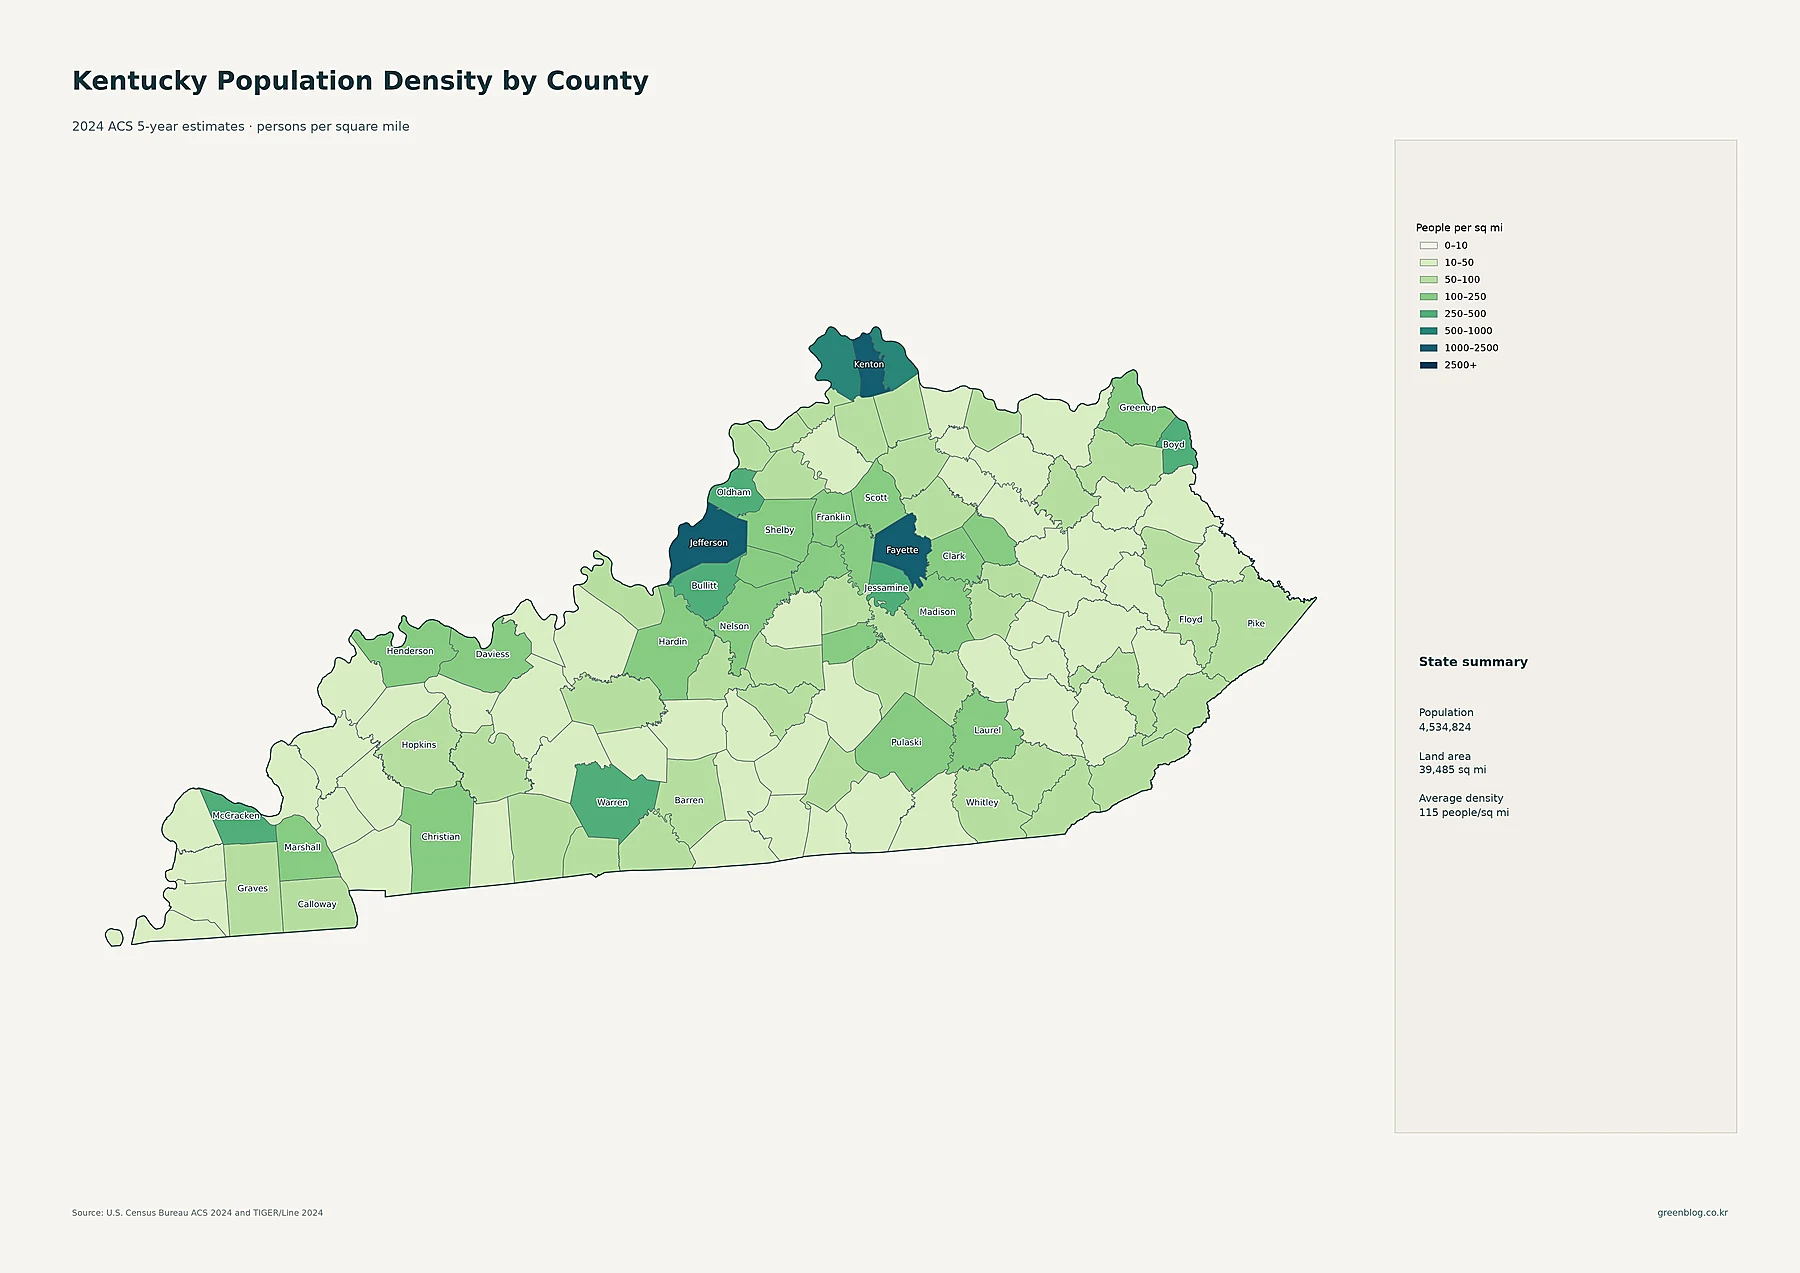
Jefferson County also leads the density ranking at about 2,056 people per square mile. Fayette County is roughly 1,140 and Kenton about 1,068, putting three counties above 1,000. Campbell County is about 617, Boone 568, Oldham 370, Jessamine 317, Boyd 300, Bullitt 283, McCracken 272, and Warren 260. Franklin County, which contains Frankfort, is about 249, while Daviess is 226 and Madison 219. The darker classes therefore emphasize Louisville, Lexington, and northern Kentucky even more clearly than the county population-circle map.
At the low-density end, Hickman County averages about 18.3 people per square mile, Cumberland 19.5, Owsley 20.1, Robertson 22.9, and Crittenden about 25.0. Carlisle and Leslie are also close to 25, while Lewis, Breathitt, Livingston, Wolfe, Butler, and Menifee remain below roughly 31. Kentucky’s statewide average of about 115 people per square mile therefore blends counties above 2,000 with counties near 20. The county map provides a useful administrative comparison, but the tract map reveals that even low-density counties can contain compact towns that disappear when the entire county is reduced to one average.
| Measure | Leading area | Value in the supplied data |
|---|---|---|
| State population | Kentucky | 4,534,824 |
| Largest county population | Jefferson | 783,022 |
| Highest county density | Jefferson | about 2,056/sq mi |
| Fastest 2010–2020 growth | Scott | +21.2% |
| Largest 2010–2020 decline | Bell | -16.0% |
Scott and Warren led 2010–2020 growth, while many eastern counties lost population
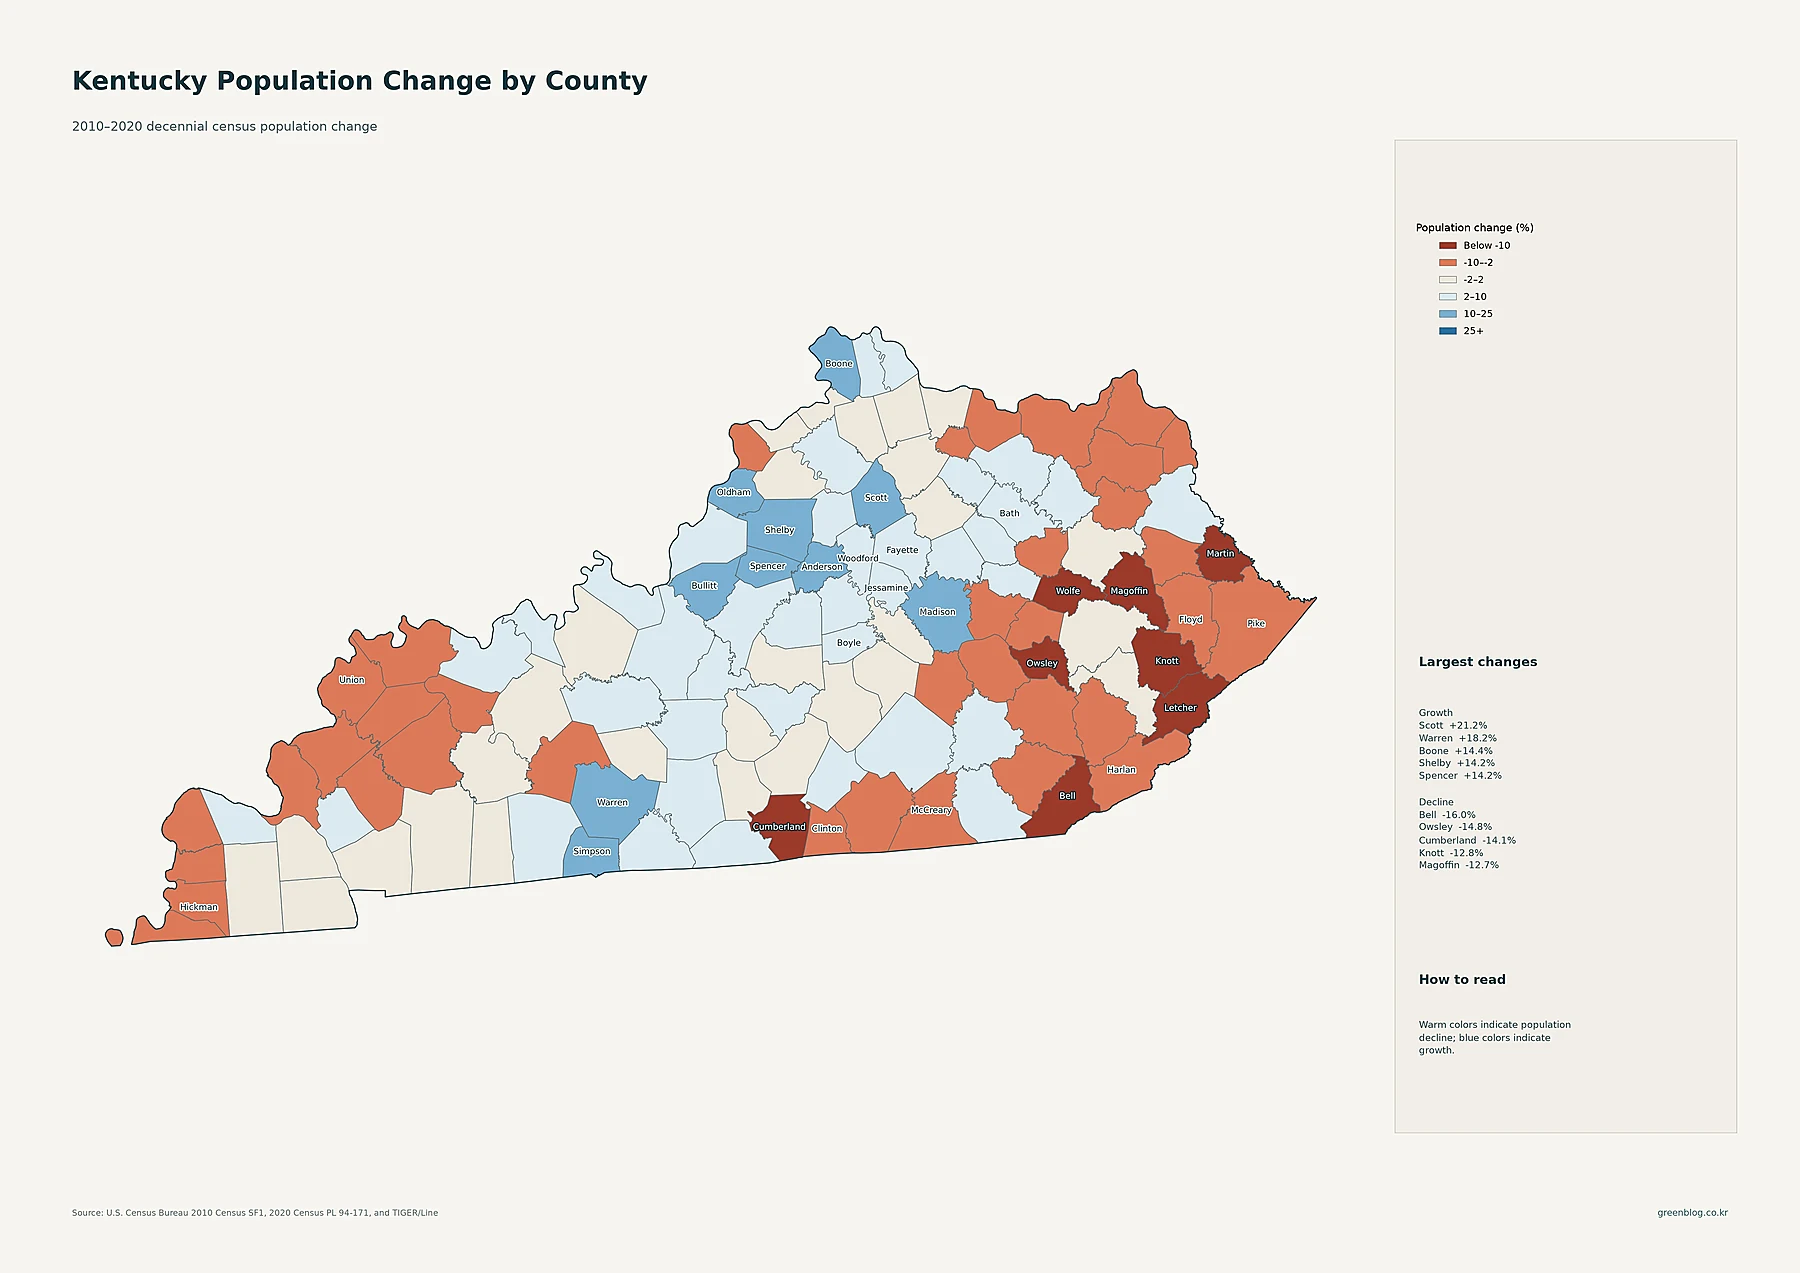
The change map uses 2010 and 2020 Decennial Census counts, not the 2024 ACS estimates used in the current-population maps. Scott County had the largest percentage gain at about 21.2%. Warren County grew 18.2%, Boone 14.4%, Shelby 14.2%, and Spencer 14.2%. Simpson County increased 13.1%, Oldham 12.1%, Madison 11.8%, Anderson 11.3%, and Bullitt 10.6%. Fayette County also grew about 9.0%. The strongest blue areas are concentrated around parts of the Lexington and Louisville regions, northern Boone County, and Warren County around Bowling Green, although growth is not confined to a single corridor.
The eastern decline is one of the clearest patterns on the map. Bell County fell about 16.0%, Owsley 14.8%, Cumberland 14.1%, Knott 12.8%, Magoffin 12.7%, Martin 12.7%, and Letcher 12.1%. Wolfe declined 10.8%, Clinton 9.9%, Pike 9.8%, Floyd 8.9%, and Harlan 8.4%. Declines also appear outside eastern Kentucky, including Union and Hickman in the west, but the warm-color cluster is especially extensive across the eastern and southeastern part of the state. The map establishes where population rose or fell during the decade; it does not by itself establish the causes behind those changes.
Population size, density, and growth reveal different versions of Kentucky
Jefferson County is unusual because it leads both current population and current county density. Fayette also ranks near the top on both measures, while Kenton combines the third-largest county population with the third-highest density. Boone County is another important example: it has nearly 140,000 residents, averages about 568 people per square mile, and grew 14.4% from 2010 to 2020. These counties help explain why Louisville, Lexington, and northern Kentucky dominate the darkest current-density patterns.
Growth tells a different story. Scott County grew faster in percentage terms than Jefferson or Fayette, and Warren County posted the second-highest gain while also ranking fourth in current county population. Pike County remains one of eastern Kentucky’s larger counties by total population, yet it declined almost 10% over the decade and averages only about 72 people per square mile. For practical use, the city map is best for locating major population centers, the county-circle map for comparing resident totals, the tract and county-density maps for measuring concentration, and the change map for seeing direction over time. Viewed together, the five maps show a state with strong urban concentrations in the north-central and northern corridor, important regional centers elsewhere, and a marked contrast between growth in several central and northern counties and decline across much of the east.
Download the Kentucky population map collection
The ZIP collection includes detailed census-tract density, major cities and urban areas, county population totals, 2010–2020 county change, and county population density.
FAQ
Which Kentucky county has the largest population and the highest density?
Jefferson County leads both measures in the supplied 2024 ACS data. It has 783,022 residents and an average density of about 2,056 people per square mile. Fayette and Kenton also exceed 1,000 people per square mile, but their total populations are much smaller than Jefferson’s.
Which Kentucky county grew fastest from 2010 to 2020?
Scott County had the largest percentage increase at about 21.2%. Warren County grew 18.2%, Boone 14.4%, and Shelby and Spencer each grew about 14.2%. These percentages compare county populations in the 2010 and 2020 Decennial Census.
Why does Kentucky’s statewide average density hide so much variation?
The statewide average is about 115 people per square mile, but Jefferson County is above 2,000 while Hickman is near 18 and Cumberland and Owsley are around 20. County and census-tract maps expose a much wider urban-rural range than one statewide average can show.
Related Maps
Sources
- U.S. Census Bureau — American Community Survey (ACS): 2024 ACS 5-year population estimates.
- U.S. Census Bureau — TIGER/Line Shapefiles: 2024 county, census tract, and place geography used in the maps.
- U.S. Census Bureau — Decennial Census: 2010 and 2020 county population counts used for the change comparison.
Green Map creates custom-edited map images using open geographic data sources such as geoBoundaries, Natural Earth, OpenStreetMap, and government open data. These maps are edited visual materials, not raw data files, and are provided for education, documents, presentations, and graphic reference.