Wetlands and forest dominate Jefferson County’s 2025 land-cover picture. Wetlands account for 39.67% and forest for 36.52%, leaving agriculture at 12.79% and developed land at 4.63%. The broad pattern is easy to see: wetter cover becomes especially extensive toward the south, forest remains widespread across the county, and agriculture is more noticeable through the north and north-central areas.
This page provides four complementary map views plus a downloadable set of the original JPG files. The 2025 land-cover map shows the full class mix, the forest-and-farmland map simplifies working land and vegetation, the impervious map isolates hard surfaces, and the 1985–2025 comparison highlights places assigned different classes at the two endpoints. The four original JPG maps are available together in one ZIP below.
Table of Contents
Southern wetlands are the strongest single pattern in the county
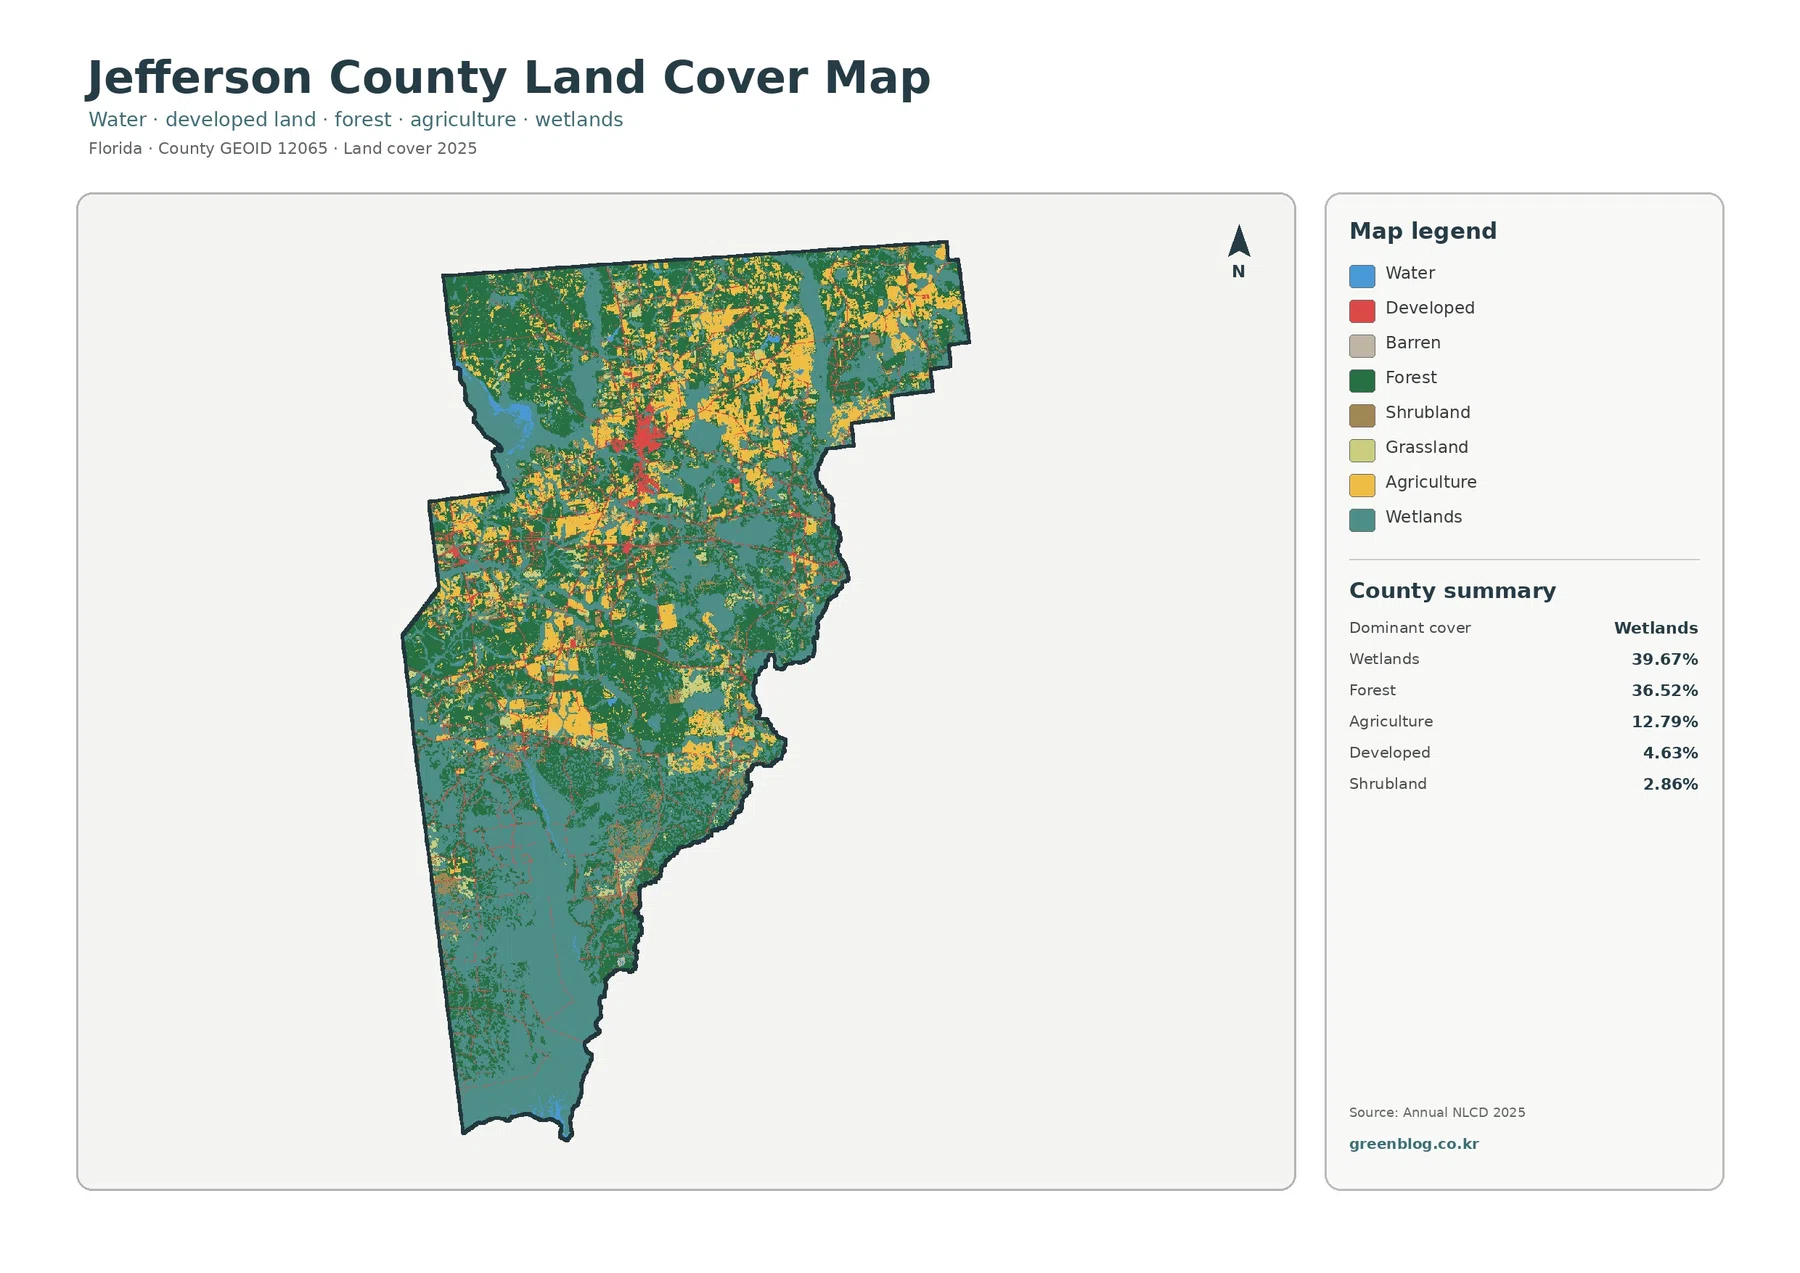
The general land-cover map is dominated by teal wetlands and dark green forest. Wetland cover becomes especially broad in the southern part of the county, while forest remains substantial through the center, east, west, and north. Because the two largest categories together cover more than three quarters of Jefferson County, neither farming nor development defines the countywide map on its own.
Agriculture covers 12.79%. Yellow fields are more frequent in the northern and north-central areas, with additional farm blocks scattered farther south. A Jefferson County mitigation-planning document describes much of the county’s crop and livestock farming as being in the north, providing useful local context for the pattern visible in the map. The mapped agricultural class still does not identify individual crops, farm ownership, or zoning.
Developed land makes up 4.63%, and shrubland is 2.86%. Red developed cover is concentrated near Monticello and along a limited set of transportation and settlement areas instead of spreading across the county. The small developed share is consistent with a landscape where forest, wetlands, and working land occupy most of the area.
County planning material places Jefferson County in the Big Bend region and within the St. Marks and Aucilla River basins. It also identifies major wetland resources associated with Lake Miccosukee, the Aucilla Wildlife Management Area, and St. Marks National Wildlife Refuge. Those references help explain why wetlands are such a strong part of the county map, but the satellite-derived wetland class should not be treated as a legal boundary for any named preserve or regulated wetland.
Hard surfaces are highly localized, with a countywide mean of only 0.75%
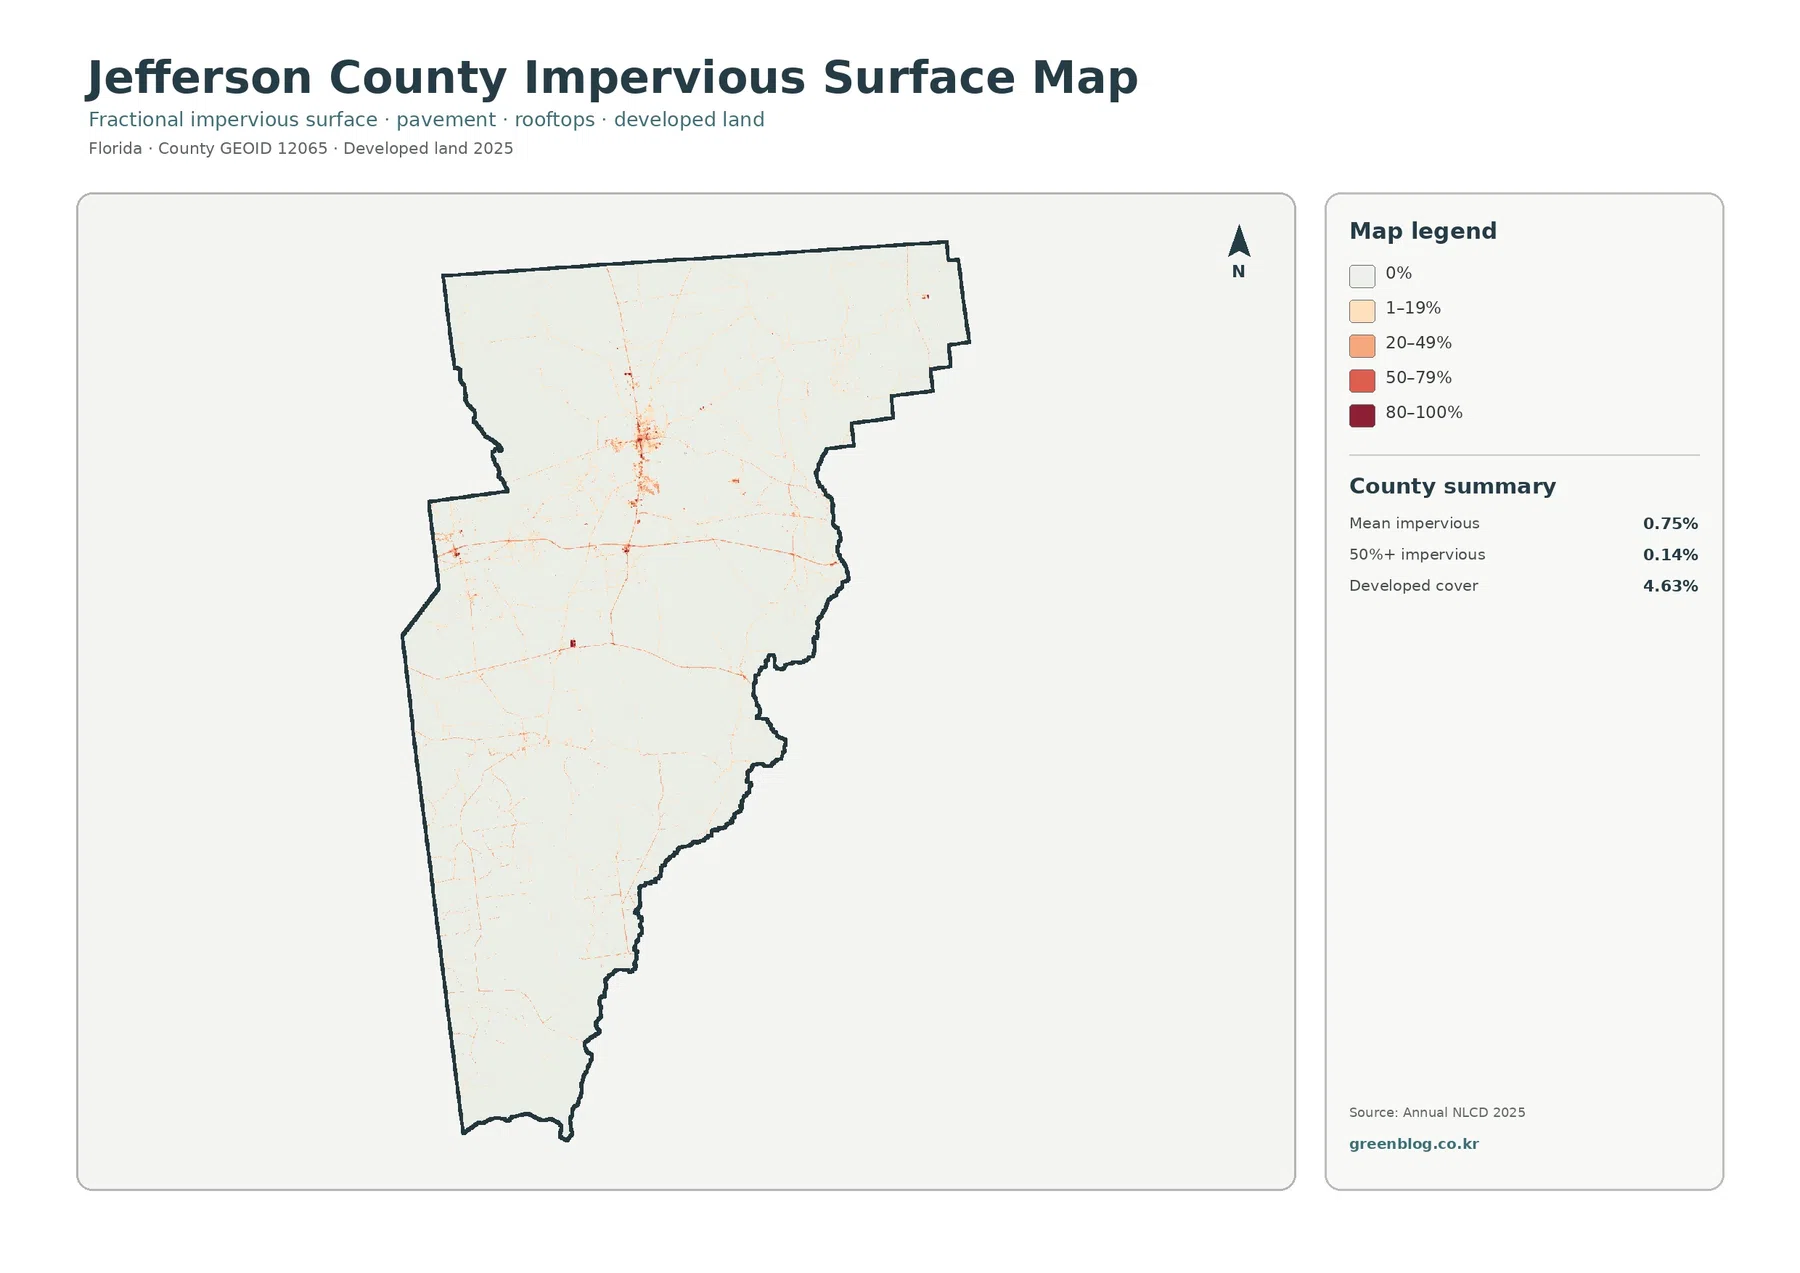
Impervious surface means pavement, rooftops, parking areas, and similar surfaces that do not readily absorb rainfall. Jefferson County’s mean impervious value is 0.75%, and just 0.14% of the county is mapped at 50% or greater imperviousness. These values are far below the 4.63% developed-cover share because developed land can include lawns, trees, bare ground, and other permeable surfaces.
The strongest impervious cluster appears around Monticello. Smaller lines and points follow road corridors and minor settlement areas, but most of the county is very pale on this map. A countywide average below 1% therefore matches what is visible: hard surfaces matter locally, yet they occupy a very small part of Jefferson County as a whole.
Monticello is the county seat and Jefferson County’s only incorporated city according to the county’s history page. That local fact helps explain why one central settlement stands out more clearly than other built areas. The impervious map does not, however, define city limits or legal land use; it simply describes how much of each mapped cell is covered by hard surfaces.
For watershed or classroom work, the impervious layer can be compared with the large wetland areas on the general map. A reader can locate the relatively small built footprint first and then see how quickly surrounding cover shifts to forest, farms, or wetlands. Flood risk, drainage performance, and water quality require additional elevation, soil, rainfall, and infrastructure data and should not be inferred from this layer alone.
Forest and farmland form a mixed northern and central landscape
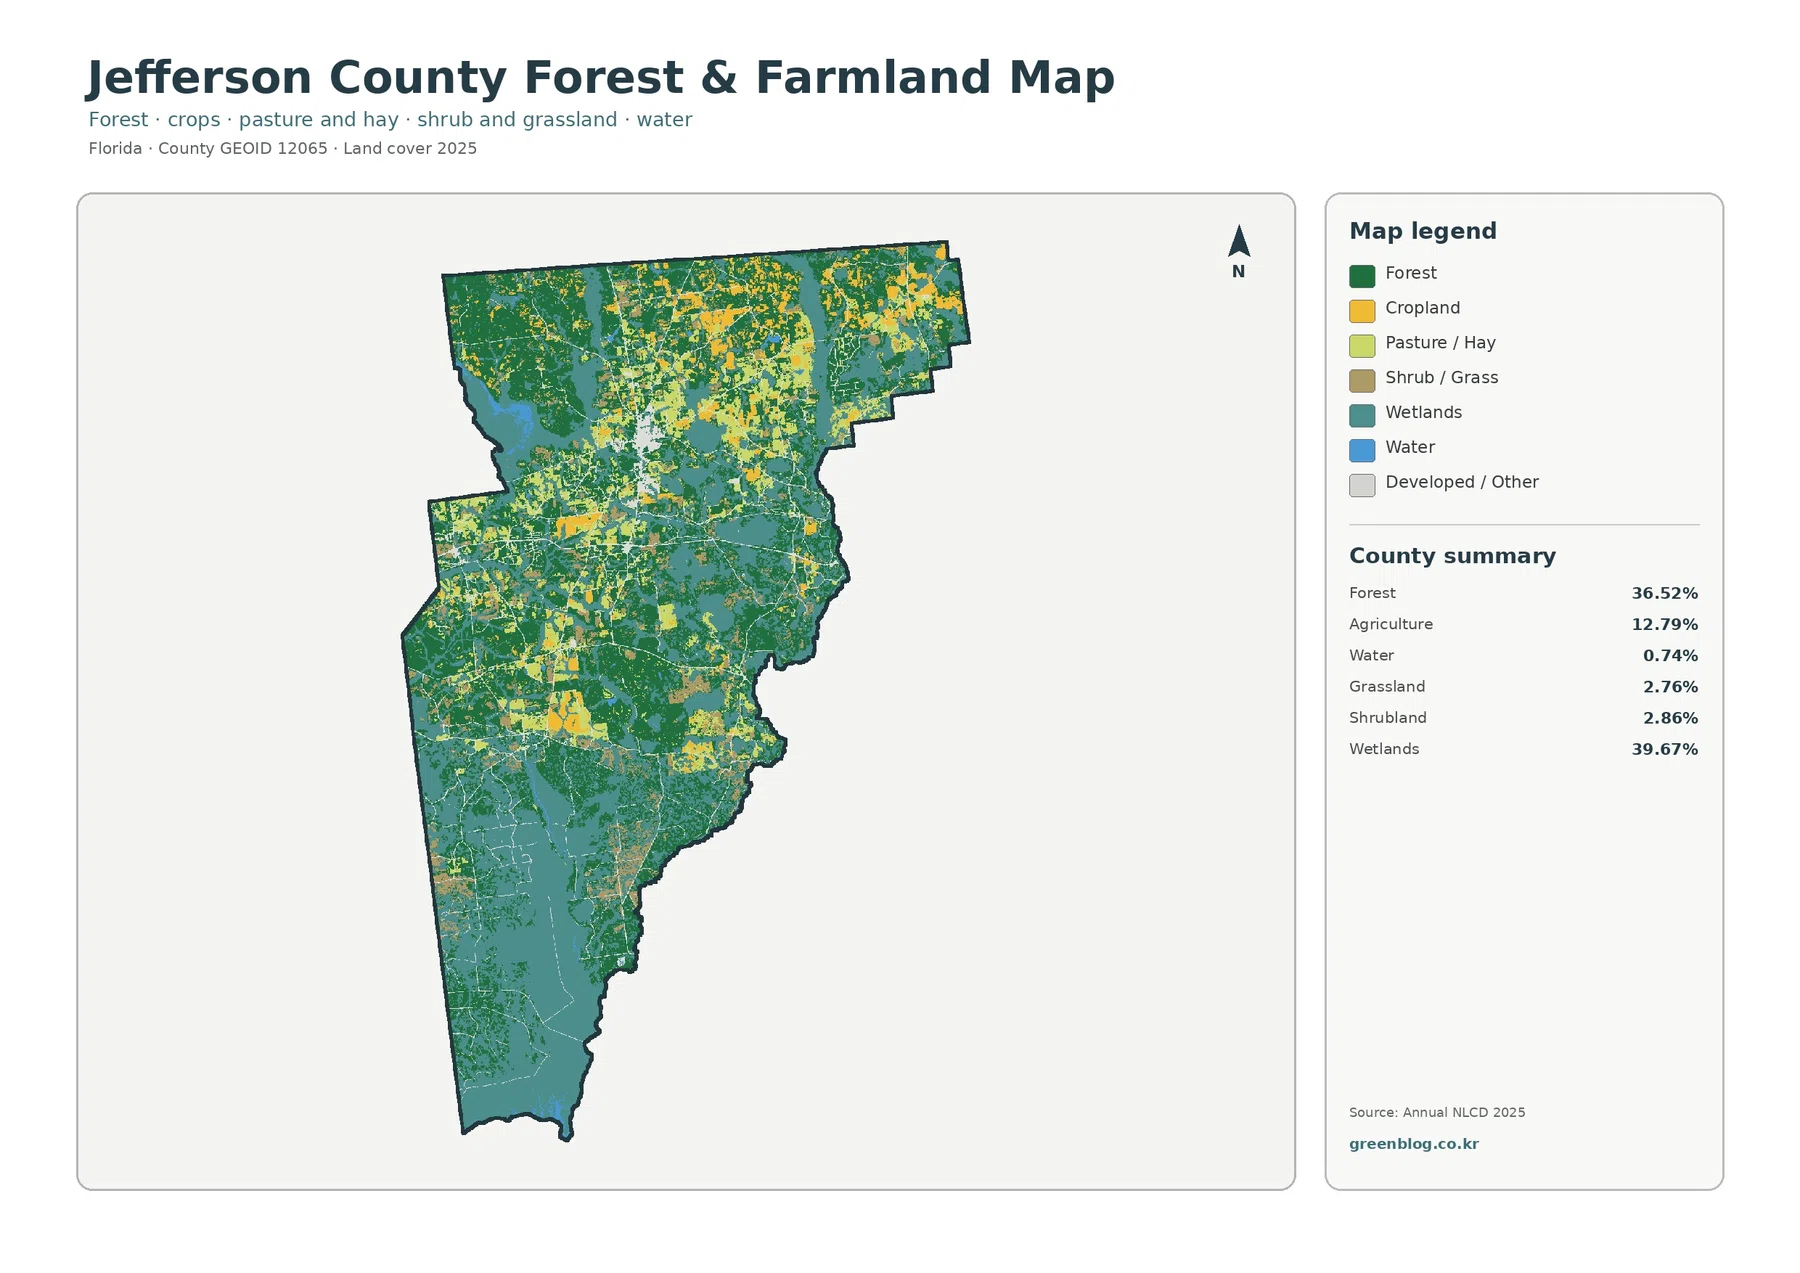
The forest-and-farmland map makes the county’s north-to-south contrast easier to compare. Agricultural areas are most obvious in the north and north-central part of the county, while forest occupies large blocks between and around them. Farther south, wetlands expand and begin to dominate the simplified map. This progression is gradual rather than a sharp boundary.
Forest covers 36.52% of Jefferson County. Dark green tracts appear on both sides of the county and through much of the center, often next to wetlands or agricultural fields. The distribution shows why a countywide forest percentage alone is not enough: the forest is broken into many large and medium tracts that interact with working land and wetter cover.
Agriculture at 12.79% is smaller than forest or wetlands, but it is locally important. UF/IFAS Extension Jefferson County provides agriculture and natural-resource programming, and the county’s own planning documents have long treated agricultural land as an important resource. The land-cover map is not a parcel-level farm map, so yellow cells should be read as a broad surface classification rather than a legal or ownership category.
Grassland and shrubland appear in smaller patches among forest, farms, and wetlands. They are easier to inspect in the original JPG than in a reduced browser preview, especially where several classes meet. Keeping the legend visible when using a cropped map helps prevent these smaller classes from being confused with agricultural or forest colors.
The 1985–2025 map reports an 18.16% class difference
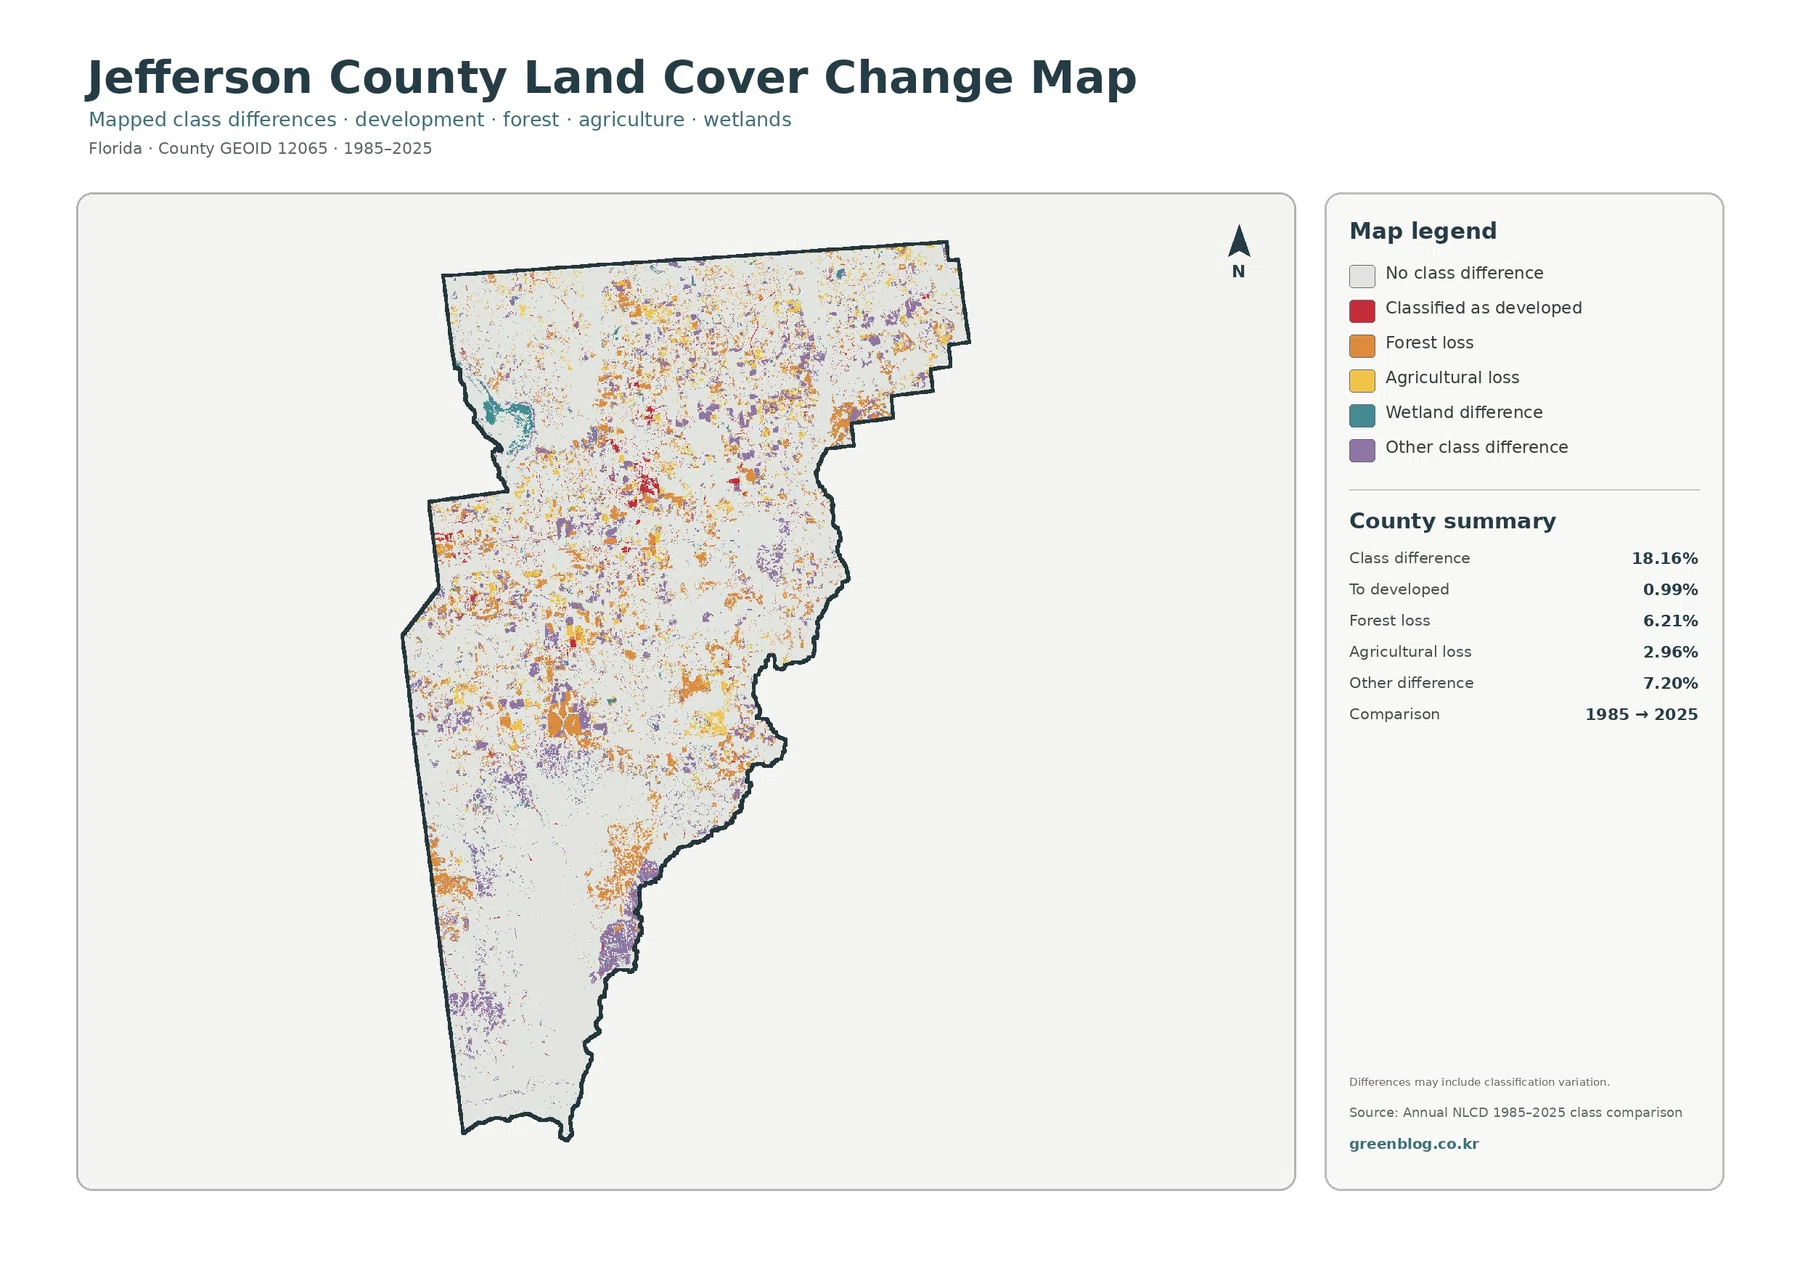
The endpoint comparison reports class differences across 18.16% of Jefferson County. Forest loss is listed at 6.21%, agricultural loss at 2.96%, transition to developed at 0.99%, and other class difference at 7.20%. The colored areas are scattered through the north, center, and parts of the south rather than forming one continuous change zone.
Orange forest-loss patches are frequent enough to stand out across several parts of the county. Yellow agricultural-loss areas are also distributed through the north and central areas, while red developed transitions are relatively limited. The current impervious map can help locate today’s built footprint, but proximity between the two layers does not prove that one mapped condition caused another.
The change map explicitly warns that differences may include classification variation. That note is essential when interpreting the 18.16% figure. Different imagery, observation conditions, mixed cells, and classification methods can assign a different class to the same location even when the physical ground change was smaller or more complicated.
Only the 1985 and 2025 endpoints are shown here. The map does not reveal when a change happened, whether a site changed more than once, or what occurred during the intervening decades. Aerial imagery and intermediate Annual NLCD years are better tools for confirming the history of a location that appears important on the comparison map.
Monticello, northern farms, and the Big Bend wetlands provide useful geographic context
Jefferson County’s official history identifies Monticello as the county seat and only incorporated city. On the maps, its developed and impervious footprint stands out within a much larger rural setting. Moving away from that central cluster, the county quickly returns to forest, agriculture, and wetlands.
The mitigation strategy describes Jefferson County as part of Florida’s Big Bend and notes that the county extends south toward the Gulf of Mexico. It also describes extensive wetland resources in the Aucilla and St. Marks basin setting. This background supports a reader-friendly interpretation of the map: the wetter southern cover is a major county characteristic, while the northern landscape contains more agriculture and settlement.
A useful classroom sequence is to begin with the general map and identify wetlands and forest as the two largest classes. The forest-and-farmland map can then show where agriculture is concentrated, followed by the impervious layer to locate Monticello and the road network. The change map works best at the end, when students already understand what the current landscape looks like.
These maps use raster data, which means the landscape is represented as a grid of cells and each cell receives a representative class or value. Real features do not stop at the pixel edge, and a single cell may contain trees, grass, pavement, water, or a building. For that reason, the maps are suited to county-scale comparison rather than parcel surveys or legal boundary decisions.
The downloadable JPG set is intended for closer inspection and reuse
The ZIP download contains four 2480×1754 pixel JPG files: 2025 land cover, forest and farmland, impervious/developed land, and the 1985–2025 class comparison. The original JPGs are easier than the WebP previews for enlarging legends, checking small patches, and placing maps into documents or presentation slides.
Using the four views together is more informative than relying on one map. A developed patch can be compared with impervious intensity, agricultural areas can be viewed beside forest and wetlands, and a class-difference location can be flagged for follow-up with other years or imagery. Each layer answers a different question about the same county.
Land cover should remain separate from zoning, ownership, parcel boundaries, and development permissions. The maps describe surface conditions and classifications. Anyone making a legal, property, or permitting decision should use the appropriate Jefferson County administrative records in addition to these county-scale maps.
Frequently Asked Questions
What is the largest 2025 land-cover category in Jefferson County?
Wetlands are the largest mapped category at 39.67%. Forest follows closely at 36.52%, while agriculture accounts for 12.79%. The map is therefore dominated by natural cover even though farming remains locally prominent in the north.
Why is developed cover 4.63% while mean impervious cover is only 0.75%?
The measures describe different things. Developed land can include lawns, trees, soil, and other permeable areas around buildings and roads. Impervious cover focuses on hard surfaces such as pavement and rooftops, so its countywide average can be much lower.
Does the 18.16% 1985–2025 class difference equal the true physical change rate?
No. The map notes that classification variation may be included. Important locations should be checked with aerial photographs, additional Annual NLCD years, or other official records before the difference is treated as confirmed ground change.
Map File Information
Download the four original Jefferson County land-cover JPG maps together in one ZIP file.
- Included Files: Use only the versions confirmed in the article and supplied images
- File Type: Use the confirmed download contents
- Intended Use: Printing, education, presentations, and map-based projects
Related Maps
- Alachua County Florida Land Cover Map
- Baker County Florida Land Cover Map
- Bay County Florida Land Cover Map
Sources and References
- MRLC Annual NLCD Data – Official source for Annual NLCD land-cover data.
- USGS Annual NLCD Land Cover Classification – Describes the main Annual NLCD land-cover classes.
- U.S. Census Bureau TIGER/Line Shapefiles – Official geographic boundary data used for county reference.
- Jefferson County Local Mitigation Strategy – Official county planning background on northern farming, the Big Bend setting, river basins, and wetlands.
- UF/IFAS Extension Jefferson County – Local agriculture and natural-resource education and Extension information.
Green Map creates custom-edited map images using open geographic data sources such as geoBoundaries, Natural Earth, OpenStreetMap, and government open data.
These maps are edited visual materials, not raw data files, and are provided for education, documents, presentations, and graphic reference.