Lincoln County sits in south-central Kentucky, with Stanford near the middle of the road network and Hustonville, Crab Orchard, and Eubank providing useful reference points to the west, east, and south. The physical maps add features that are easy to recognize once those towns are located: Cedar Creek Lake in the east, the Dix River toward the northeast, and Green River tributaries through the central and western valleys. High-resolution JPG versions of the maps can also be downloaded for printing, classroom activities, presentations, and offline reference. High-resolution map files are available for download in the section below.
Roads, streams, and hills often occupy the same corridors in Lincoln County. Curving routes on the general map frequently line up with valleys on the terrain-and-water map, while the elevation colors show higher ground rising beside those passages. Comparing the maps in that order makes the positions of Stanford, Crab Orchard, Hustonville, and Eubank easier to understand than viewing each town as a separate point.
Table of Contents
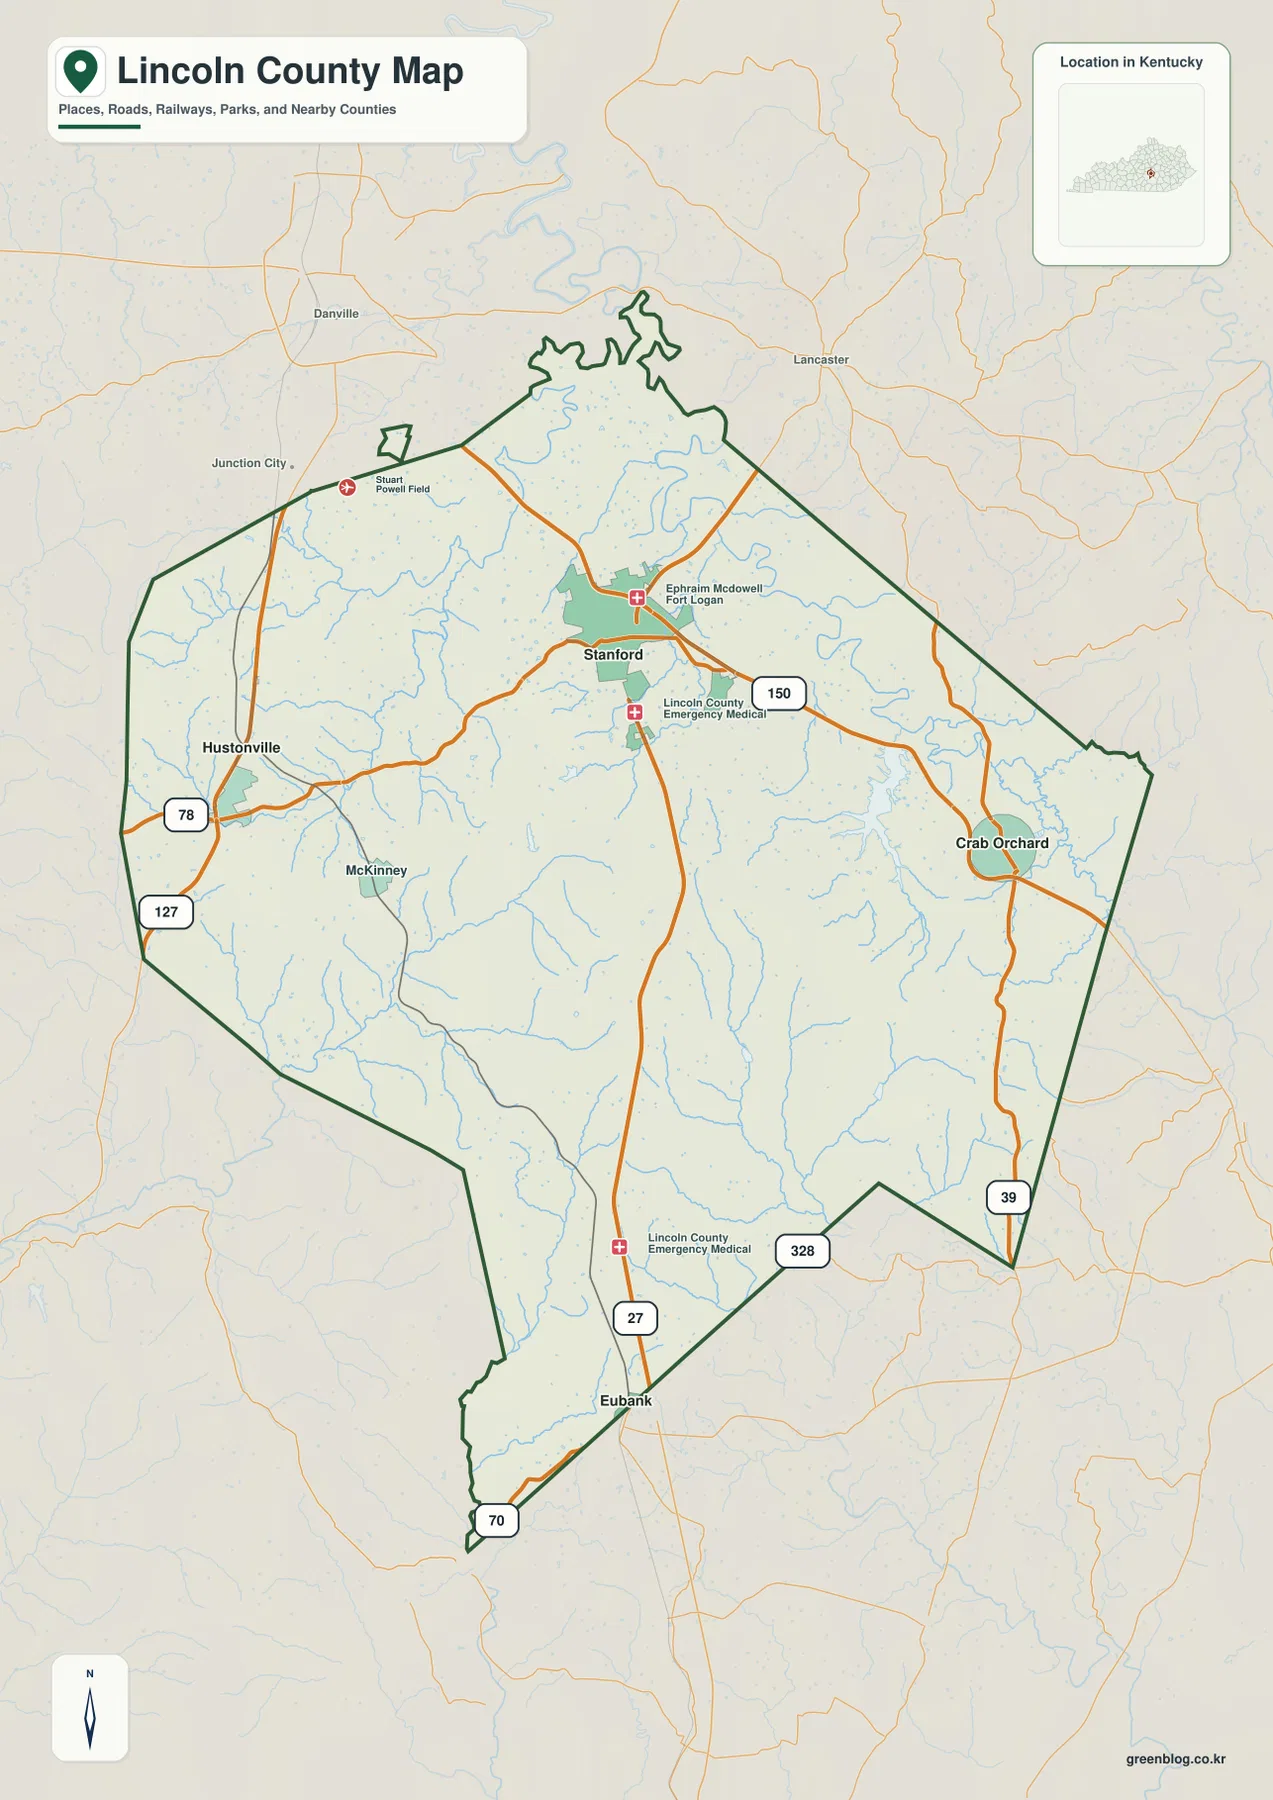
Stanford as the county’s road reference point
The general county map places Stanford near the middle of the outlined county and shows several major numbered routes converging in or near the city. Route 150 provides the clearest eastward reference toward Crab Orchard, while Route 27 runs south from the Stanford area toward the lower part of the county. On the west side, Hustonville is associated with Routes 78 and 127. Farther southeast, Routes 39 and 328 appear near the boundary, and Route 70 is labeled near the southern tip by Eubank. Those route numbers make it possible to orient the county without depending on every local road.
The road network is not arranged as a neat grid. Curves become more frequent away from the central Stanford area, especially toward the southern and southeastern hill country. That shape matches the physical geography shown on the other maps: valleys create easier travel corridors while ridges interrupt direct east-west movement. As a result, two places that appear close in a straight line may be connected by a road that bends around higher ground or follows a creek valley for part of the trip.
Outside labels provide additional orientation. Danville and Junction City appear beyond the northwestern side of the county, while Lancaster is shown beyond the northern to northeastern side. These surrounding references help place Stanford and the western towns in a broader Kentucky context without turning the map into a statewide road atlas. For a visitor trying to understand where Lincoln County sits relative to nearby communities, the general map is the most complete single view because it combines boundary, settlements, water, and major routes.
The map should still be treated as a geographic reference rather than a live transportation service. It does not show current closures, construction, traffic conditions, private-access restrictions, or every minor road. Those details change more frequently than the county’s overall road pattern. The strength of this map is the stable relationship between Stanford, Hustonville, Crab Orchard, Eubank, the county boundary, and the principal numbered routes.
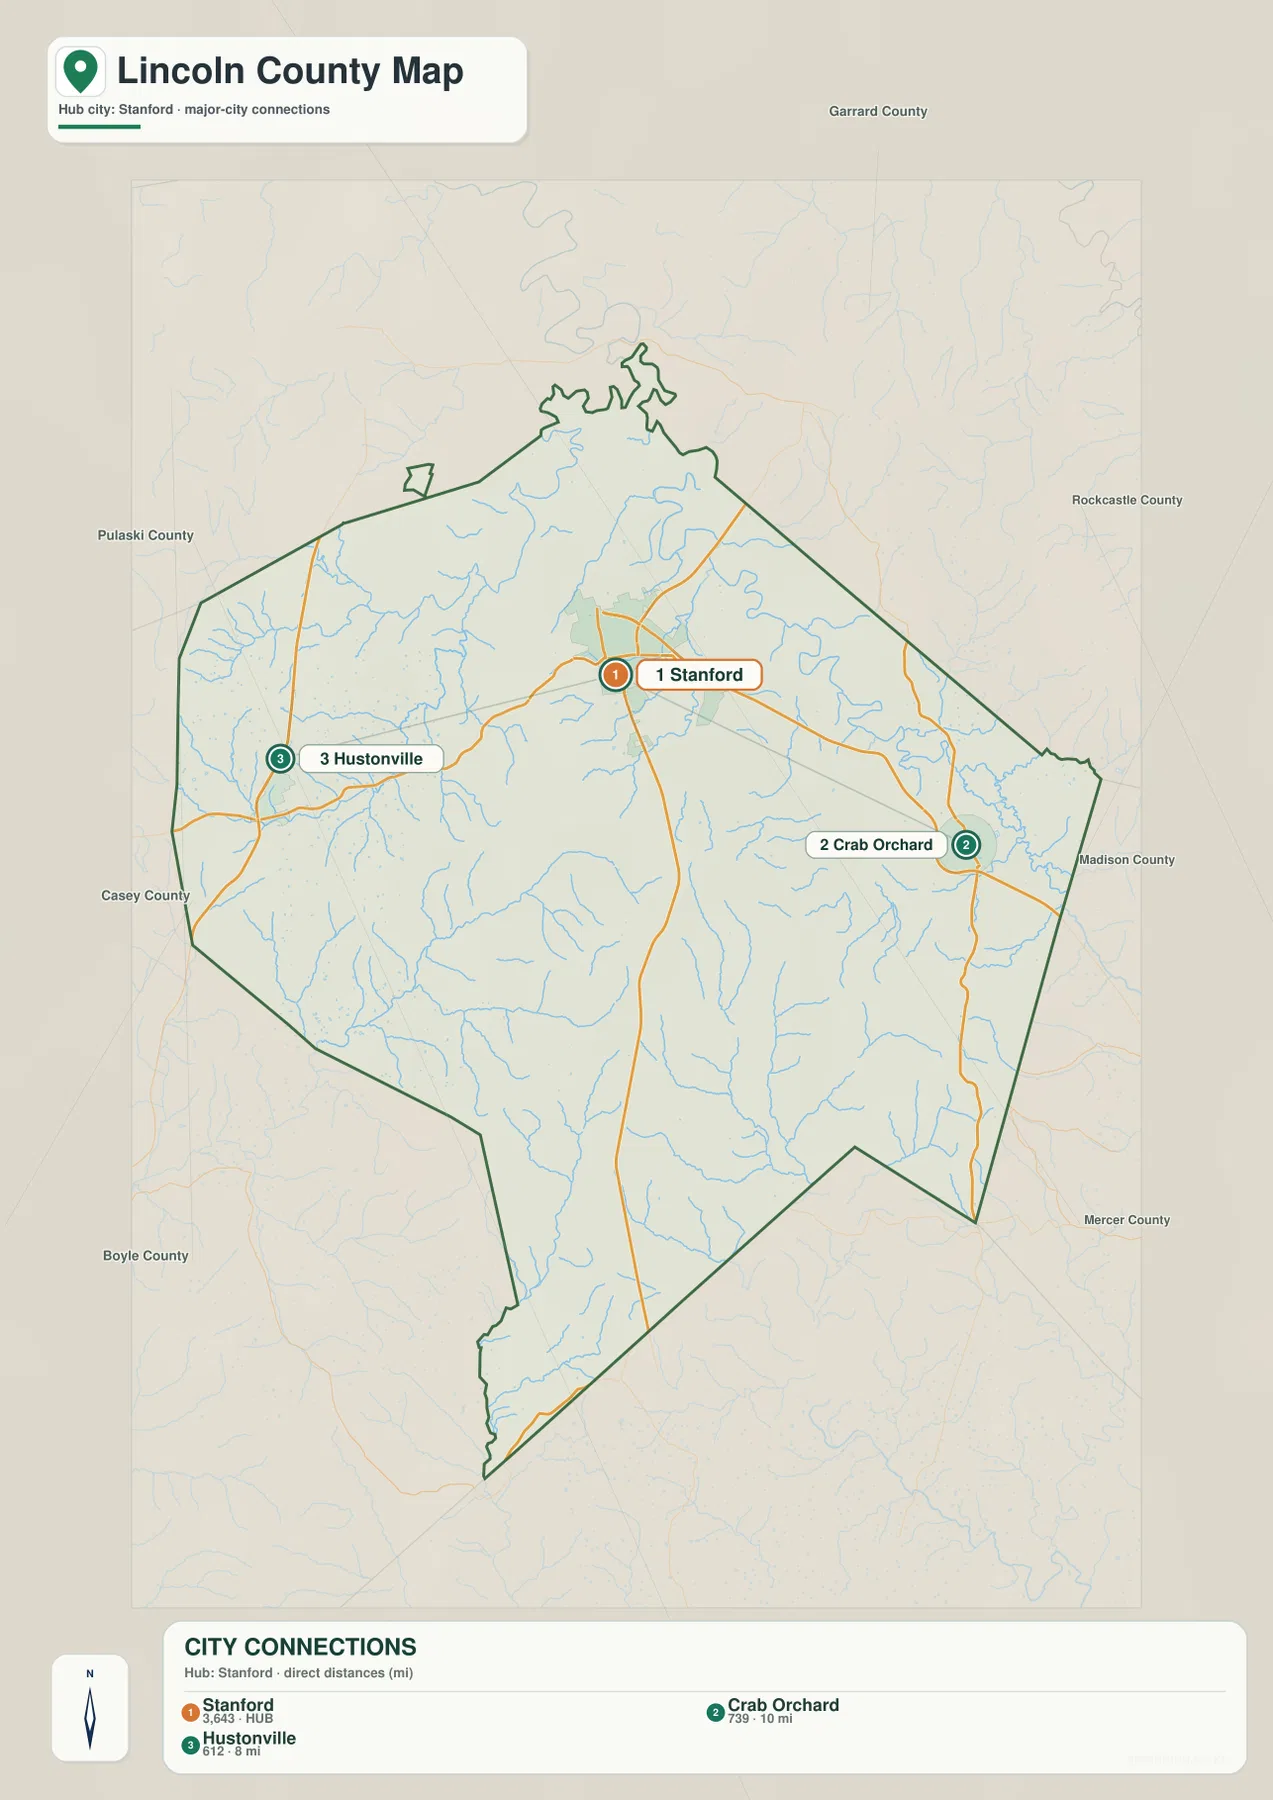
Three city anchors and what the connection distances mean
The city-connections map deliberately simplifies the county. Stanford is marked as the hub, with Hustonville and Crab Orchard as the other two highlighted city points. The legend gives a direct distance of about 8 miles from Stanford to Hustonville and about 10 miles from Stanford to Crab Orchard. These are straight-line distances between the mapped points, not driving distances measured along the road network. They are best used to compare relative spacing rather than to estimate travel time.
This simplified view makes the east-west spread of the main settlements easier to see. Hustonville sits near the western side of Lincoln County, Stanford occupies a central position, and Crab Orchard is close to the eastern side. The general map adds smaller labels such as McKinney and Eubank, showing that settlement extends beyond the three ranked city markers. In other words, the city map is an orientation tool, not a complete inventory of every community.
For classroom use, the cleaner city map can be more effective than the detailed road view. A teacher can ask students to compare the location of Stanford with Hustonville and Crab Orchard before introducing roads, rivers, or elevation. In a presentation, the direct-distance labels give a quick sense of scale while the surrounding county names provide regional context. Once the broad pattern is understood, the other maps can supply the physical and transportation detail that the city map intentionally leaves out.
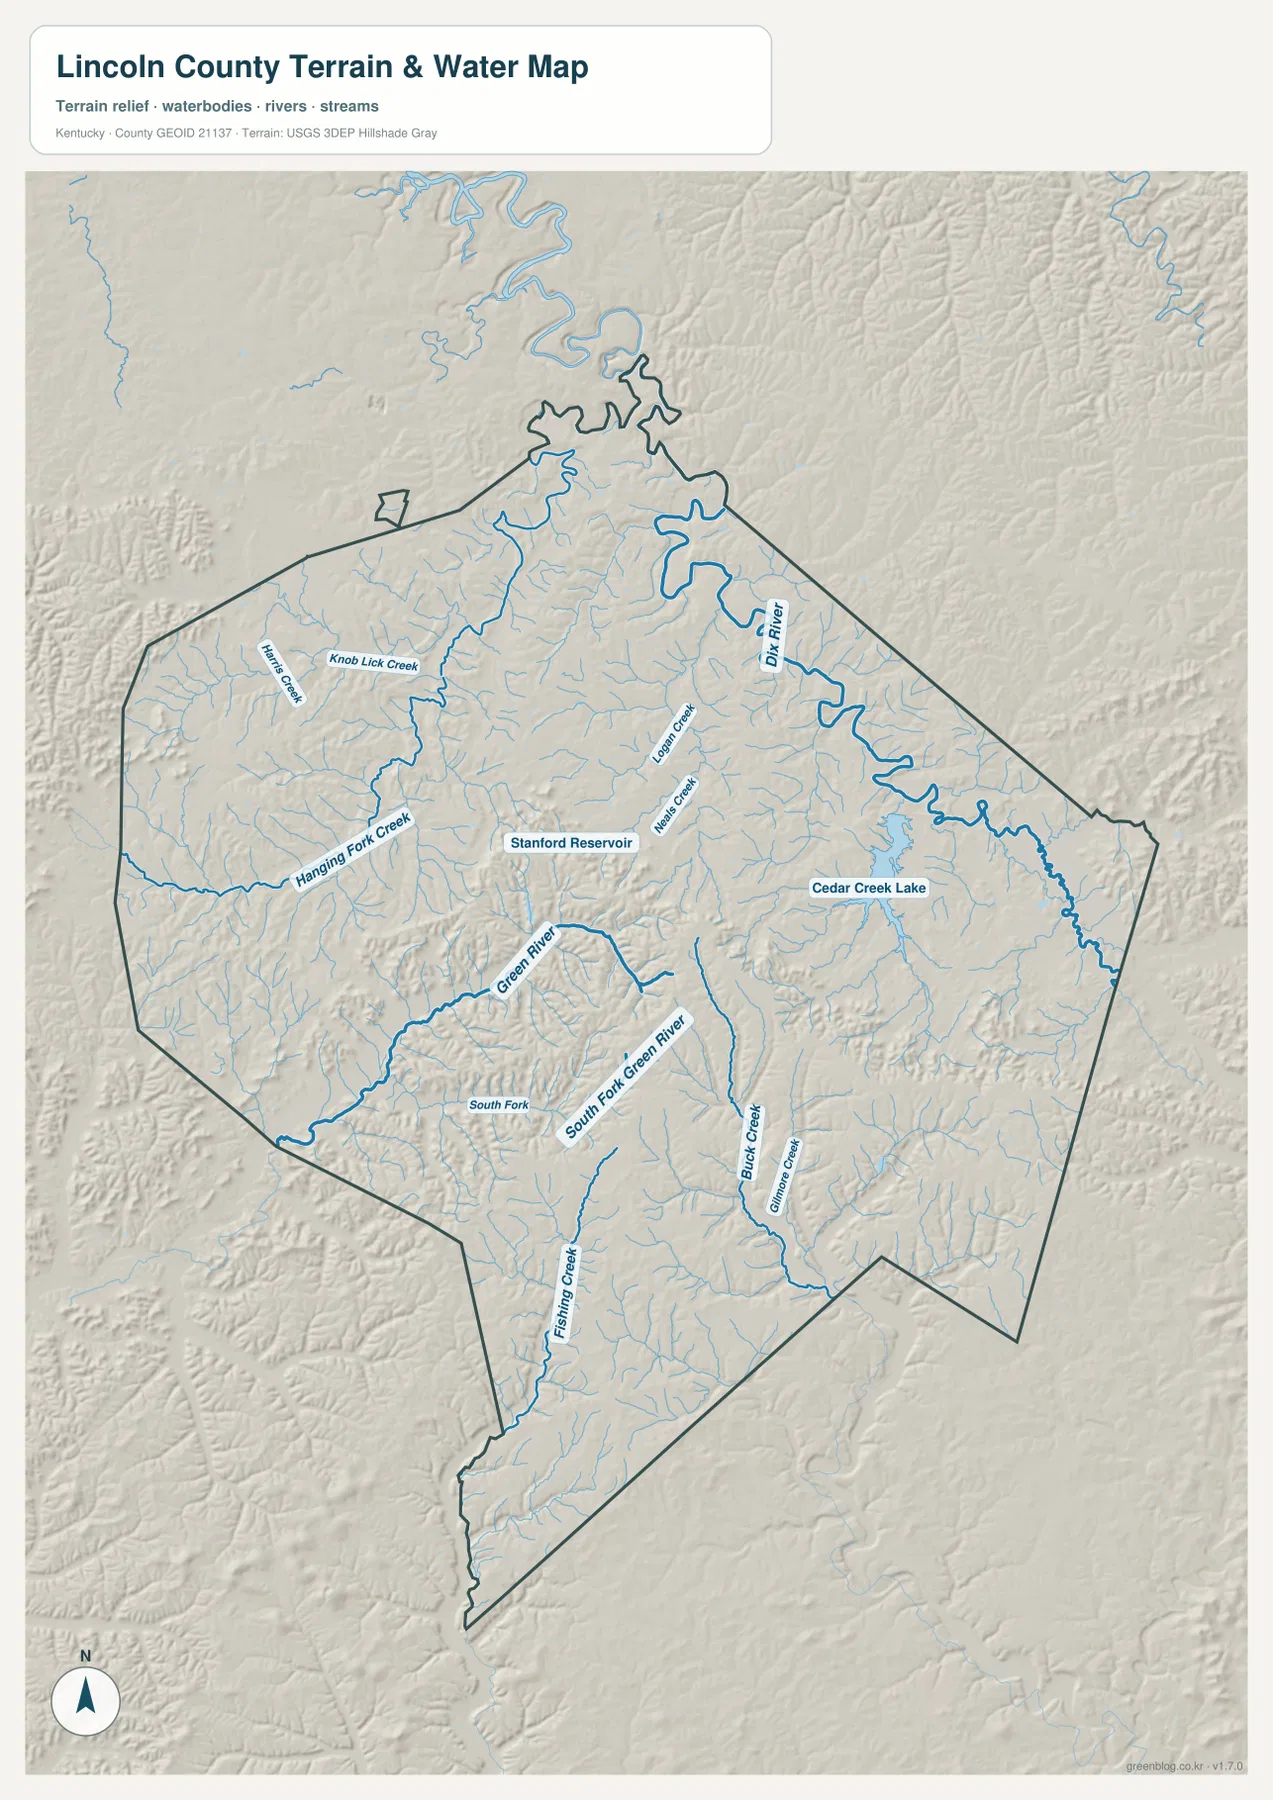
Cedar Creek Lake between the Dix River and Green River systems
The terrain-and-water map shifts attention away from roads and toward drainage. The Dix River is the largest named watercourse on the northeastern side, while the Green River and South Fork Green River form prominent lines through the central and southern interior. Numerous smaller tributaries feed those larger channels. Hanging Fork Creek and Knob Lick Creek are labeled in the west and northwest, while Fishing Creek and Black Creek help define the southern part of the map. Together they show a county divided by many narrow valleys rather than one broad, simple basin.
Cedar Creek Lake is one of the easiest features to identify because its open-water shape is clearly visible east of Stanford. The smaller Stanford Reservoir gives another useful reference point closer to the central city. A reader can locate either water body first and then follow the surrounding creeks to understand how the interior is organized. This is often more intuitive than beginning with dozens of minor stream branches at once.
The shaded terrain beneath the blue water lines is important. In the southern half of Lincoln County, many streams occupy long troughs between ridges, and the tributaries repeatedly branch into smaller hollows. The main roads on the general map often bend through the same low corridors. That overlap helps explain why the transportation pattern looks irregular: the easiest path across rolling or steep ground is frequently a valley rather than a straight line over higher ridges.
The water map is not a flood-hazard map, navigation chart, parcel map, or statement of public access. Stream width on the graphic should not be interpreted as a measurement of discharge or depth, and a visible lake or creek does not by itself establish boating, fishing, or shoreline-access rules. Those questions require current information from the appropriate agency. Here, the value of the map is geographic: it shows where the named water features sit and how drainage lines relate to the county’s hills and settlements.
A 234–437 meter landscape with higher southern ground
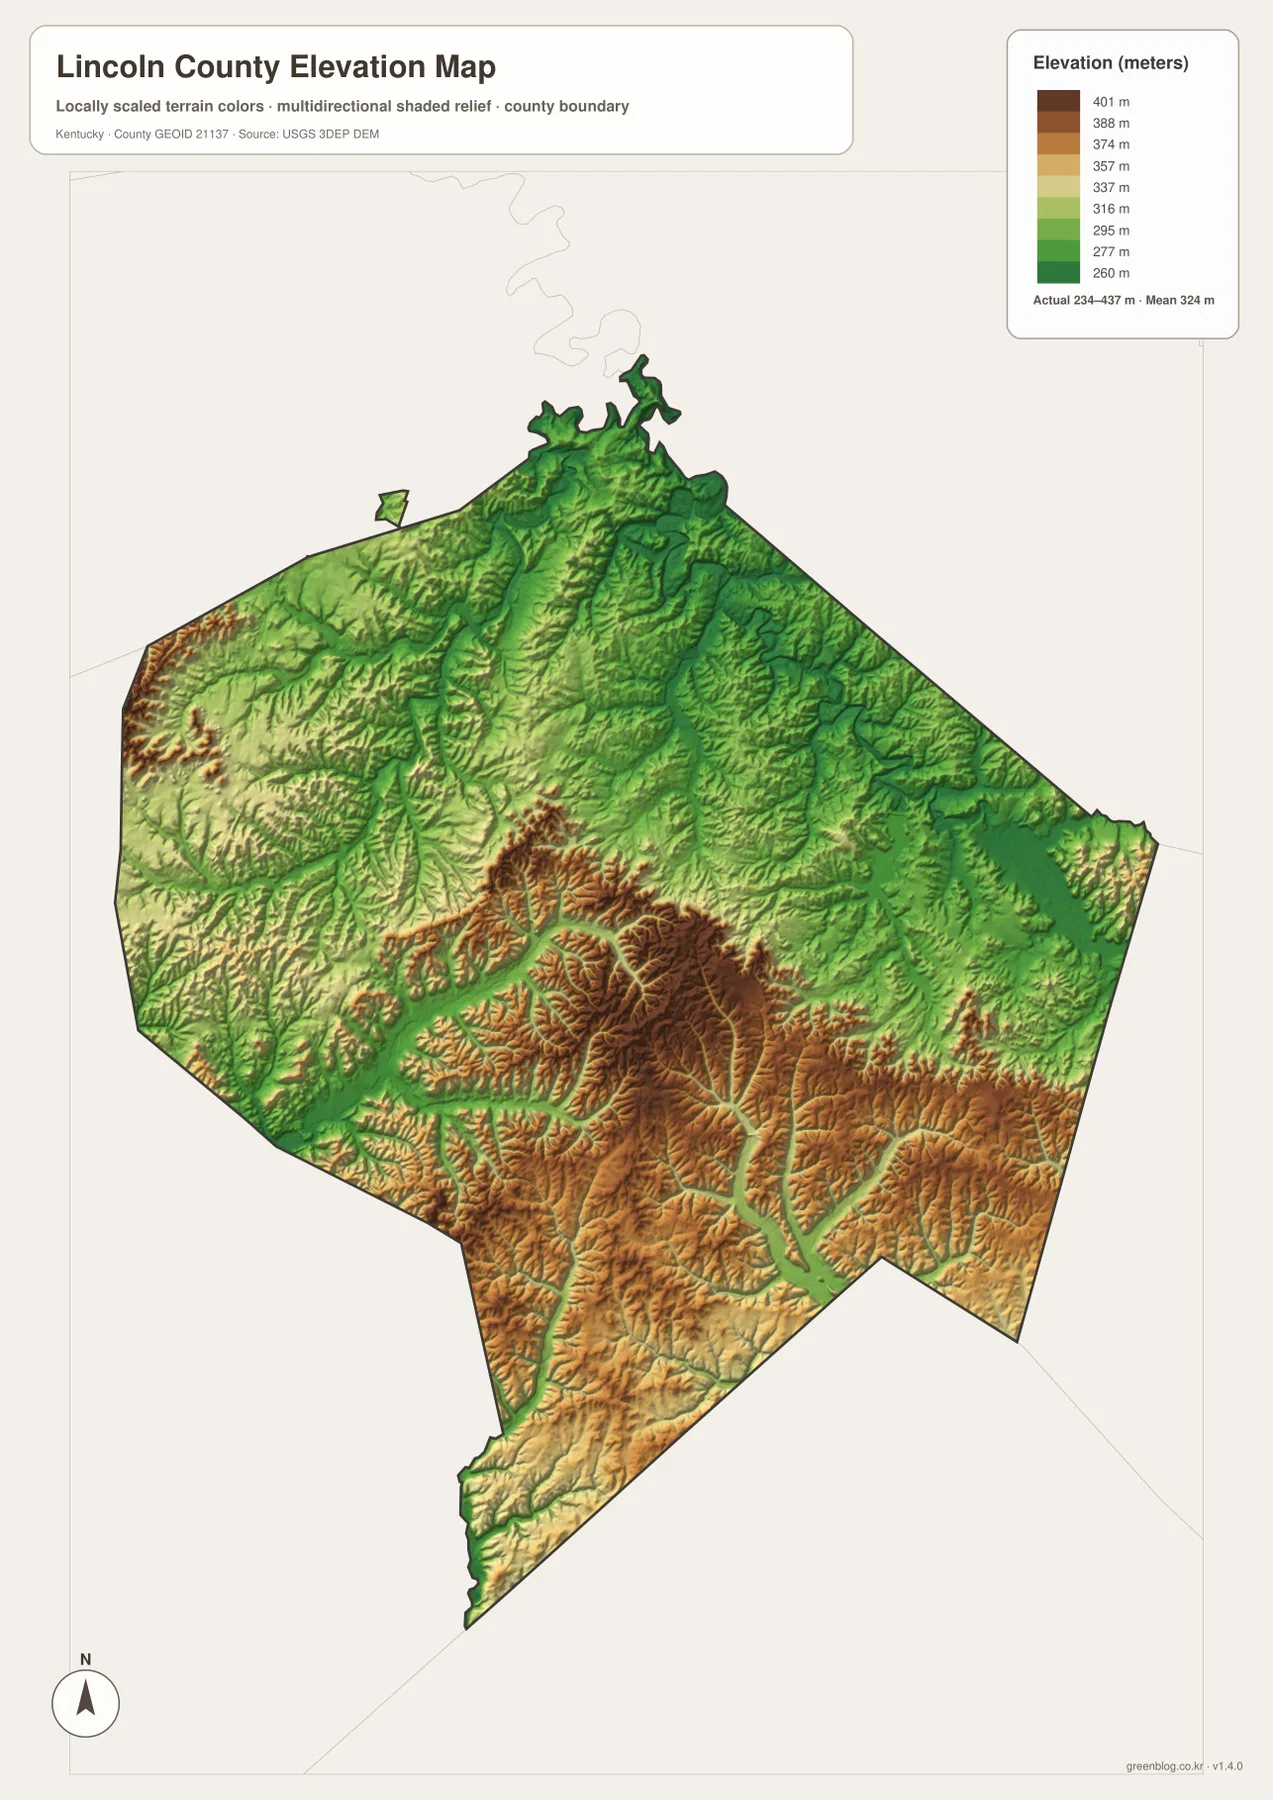
The elevation map reports an actual county range of approximately 234 to 437 meters and a mean near 324 meters. Low areas are shown in green, while yellow, tan, and brown indicate progressively higher terrain. The most striking pattern is a broad zone of higher ground across the central-southern interior, cut by long green valleys. Higher ridges also appear along parts of the western side and near the southern margins. Lower terrain is more extensive across parts of the north and east.
This is not a simple slope from one edge of the county to another. High ridges and low valleys interlock. A green corridor can extend deep into a brown upland area, and neighboring ridges may be separated by only a narrow stream valley. That texture closely matches the terrain-and-water map, where the densest tributary patterns occupy the same dissected hill country. It also explains why route geometry changes from relatively open sections around Stanford to more winding segments farther south.
The eastern side provides a useful comparison. Cedar Creek Lake and the Dix River sit within lower corridors, but higher ground rises nearby rather than far away. Around Crab Orchard, the general map looks fairly straightforward, yet the elevation surface shows that the surrounding landscape is not uniformly flat. The western side around Hustonville likewise combines valley floors with nearby higher ridges. Straight-line distance alone therefore says little about how easy the terrain is to cross.
The displayed elevation surface is generalized for county-scale comparison. Its 234-meter minimum and 437-meter maximum describe the range used for the map, not a survey certificate for a particular parcel, roadway, building site, or stream crossing. Engineering, construction, drainage design, and legal surveying require current source elevation data or field measurements. For education and general reference, however, the map clearly communicates the contrast between lower corridors and the higher southern and central ridges.
Choosing the map that matches the question
Use the general county map when the task involves roads, towns, county boundaries, or overall orientation. It contains the richest combination of labels and is the strongest starting point for locating Stanford, Hustonville, Crab Orchard, McKinney, and Eubank. The city-connections map is better when the goal is a cleaner comparison of the three main highlighted city points and their straight-line spacing.
Choose the terrain-and-water map for river, creek, lake, and valley questions. Dix River, Green River, South Fork Green River, Cedar Creek Lake, Stanford Reservoir, and several named creeks provide clear anchors. Choose the elevation map when the emphasis is relief rather than individual road names. Its color scale makes the higher southern and central terrain obvious and gives a quick sense of why valleys matter so much to travel and drainage.
The article uses smaller WebP versions for efficient viewing, while the download archive contains the original JPG maps at 2,572×3,638 pixels. Those files are more suitable for printing, classroom worksheets, presentation slides, and offline study. They are explanatory graphics rather than legal boundary records, flood studies, navigation products, parcel surveys, or engineering plans. The reference links below provide authoritative source portals when a project requires current underlying data.
Frequently Asked Questions
Are the 8-mile and 10-mile city connections driving distances?
No. The city-connections map labels direct, straight-line distances from Stanford: about 8 miles to Hustonville and about 10 miles to Crab Orchard. Road mileage can be longer because actual routes bend through the county’s valleys and hills. Use current navigation or transportation information when planning a trip.
Which map is best for locating Cedar Creek Lake and the Dix River?
The terrain-and-water map is the clearest choice. Cedar Creek Lake is shown as a distinct water body in eastern Lincoln County, while the Dix River forms a prominent winding line farther northeast. The shaded terrain also makes it easier to see the valleys around these water features than the general road map does.
Can the 234–437 meter elevation range be used for surveying or construction?
No. The elevation map is designed for county-scale geographic comparison. It reports an overall range of roughly 234–437 meters and a mean near 324 meters, but it does not provide survey-grade elevation at a specific property, road, or building site. Exact site work should use current source elevation data or professional field measurements.
Map File Information
The ZIP archive contains the original high-resolution JPG versions of the Lincoln County boundary-and-road map, city-connections map, terrain-and-water map, and elevation map. Each image is 2,572×3,638 pixels for printing, classroom work, presentations, and offline reference.
- File Type: 4 JPG files inside one ZIP archive
Related Maps
Sources and references
County-specific background can be checked through the Kentucky.gov Lincoln County profile and the Visit Lincoln County information page. For underlying geographic data, use the U.S. Census Bureau TIGER/Line Shapefiles for boundaries and transportation features, USGS National Hydrography for water features, and the USGS 3D Elevation Program for elevation data.
The maps here are intended for geographic explanation, printing, and general reference. Legal boundary decisions, flood or water-safety decisions, engineering design, navigation, roadway status, and field surveying should rely on the latest authoritative data from the responsible agency.
Green Map creates custom-edited map images using open geographic data sources such as geoBoundaries, Natural Earth, OpenStreetMap, and government open data. These maps are edited visual materials, not raw data files, and are provided for education, documents, presentations, and graphic reference.