U.S. petroleum-liquid consumption for useful thermal output was highly concentrated across states in 2024. The EIA series combines fueltypeid PEL, sectorid 98, and the field consumption-uto, with values reported in thousand barrels. All 50 states have numeric observations and none is missing. Maryland and Hawaii account for most of the measured volume, while 23 states report exactly zero.
This measure is not electricity generation and it is not total petroleum consumption. PEL identifies petroleum liquids, sector 98 identifies Electric Power, and consumption-uto is the fuel consumed for useful thermal output. Comparisons with other EIA petroleum series therefore require matching the fuel facet, sector, field, year, and unit rather than relying only on similar titles.
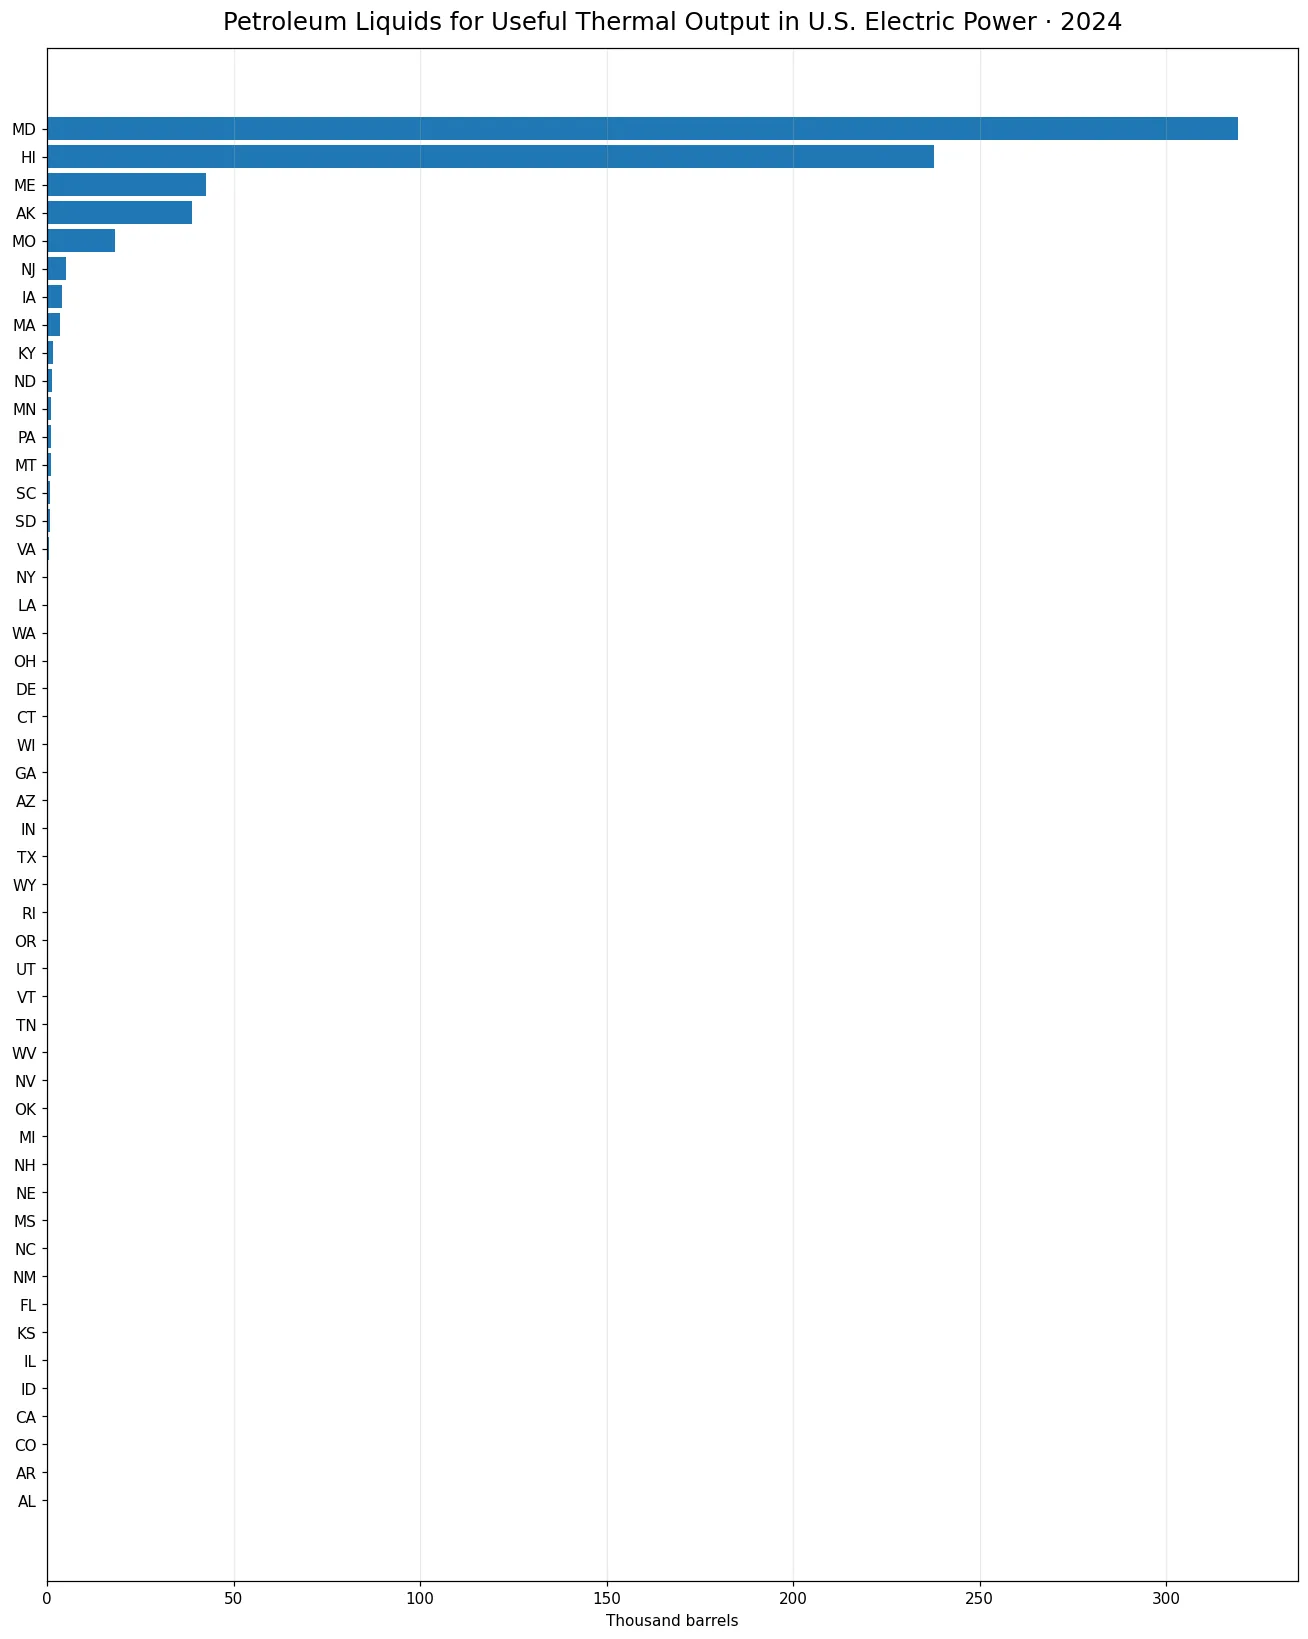
Table of Contents
Maryland and Hawaii accounted for most of the reported volume
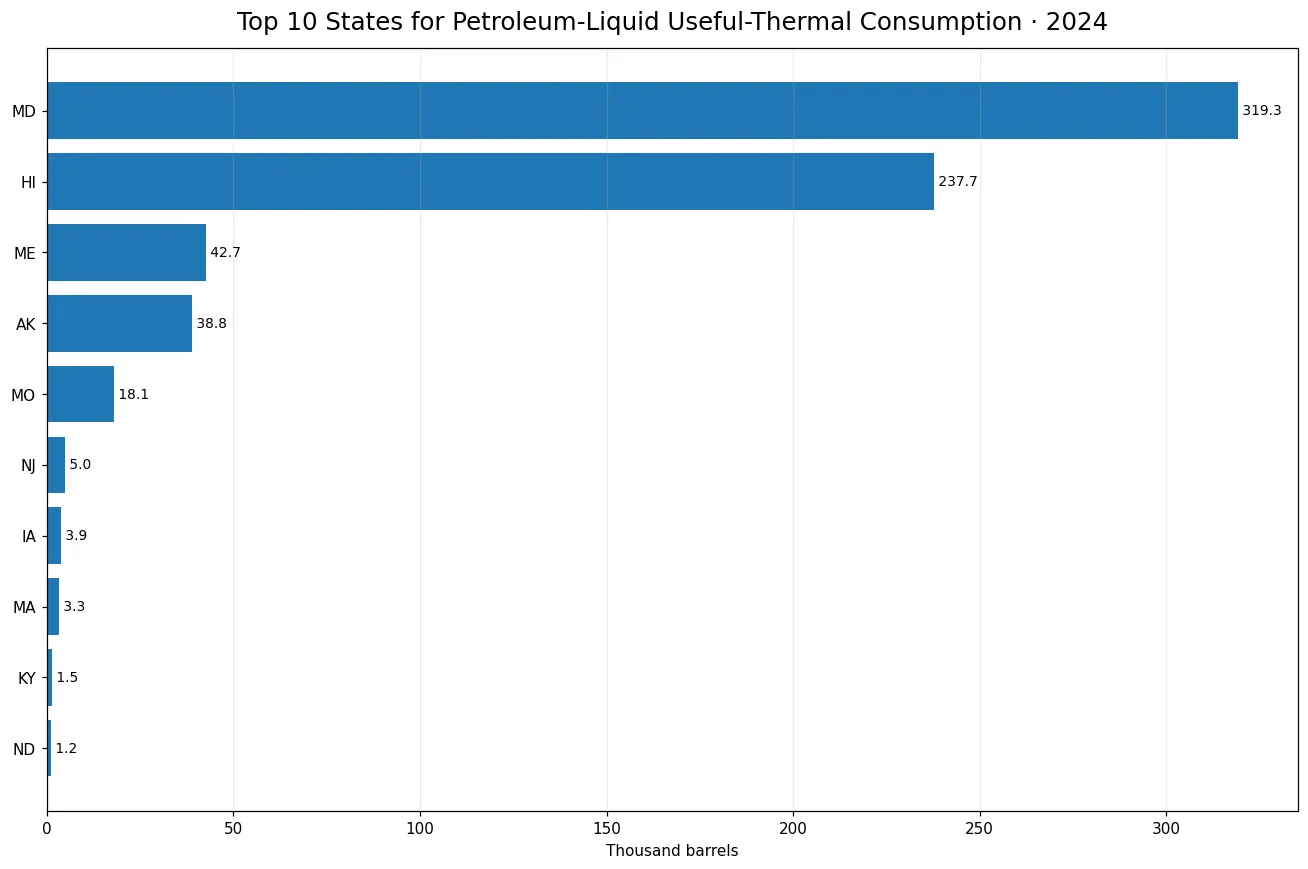
In 2024, Maryland reported 319.315 thousand barrels of petroleum liquids consumed for useful thermal output in EIA sector 98, while Hawaii reported 237.667 thousand barrels. Against the 50-state sum of 677.59239 thousand barrels, those values correspond to 47.12% and 35.08%. Together they account for 82.20% of the state total for this exact measure. Maine ranked third at 42.672 thousand barrels, followed by Alaska at 38.828 and Missouri at 18.097. The steep drop after the top two is the defining feature of the distribution.
The first five states account for 96.90% of the 50-state sum, and the top ten reach 99.09%. Those percentages should not be interpreted as shares of all U.S. petroleum consumption. They are shares within one EIA slice: fueltypeid PEL, sectorid 98, field consumption-uto, year 2024. Electricity-generation fuel use, broader petroleum categories, other economic sectors, and other years are outside the calculation. Keeping that scope fixed is essential because EIA tables contain many closely related fuel and sector combinations.
| State | Code | Consumption (thousand barrels) | Share of 50-state sum |
|---|---|---|---|
| Maryland | MD | 319.315 | 47.12% |
| Hawaii | HI | 237.667 | 35.08% |
| Maine | ME | 42.672 | 6.30% |
| Alaska | AK | 38.828 | 5.73% |
| Missouri | MO | 18.097 | 2.67% |
| New Jersey | NJ | 4.975 | 0.73% |
| Iowa | IA | 3.889 | 0.57% |
| Massachusetts | MA | 3.340 | 0.49% |
| Kentucky | KY | 1.459 | 0.22% |
| North Dakota | ND | 1.198 | 0.18% |
Twenty-three reported zeros are observations, not missing data
Twenty-seven states have positive values and 23 states report exactly zero. None of the 50 observations is missing. That distinction matters because a source-reported zero carries different information from an unavailable observation. No missing value was converted to zero, and no zero was converted to a blank. The median is only 0.0135 thousand barrels, the first quartile is zero, and the third quartile is 0.912 thousand barrels. Those statistics show that the typical state sits far below the two largest observations.
The arithmetic mean is 13.55185 thousand barrels, but the mean is not a good description of a typical state here. Maryland and Hawaii pull it upward sharply, while many states are at zero or well below one thousand barrels. Looking at the mean alone could suggest a moderately sized volume spread across the country, which is not what the state distribution shows. The count of positive observations, the number of zeros, the median, and concentration among the leading states provide a more faithful picture.
PEL is not interchangeable with the broader PET fuel category
The fuel facet for this series is PEL, identified by EIA as petroleum liquids. That is not automatically interchangeable with PET, the broader petroleum grouping used in other EIA slices. A post with a similar phrase such as petroleum consumption for useful thermal output can therefore contain different values if it uses a different fuel facet. The difference is definitional rather than contradictory. This article keeps the PEL identity explicit so the figures are not merged with a broader petroleum measure.
The unit is thousand barrels, a physical-volume measure. It is not million MMBtu and does not directly express the energy content of the fuel. Different petroleum liquids can have different heat content per barrel, so a physical-volume ranking does not have to match a Btu-based ranking exactly. The two measures answer related but different questions: barrels show how much liquid volume was consumed, while Btu measures the associated energy content.
Sector 98 and consumption-uto define a narrow use case
EIA sectorid 98 denotes Electric Power. Within that sector, consumption-uto refers to fuel consumed for useful thermal output. It is separate from generation, which records electricity output in MWh, and from consumption-for-eg, which tracks fuel consumed for electricity generation. Maryland’s 319.315 thousand barrels therefore should not be read as electricity generation, total state petroleum use, or total fuel use in the electric-power system. It is a physical fuel-consumption observation tied to a specific output purpose.
Useful thermal output can be relevant in contexts where heat is produced and used, but the state values do not by themselves explain why a state is high or low. The series contains quantity, geography, year, fuel facet, sector, and field identity; it does not contain plant configurations, contracts, operating decisions, prices, or local thermal-demand conditions. Any causal explanation would require additional evidence. The strongest conclusion from these observations is about the distribution itself, not the reason behind it.
The scale falls quickly below the leading states
After Maryland and Hawaii, Maine reported 42.672 thousand barrels, Alaska 38.828, and Missouri 18.097. New Jersey followed at 4.975, Iowa at 3.889, Massachusetts at 3.340, Kentucky at 1.459, and North Dakota at 1.19839. By the tenth position, nearly all of the total measured volume has already been captured. The remaining positive states each contribute a very small part of the 50-state sum.
This is an absolute quantity rather than a rate adjusted for population, total generation, installed capacity, or economic size. A high value does not necessarily mean a high petroleum share in the state’s power system, and a low value does not necessarily indicate low petroleum dependence overall. To evaluate those questions, a denominator such as total generation, total fuel input, or another consistent sector measure would be needed. The current measure is valuable precisely because it isolates one narrow use of petroleum liquids.
Hawaii and Alaska should not be over-interpreted from absolute volume alone
Hawaii’s 237.667 thousand barrels and Alaska’s 38.828 thousand barrels place both states near the top of this distribution. However, the data do not supply the denominator needed to calculate what fraction of either state’s entire electric-power system those volumes represent. Absolute consumption and system share are different concepts. A state can have a high absolute amount while still having a different overall generation mix, or a lower amount while other petroleum uses occur outside this field.
Maryland’s 47.12% figure has the same limitation. It is a share of the 50-state sum for PEL, sector 98, consumption-uto in 2024, not a claim that Maryland used 47.12% of all U.S. petroleum. Stating the denominator is especially important when the distribution is highly concentrated. Large percentages can easily be generalized beyond the measurement if the scope is omitted.
Small positive observations are distinct from exact zeros
Several positive values are tiny. A state with 0.026 thousand barrels still has a positive source observation and should not be collapsed into the zero group through aggressive rounding. Preserving that distinction matters for the positive-state count and for any distributional analysis. The same principle applies in the other direction: an exact zero should not be displayed as a small positive value merely to make a chart appear more continuous.
In this 50-state series, whether a state is positive at all is informative because 23 states are exactly zero. The distribution is therefore not simply a smooth ranking from large to small values. It contains a substantial mass at zero, a long range of very small positive values, and two exceptionally large observations. That combination is why the median, quartiles, and positive-state count are more revealing than the mean alone.
Physical units and heat-content measures can complement each other
A useful comparison for this topic is between the physical-unit series and a Btu-based heat-content series. Thousand barrels describe liquid volume. Million MMBtu describe energy content. If the composition of petroleum liquids differs across states, the ranking in barrels may differ from the ranking in Btu. A mismatch between those rankings is not necessarily an error; it can arise because the measures capture different properties of the fuel.
The same caution applies when comparing this PEL series with PET-based petroleum statistics. Similar public-language descriptions can hide different EIA facet identities. Before comparing two values, the fueltypeid, sectorid, field, year, and unit should all be checked. This is particularly important for EIA operational data because many combinations sound nearly identical in natural language while representing different populations or measurement concepts.
What this metric can and cannot answer
This dataset directly supports questions about which states reported more or less petroleum-liquid consumption for useful thermal output in Electric Power during 2024, how concentrated the values are, how many observations are zero, and how the central distribution differs from the leading states. It does not directly answer questions about fuel prices, electricity prices, emissions, plant efficiency, facility counts, or the causes of state differences.
It also should not be used as a stand-alone score of energy transition or petroleum dependence. A zero in this field does not mean a state has no petroleum use in electricity, and a high value does not prove broad dependence on petroleum. The field captures one defined use. Broader conclusions require generation data, total fuel input, technology information, and possibly plant-level records. The safest reading is to preserve the exact metric boundary and expand context only with matching official series.
Three facts summarize the 2024 pattern
First, Maryland and Hawaii together account for 82.20% of the state sum. Second, 23 of 50 states report exactly zero while only 27 are positive. Third, the mean of 13.55185 thousand barrels is far above the median of 0.0135 because the distribution is dominated by a small number of large observations. These facts together explain why a simple national-looking average would be misleading.
The main insight is therefore not just the identity of the leading state. The stronger pattern is concentration: petroleum-liquid consumption for useful thermal output in this EIA Electric Power slice is heavily concentrated in a few states and absent as a positive reported value in nearly half of them. Future year-to-year comparisons should keep the same fuel, sector, field, and unit so that changes reflect the series rather than a change in definition.
Frequently Asked Questions
Which state reported the most petroleum-liquid consumption for useful thermal output in 2024?
Maryland led with 319.315 thousand barrels, equal to 47.12% of the 50-state sum for this exact EIA series.
Are the 23 zero values missing observations?
No. All 50 states have numeric observations; 23 are reported as exactly zero and none is missing.
Does this measure petroleum-fired electricity generation?
No. PEL sector 98 consumption-uto measures physical petroleum-liquid consumption for useful thermal output in thousand barrels, not MWh generation.
Are PEL and PET the same petroleum category?
No. PEL is the petroleum-liquids fuel facet, while PET is a broader petroleum grouping used in other EIA series.
Related Articles
Green Map creates custom-edited map images using open geographic data sources such as geoBoundaries, Natural Earth, OpenStreetMap, and government open data. These maps are edited visual materials, not raw data files, and are provided for education, documents, presentations, and graphic reference.