Agricultural land occupies dramatically different amounts of space from one country to another. In the World Bank’s 2023 agricultural land area indicator (AG.LND.AGRI.K2), China reports about 5.20 million km², the United States about 4.22 million km², and Australia about 3.63 million km². At the other end of the distribution, several small islands and city economies report only a few or a few dozen square kilometres. These differences reflect national land area and land-use structure as much as they reflect farming itself.
The 2023 comparison contains 217 country and territory rows, of which 209 have numeric values. Eight rows do not have a 2023 observation. Those missing entries remain missing rather than being converted to zero. The map and tables therefore compare reported agricultural land area, not an assumed value for places without a 2023 observation.
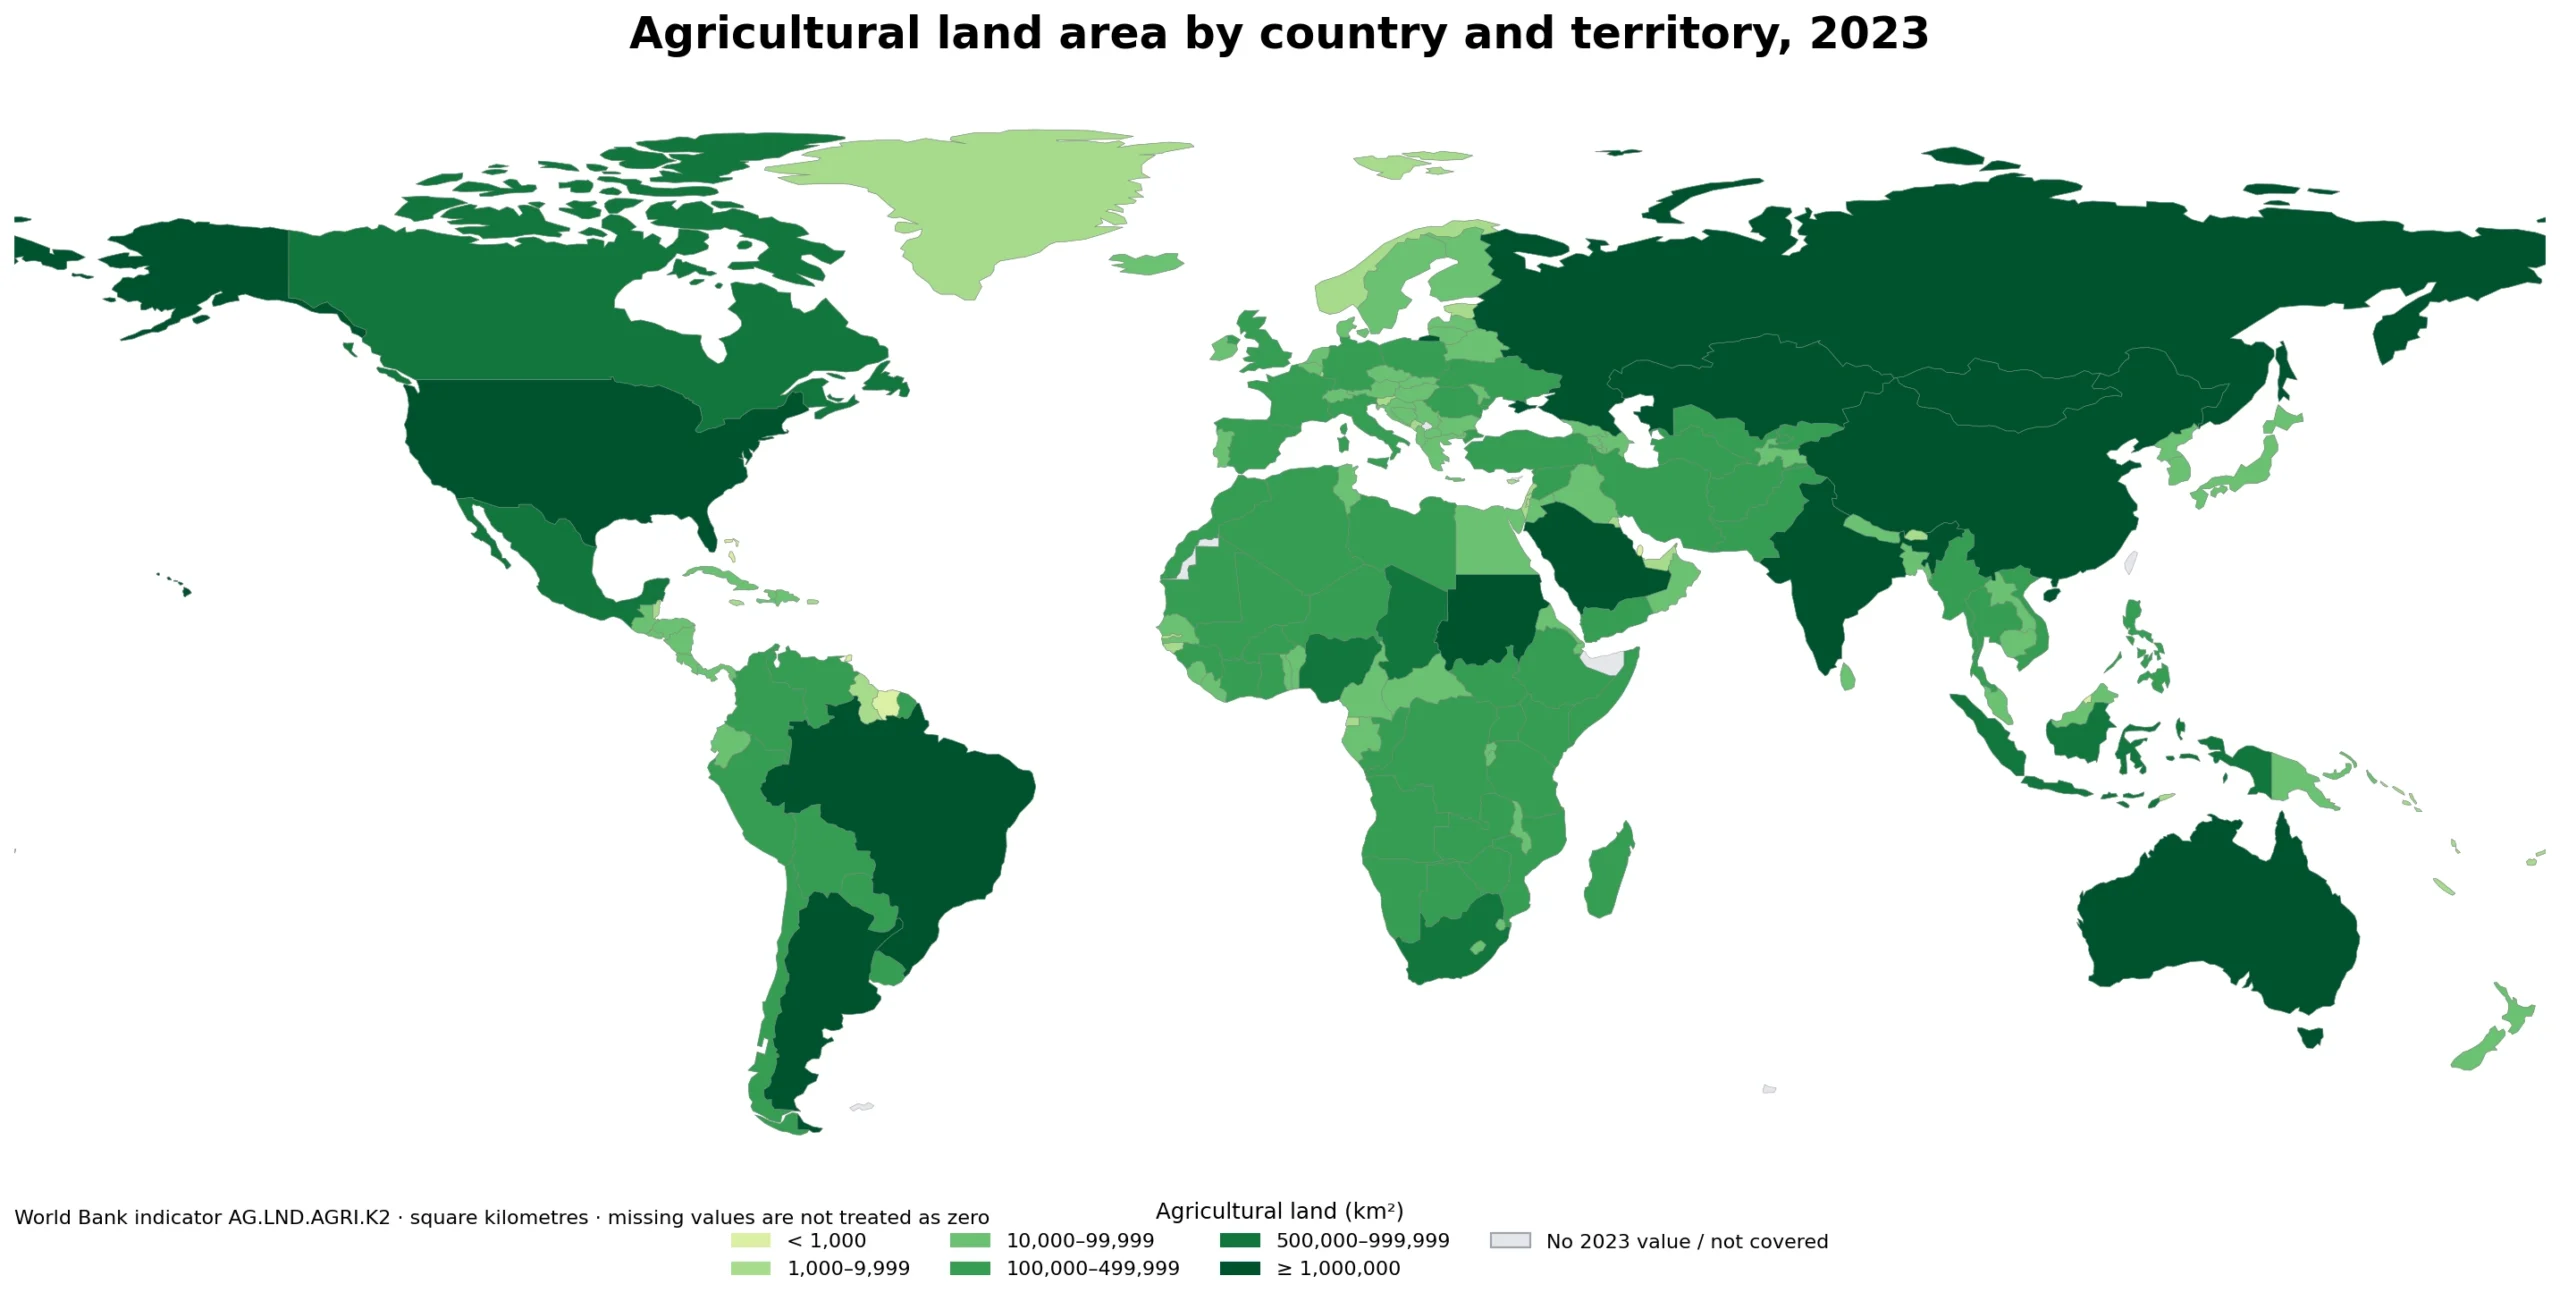
Table of Contents
What counts as agricultural land
The World Bank definition of agricultural land combines arable land, land under permanent crops, and permanent pasture. Arable land includes land used for temporary crops and related temporary agricultural uses. Permanent crops include crops that occupy the land for long periods without being replanted after each harvest, such as many fruit trees, coffee, cocoa, rubber, vines, and similar crops. Permanent pasture covers land used for forage and grazing over a sustained period.
That definition is broader than cropland alone. A country with extensive grazing land can record a very large agricultural land area even if only a smaller part of that area is intensively cultivated. This helps explain why countries with large dryland or grassland systems can rank highly alongside major crop-producing countries. The indicator measures land use in square kilometres; it does not measure output, yields, farm income, or the value of agricultural production.
How wide is the 2023 distribution
Among the 209 numeric observations, the median agricultural land area is about 28,730 km². The first quartile is about 1,840 km² and the third quartile about 170,095 km². In other words, the middle half of the observations falls roughly between those two figures. The mean is much higher at about 229,290 km², showing how strongly a small group of very large countries pulls the average upward.
Eleven countries and territories have at least one million km² of agricultural land, 17 have at least 500,000 km², and 70 have at least 100,000 km². At the other end, 44 observations are below 1,000 km². Because the distribution spans several orders of magnitude, a map with a single linear scale would compress most countries into a narrow visual range. The grouped legend is designed to separate small, medium, and very large land areas more clearly.
Countries with the largest agricultural land areas
China has the largest reported 2023 value at 5,204,130 km². The United States follows at about 4,215,404 km², and Australia at about 3,632,437 km². Brazil reports 2,367,588 km², while the Russian Federation and Kazakhstan each exceed 2.1 million km². These are enormous physical areas, and in several cases permanent pasture contributes substantially to the total.
| Country or territory | Agricultural land area |
|---|---|
| China | 5.20 million km² |
| United States | 4.22 million km² |
| Australia | 3.63 million km² |
| Brazil | 2.37 million km² |
| Russian Federation | 2.16 million km² |
| Kazakhstan | 2.14 million km² |
| India | 1.79 million km² |
| Saudi Arabia | 1.74 million km² |
| Argentina | 1.16 million km² |
| Sudan | 1.13 million km² |
India, Saudi Arabia, Argentina, and Sudan complete the top ten. Their positions should not be read as a ranking of agricultural productivity. Two countries can have similar agricultural land areas but very different crop mixes, rainfall, irrigation systems, stocking rates, yields, and levels of mechanisation. A large area is a statement about the spatial extent of land classified for agricultural use, not about how much food or economic value each square kilometre produces.
Absolute area and land share answer different questions
Agricultural land area in square kilometres and agricultural land as a percentage of land area describe different aspects of the same land-use system. A very large country can have an enormous agricultural area even if agriculture occupies only a moderate share of its territory. A small country can devote a high share of its land to agriculture while still having a small absolute area. For that reason, the rankings for total area and percentage share can look very different.
Absolute area is useful when the question is how much physical land is involved. It helps identify where farming and grazing systems extend across very large landscapes and where land-use change could affect large areas. The percentage indicator is better for asking how strongly a country’s territory is oriented toward agricultural use. Reading both measures together separates scale from intensity of land use.
How to interpret very small values
The smallest reported values include Bermuda at 3 km², Nauru at 4 km², the Northern Mariana Islands at 5.4 km², and Singapore at 6.6 km². Small absolute areas do not automatically imply that agriculture has no local importance. Small islands and city economies simply have limited land available, and they may rely more heavily on food imports, use intensive production methods, or specialise in particular crops or horticultural systems.
A world map also has practical limits for very small islands and territories. Of the 209 numeric 2023 observations, 169 are represented by country polygons at this world scale. Some small places are too small to be clearly visible or are not separately represented in the underlying world boundary layer. A place that is difficult to see on the map can still have a valid statistical observation, so detailed values should be read from the data table rather than inferred from whether a tiny polygon is visible.
Eight missing 2023 values should not be read as zero
The eight rows without a 2023 numeric value are Channel Islands, Curaçao, Gibraltar, Macao SAR China, St. Martin (French part), Monaco, Sint Maarten (Dutch part), and Kosovo. They are excluded from the summary statistics and ranking because a missing observation is not evidence of zero agricultural land.
Some of these places may have observations for other years, but mixing older values into a 2023 comparison would blur the time reference. Keeping the year fixed makes the cross-country comparison easier to interpret. A separate time-series analysis would be the appropriate way to study older observations or changes through time.
Regional patterns visible on the map
The largest area classes appear across several very large landmasses: China and India in Asia, the United States and Canada in North America, Brazil and Argentina in South America, Australia in Oceania, and the Russian Federation and Kazakhstan across Eurasia. Mongolia also exceeds one million km². In western Asia, Saudi Arabia stands out because the indicator includes extensive permanent pasture as well as arable and permanent-crop land.
Africa contains several large agricultural land areas as well, including Sudan, South Africa, Nigeria, Chad, Niger, and Angola. These patterns should not be reduced to climate or crop production alone. The indicator’s inclusion of pasture means that dryland grazing systems can occupy very large areas. A dark map category therefore does not necessarily mean dense cultivation. More specific indicators, such as arable land, harvested area, irrigated area, or crop-specific land use, are needed to answer narrower questions.
What this indicator can and cannot tell you
AG.LND.AGRI.K2 is useful for comparing the physical scale of land used for agriculture and grazing. It can show where agricultural land extends over exceptionally large territories, how widely total area varies among countries, and which regions contain clusters of large land-use systems. Because the comparison holds the reference year at 2023, it also avoids the ambiguity that comes from mixing each country’s latest available year.
The indicator does not measure agricultural productivity, food security, farm profitability, employment, or environmental sustainability. Productivity requires output relative to land or other inputs; economic importance requires measures such as value added or share of GDP; food security depends on supply, access, trade, and affordability; environmental assessment requires information on soil, water, forests, biodiversity, and emissions. Agricultural land area is therefore a useful baseline, but not a complete description of an agricultural system.
Source and how to read the map
The source is the World Bank’s World Development Indicators, indicator AG.LND.AGRI.K2, measured in square kilometres for 2023. The indicator follows the agricultural land definition used in international land-use statistics, combining arable land, permanent crops, and permanent pasture. The 2023 dataset contains numeric observations for 209 of 217 country and territory rows.
For practical comparison, start with absolute area and then check agricultural land as a share of total land area. When both are high, a country has both a large physical agricultural area and a strong land-use concentration. When only absolute area is high, national size may be the dominant factor. When the share is high but total area is small, agriculture occupies much of a small territory. Keeping those two perspectives separate prevents the map from being mistaken for a measure of productivity or agricultural dependence.
Frequently Asked Questions
How many countries and territories have a 2023 agricultural land value?
There are 209 numeric observations among 217 country and territory rows. Eight rows are missing for 2023, and missing values are not treated as zero.
Does agricultural land mean cropland only?
No. World Bank indicator AG.LND.AGRI.K2 combines arable land, permanent crops, and permanent pasture.
Does a larger agricultural land area mean higher agricultural productivity?
No. This indicator measures physical area. Productivity requires output or value added relative to land or other inputs.
Related Articles
Green Map creates custom-edited map images using open geographic data sources such as geoBoundaries, Natural Earth, OpenStreetMap, and government open data.
These maps are edited visual materials, not raw data files, and are provided for education, documents, presentations, and graphic reference.