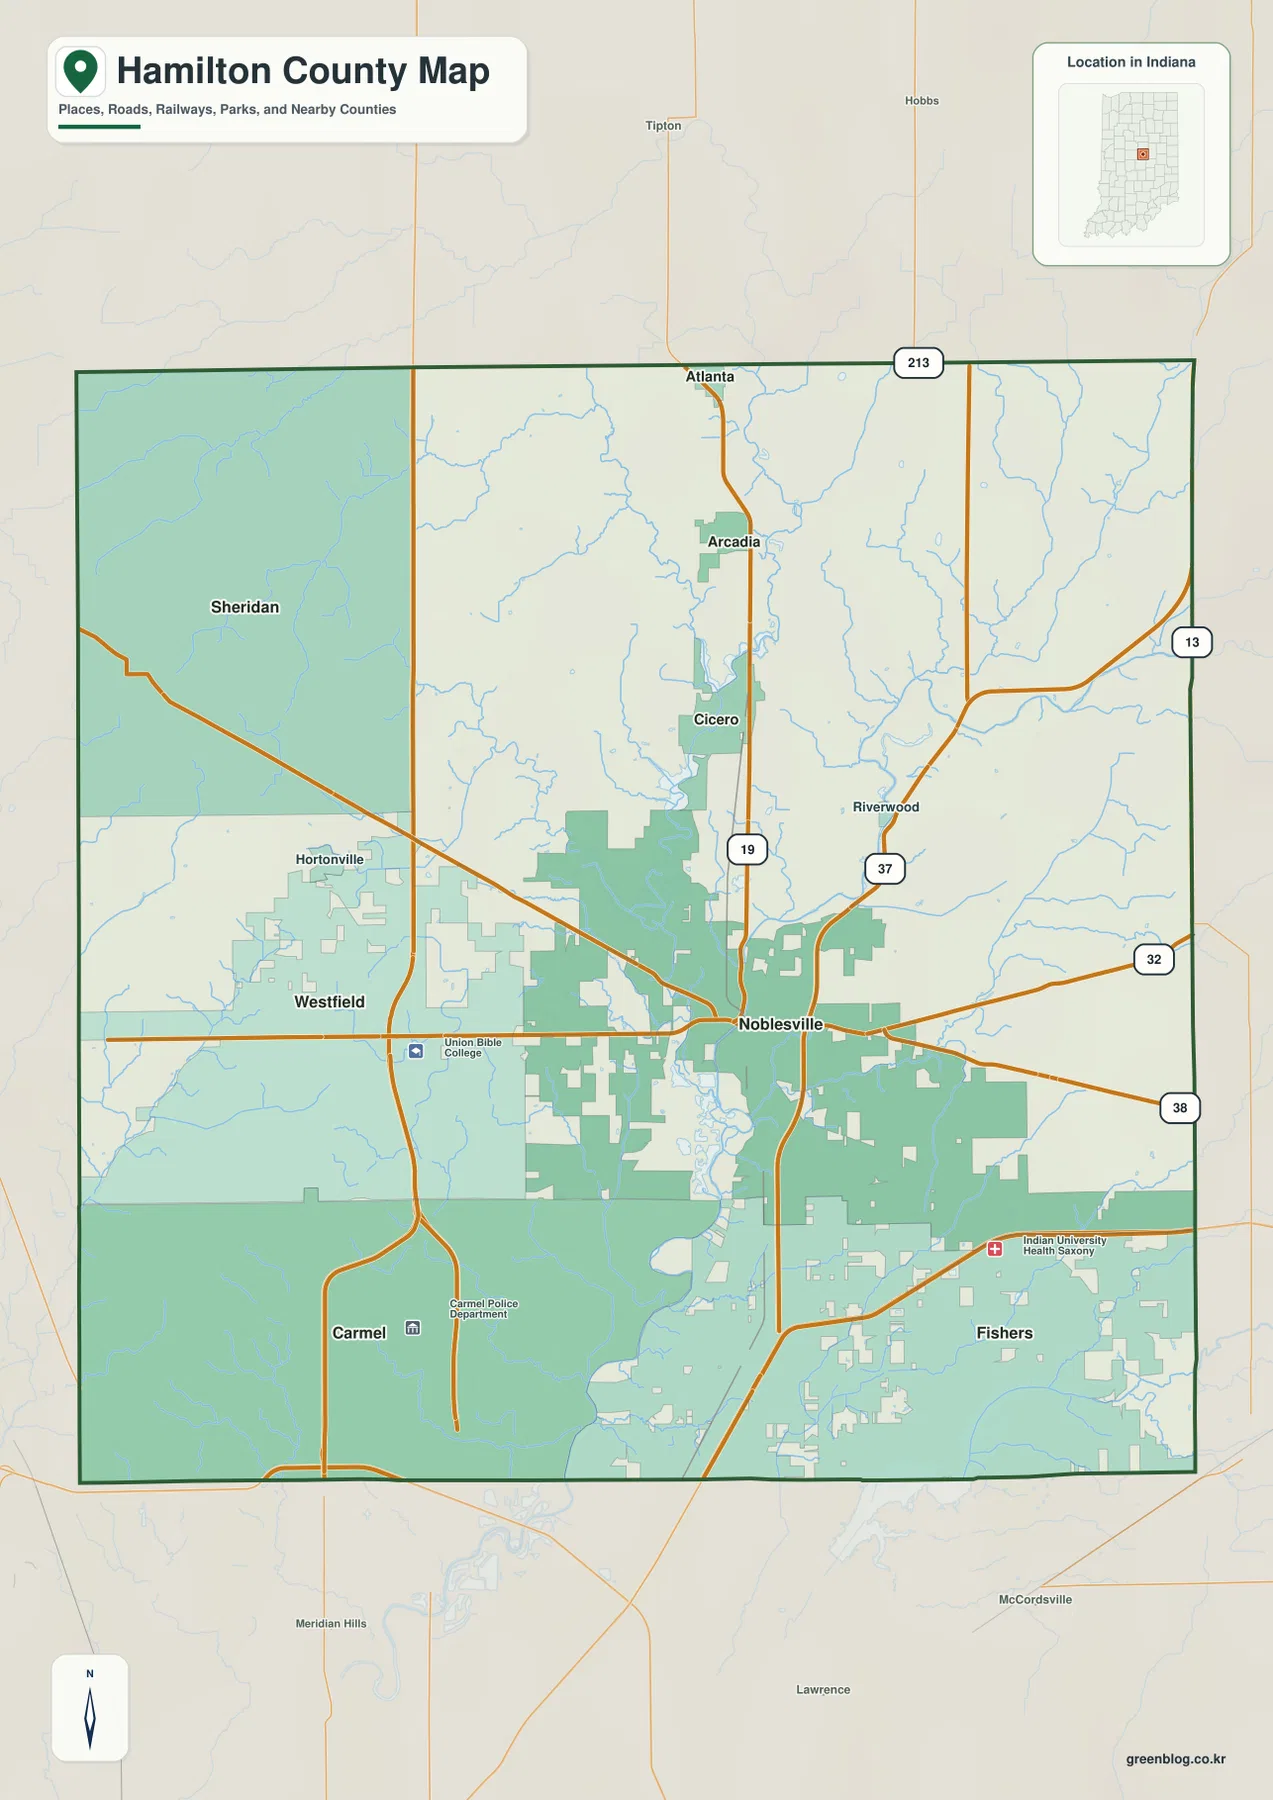
Tupelo is the best first reference for reading Lee County, Mississippi. I-22/US 78 and US 45 meet around the county’s main urban area, and the same road pattern helps place Saltillo, Guntown, and Baldwyn to the north while Verona and Shannon extend southward. This page also follows Town Creek and several named lakes, then uses the elevation view to compare the broad lower ground around central Lee County with the much more dissected hills on the eastern side. The complete A3 high-resolution JPG map files can be downloaded as a ZIP near the end of the article.
Lee County looks very different depending on which layer is emphasized. The general map makes Tupelo’s transportation role obvious, the city view shows a clear north-south settlement pattern, and the water map reveals a dense network of creeks that is easy to miss beneath the road system. Elevation adds another important piece: central and southern valleys stay relatively low while the east and northeast rise into closely spaced ridges and narrow drainage cuts.
Table of Contents
Tupelo organizes the county road network
On the county reference map, Tupelo occupies the largest developed area and sits at the center of the strongest road connections. I-22/US 78 carries traffic east and west, while US 45 runs north toward Saltillo, Guntown, and Baldwyn and south toward Verona and Shannon. Mooreville appears to the east, and the southeastern side includes Plantersville and Nettleton. Once those directions are established, the rest of the county is much easier to place.
The map also labels North Mississippi Medical Center south of central Tupelo and the Itawamba Community College–Tupelo location on the eastern side of the urban area. Those institutions are useful landmarks at county scale because they show how far the developed Tupelo area extends beyond a single downtown point. Additional route shields include MS 348 and MS 370 in the north, MS 363 and MS 371 to the east, and MS 178, 76, and 245 on the western and southern approaches.
Cities line up north and south of Tupelo
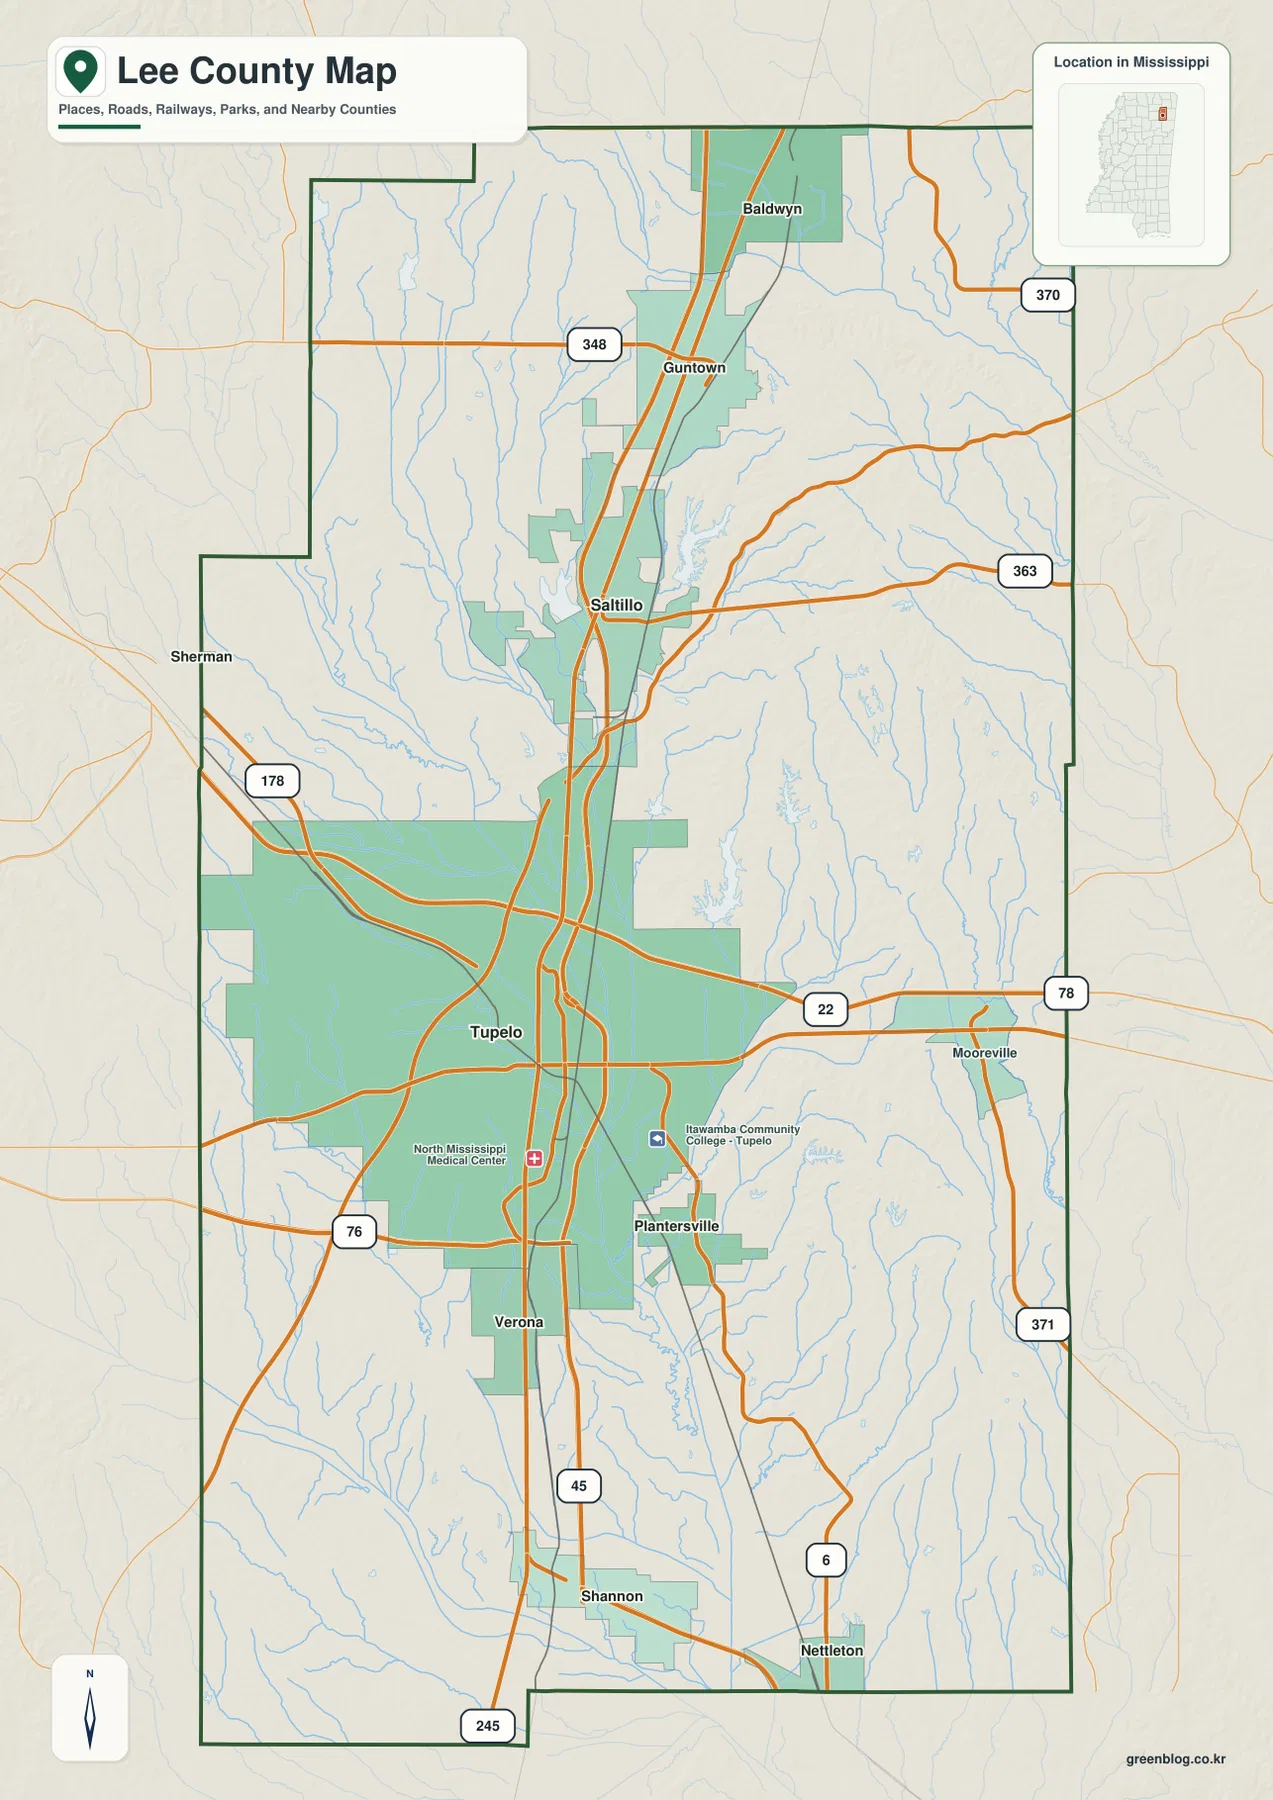
The ranked city map lists Tupelo first at 37,791 people. Saltillo follows at 4,952, Baldwyn at 3,138, Guntown at 2,594, Verona at 2,748, and Shannon at 1,383. The ranking is useful for scale, but the geography is even more informative: Saltillo, Guntown, and Baldwyn form a sequence north of Tupelo, while Verona and Shannon continue south. That gives Lee County a long settlement spine rather than a pattern in which the principal towns are scattered evenly in every direction.
Baldwyn sits close to the northeastern county line with Prentiss County immediately beyond it. Union and Pontotoc counties are shown on the western side, Itawamba County lies to the east, Chickasaw County appears farther east-southeast, and Monroe County is labeled southwest of the lower county boundary. These neighboring labels help explain why Tupelo functions as a regional center: the main roads lead toward several county boundaries within a relatively short distance.
Town Creek and a network of smaller water features
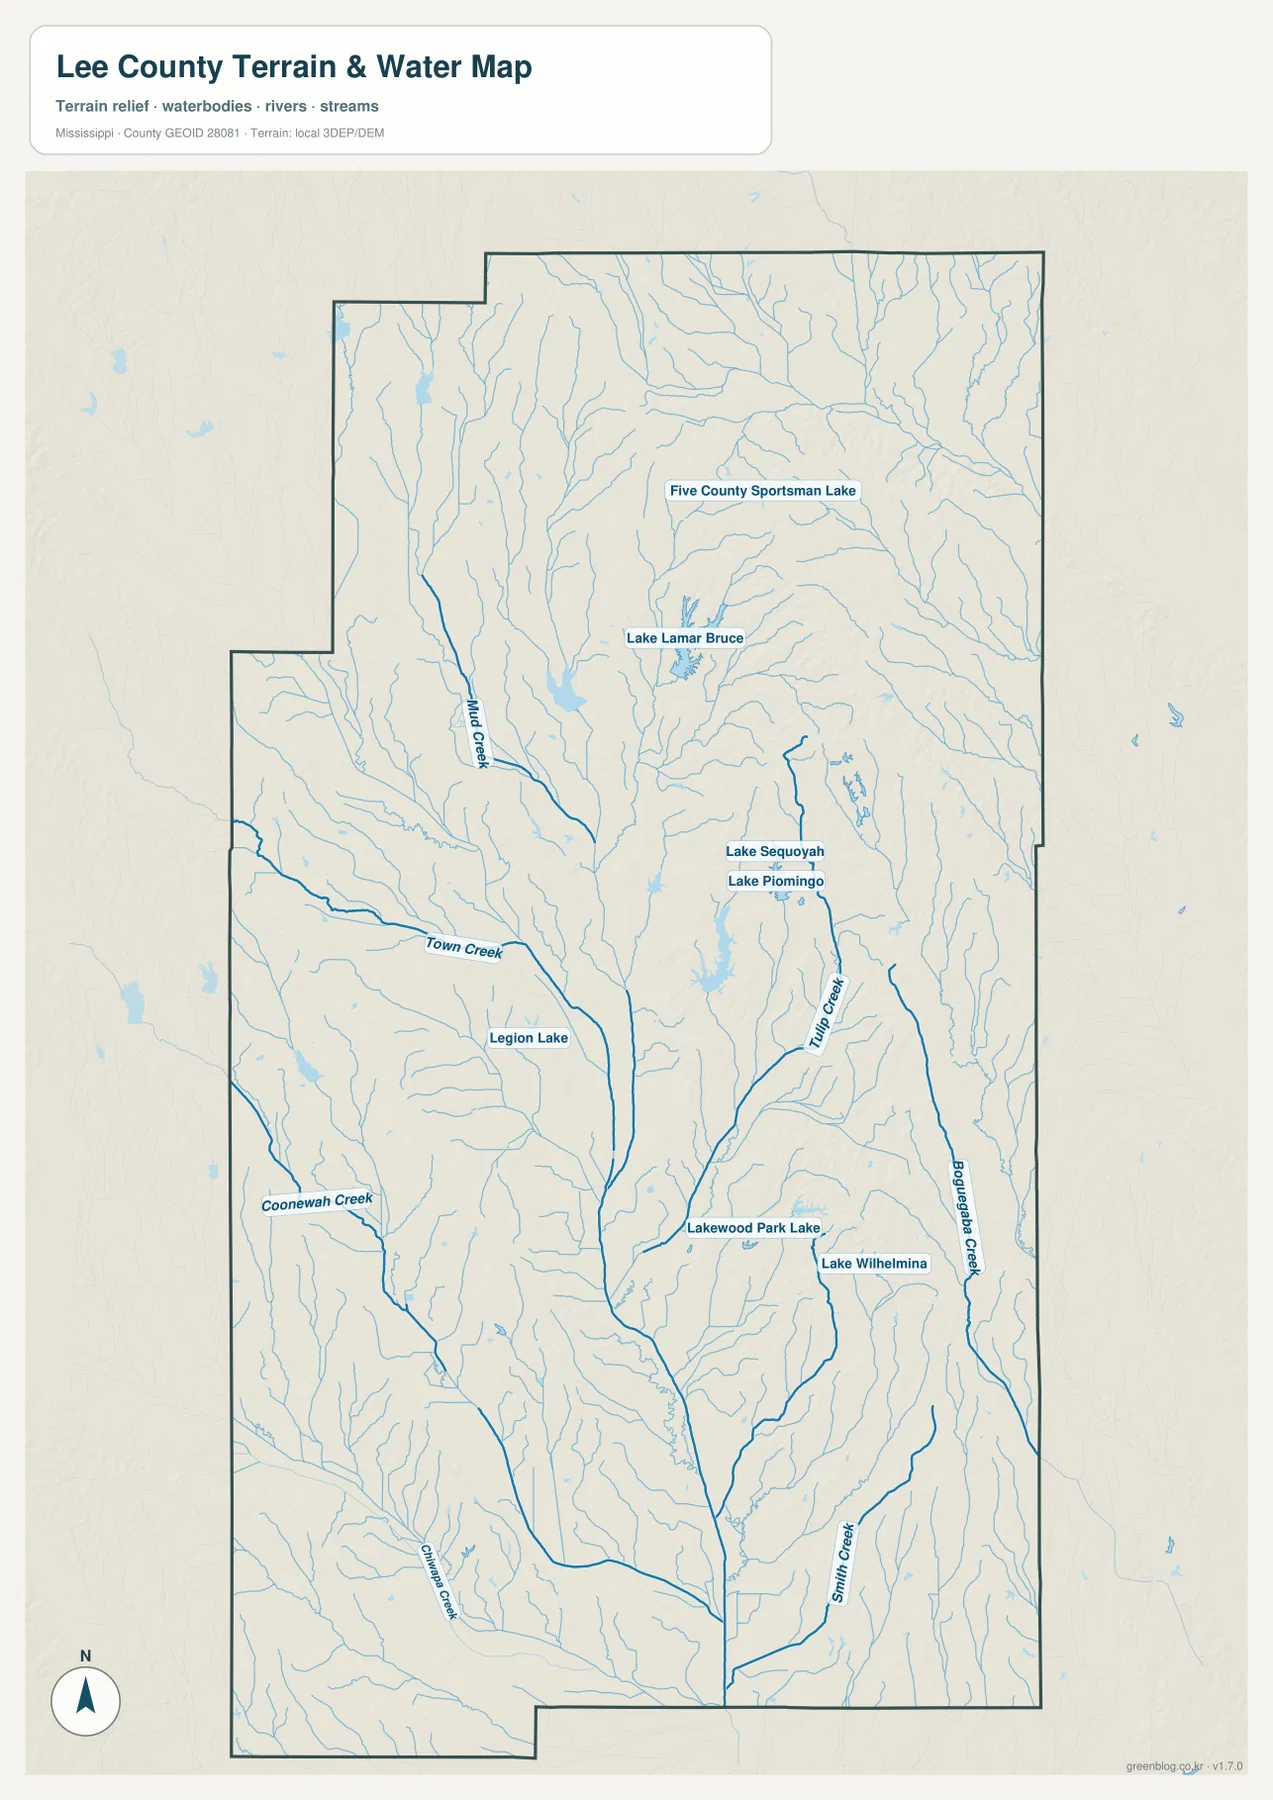
The water map does not show one dominant reservoir filling a large part of Lee County. Instead, streams and smaller lakes are spread across the county. Town Creek is one of the strongest named channels, entering from the west and continuing toward the central drainage system. Mud Creek runs through the northwestern half, while numerous unnamed tributaries branch from higher ground into the larger channels. The eastern half is especially dense with narrow stream valleys.
Several lakes provide useful local landmarks. Five County Sportsman Lake and Lake Lamar Bruce are in the northern half. Lake Sequoyah and Lake Piomingo sit near one another in the east-central area, while Legion Lake is closer to the central part of the county. Lakewood Park Lake appears farther south near the developed corridor, and Lake Wilhelmina lies to the east. These water bodies are small compared with the county as a whole, but together with the creeks they make the drainage geography much easier to follow.
A lower central corridor bordered by higher eastern hills
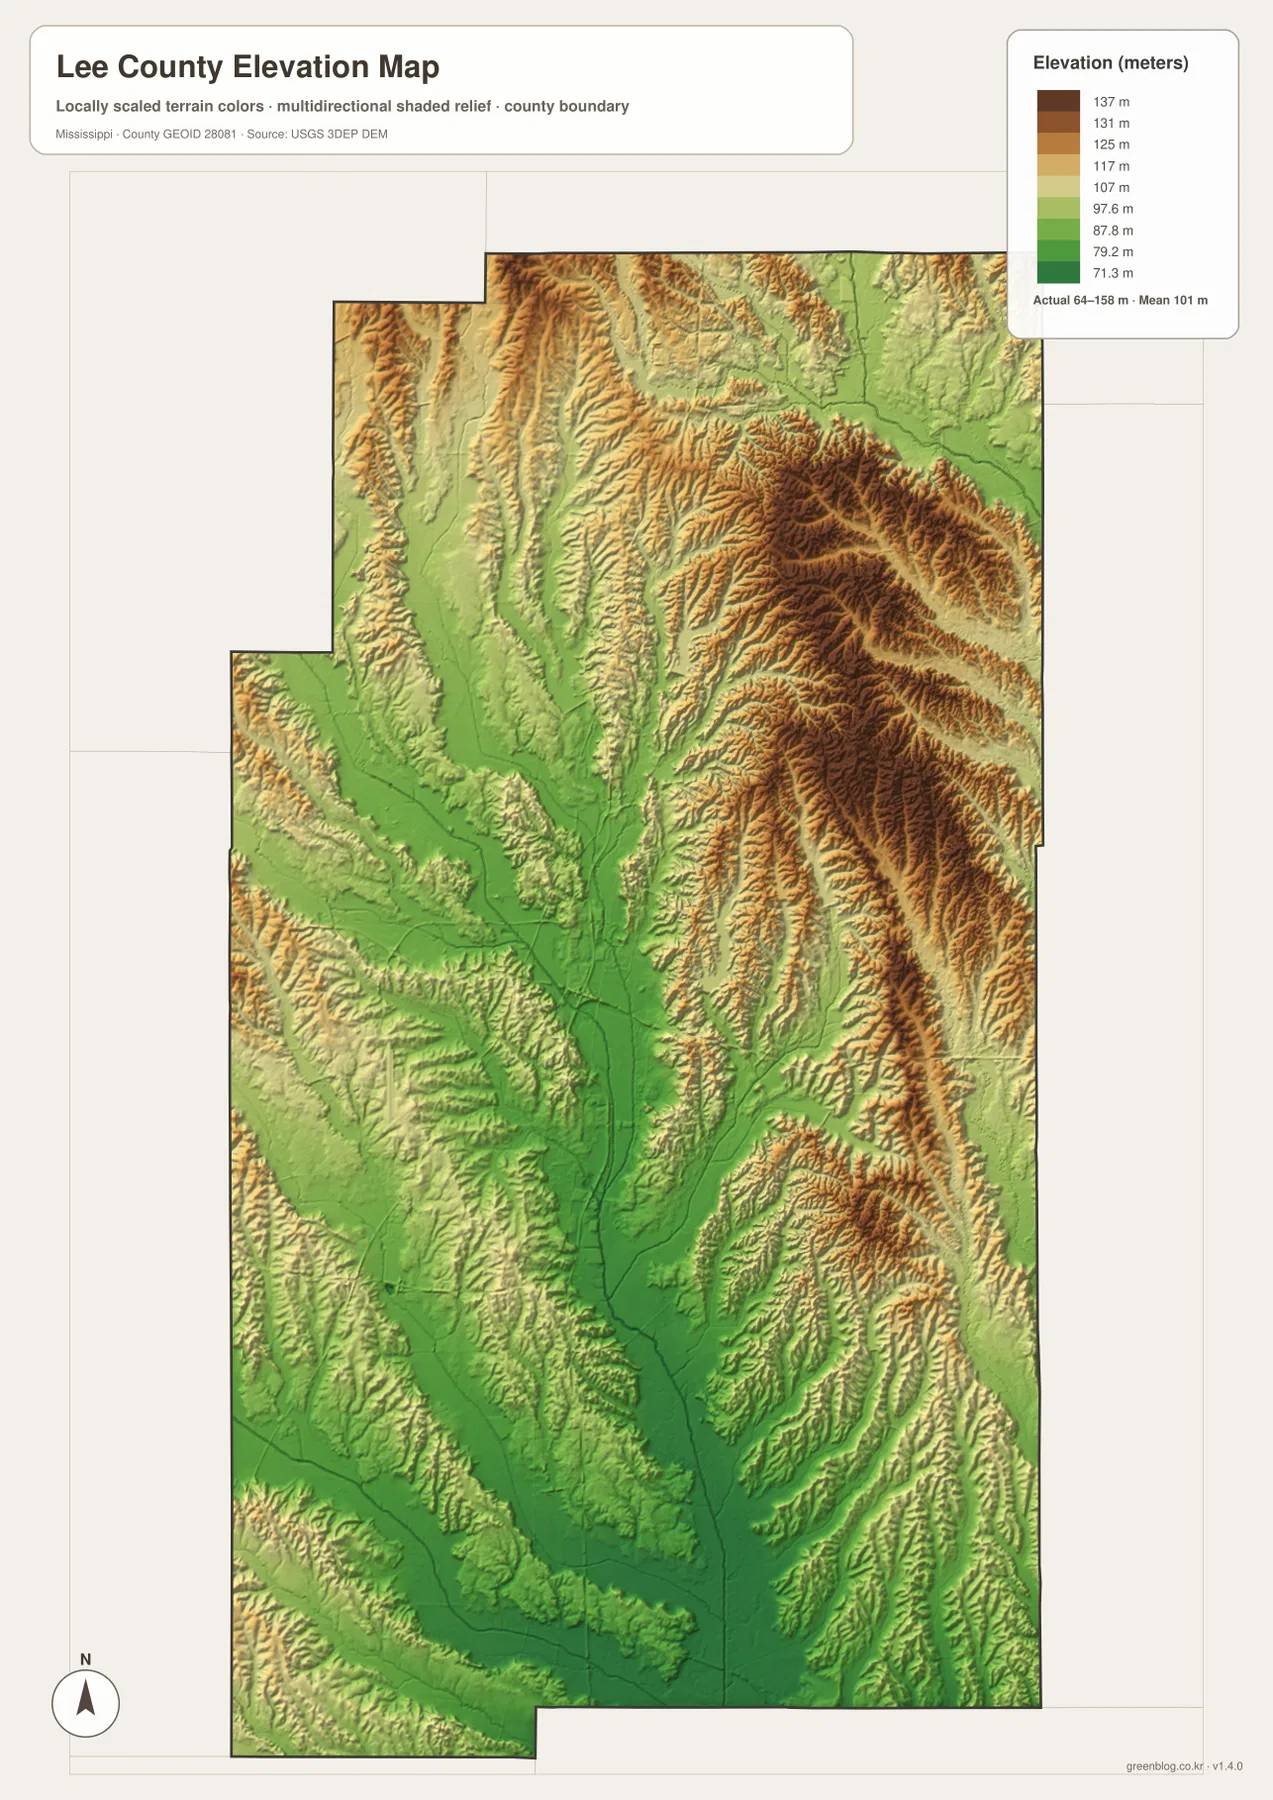
The elevation map gives an actual range of about 64 to 158 meters, with a mean near 101 meters. A broad green corridor runs through much of the central county from north to south, including the Tupelo area and lower ground farther south. In contrast, the eastern and northeastern parts of the map contain darker brown ridges separated by many narrow valleys. The difference is strong enough to make the two sides of the county look like separate terrain zones even though the overall elevation range is modest.
Western Lee County also contains rolling ridges, but they are generally less extensive than the tightly packed high ground on the east. Many creek channels appear as green fingers cutting into the hills, which matches the branching water network shown on the separate hydrography map. The elevation colors are locally scaled, so the brown areas should be understood as higher hills within Lee County rather than mountain terrain. Their importance is the contrast they create with the lower central and southern valleys.
Population and area numbers make more sense beside the maps
U.S. Census Bureau material in the package lists a 2020 census population of 83,343 and a July 2025 estimate of 83,731. Those figures have different reference dates and methods, so they should not be treated as two identical census counts. The 2025 Gazetteer lists 449.965 square miles of land and 3.210 square miles of water for Lee County.
Using the 2020 population and the listed 2025 land area produces a countywide average of about 185.2 residents per square mile. That number is helpful for comparing Lee County with other counties, but the city map shows why it cannot describe settlement block by block. Tupelo is much larger than the other ranked municipalities, and the developed central corridor differs sharply from the more rural hills and creek valleys farther east and west.
The water-area figure also needs map context. Only a small share of the county is classified as open water, yet the water map contains a large number of streams and small lakes. Long, narrow channels can shape valleys and road placement without contributing much to total surface-water area. Reading the statistical summary beside the maps therefore gives a more accurate picture than relying on a single density or area number.
Choose the view that matches the question
For basic orientation, begin with Tupelo and trace I-22/US 78 and US 45. That quickly establishes the directions to Saltillo, Guntown, Baldwyn, Verona, Shannon, and the neighboring counties. The city map is better when the goal is comparing the larger municipalities without the distraction of many secondary route labels. For a creek or lake name, the water view is more direct because the drainage lines are emphasized.
The elevation image is the best companion when a road or stream alone does not explain the landscape. Comparing it with the water map shows how Town Creek and smaller tributaries occupy lower corridors between ridges, especially in the east. The four images can be viewed independently, but switching between them often answers questions that a single all-purpose map cannot.
The WebP images in the article are page previews. For printing, presentations, or keeping an original local reference, use the downloadable archive below. It contains the county, city, water, and elevation maps as high-resolution A3 JPG files, so each map can be printed or reused without relying on the smaller web preview.
Frequently Asked Questions
Why is Tupelo the easiest starting point on the Lee County map?
Tupelo is the largest city shown and sits where the strongest road references meet, especially I-22/US 78 and US 45. Once Tupelo is located, the northern line of Saltillo, Guntown, and Baldwyn and the southern line through Verona and Shannon become much easier to follow.
Which water features are the best first references?
Town Creek and Mud Creek are useful stream anchors, while Lake Lamar Bruce, Lake Sequoyah, Lake Piomingo, Legion Lake, and Lakewood Park Lake provide recognizable local points. Together they show that Lee County’s water geography is a network of smaller channels and lakes rather than one dominant reservoir.
Why does eastern Lee County look much rougher on the elevation map?
The east and northeast contain more closely spaced ridges and narrow creek valleys than the broad central corridor. The county’s mapped elevation ranges from about 64 to 158 meters, with a mean near 101 meters, so the darker brown areas represent locally higher hills rather than mountains.
Map File Information
The ZIP contains the Lee County reference, city, water, and elevation maps as high-resolution A3 JPG files.
- Included Files: 4 map JPGs
- File Type: JPG
Related Maps
Sources and References
- U.S. Census Bureau QuickFacts – Lee County
- U.S. Census Bureau Gazetteer Files
- Mississippi Department of Transportation official highway map
- USGS National Hydrography
- USGS 3D Elevation Program
Green Map creates custom-edited map images using open geographic data sources such as geoBoundaries, Natural Earth, OpenStreetMap, and government open data. These maps are edited visual materials, not raw data files, and are provided for education, documents, presentations, and graphic reference.